Week 3 - Solving second order ODEs
AIM:
- Write a program to simulate the motion of a pendulum, using Matlab.
CONCEPT:
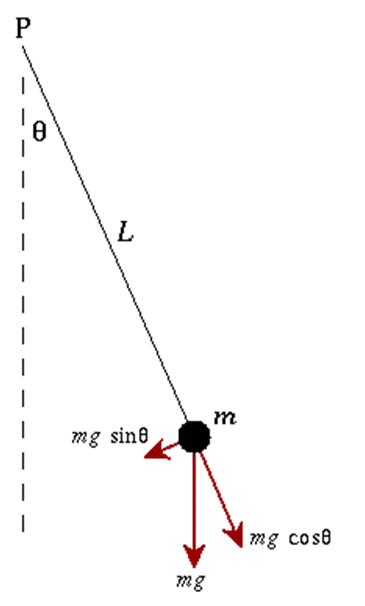
- A simple pendulum consists of a ball (point-mass) m hanging from a (massless) string of length L and fixed at a pivot point P. When displaced to an initial angle and released, the pendulum will swing back and forth with periodic motion.
OBJECTIVE:
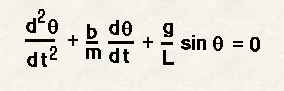
- The main objective is to write a program that solves the second order ODE. This ODE represents the equation of motion of a simple pendulum with damping.
{SECOND ORDER 'ODE' EQUATION}
BODY OF THE CONTENT:
{SOFTWARE USED - MATLAB}
MAIN CODE OF THE PROGRAM:
close all
clear
clc

% Inputs(l,m,g are in the units of meter, kg and m/s^2)
b = 0.05;
g = 9.81;
l = 1;
m = 1;

% Initial conditon of the pendulum at time t=0
theta_0 = [0;3];

% Time span of the pendulum motion is 0-20sec
t_span = linspace(0,20,500);

% Solve ODE
[t,results] = ode45(@(t,theta) ode_func(t, theta, b,g,l,m), t_span, theta_0);

% Plotings
figure(1)
plot(t, results(:,1));
hold on
plot(t, results(:,2));
xlabel('Time');
ylabel('Plot');
legend('Volume', 'Displacement');
axis([0 20 -3 3]);
hold off

ct = 1;
theta = results(:,1);
for i = 1:length(theta)
% result_1 = theta(i);

    x0 = 1;
    y0 = 1;
    x1 = 1-l*sin(theta(i));
    y1 = 1-1*cos(theta(i));

    figure(2)
    plot([0 2],[1 1], 'linewidth',2 , 'color', 'b');
    hold on
    plot([x0 x1],[y0 y1],[x1 x1],[y1 y1],'o','markers',30,'markerfacecolor', 'r');
    hold off
    axis([0 2 -0.5 1.5]);
    title('Pendulum Motion','FontSize',12);
    xlabel('xaxis------>');
    ylabel('yaxis------>');
    pause(0.05);
    M(ct) = getframe(gcf);
    ct= ct +1;
end

movie(M)
videofile = VideoWriter('pendulum_motion.avi', 'Uncompressed AVI')
open(videofile)
writeVideo(videofile,M)
close(videofile)
FUNCTION CODE:
function [dtheta_dt] = ode_func(t,theta,b,g,l,m)

 theta1 = theta(1);
 theta2 = theta(2);
 dtheta1_dt = theta2;
 dtheta2_dt = -(b/m)*theta2 - (g/l)*sin(theta1);
 dtheta_dt = [dtheta1_dt; dtheta2_dt];

end
EXPLANATION OF THE CODE:
- In this code there are two codes are takes place, One is 'Main code' and another one is a 'Function code' that helps to call the functions to the main code.
- close all, clear all, clc are the basic commands of the program.
- close all - Close all figures whose handles are visible.
- clear all - To clear all the variables from the current workspace.
- clc - Clear all the texts from the command window.
- The given values of this program are included as a 'Input variable' (l,m,g,b are in the units of meter, kg and m/s^2)
- Initial conditon of the pendulum at time t=0.
- Time span of the pendulum motion is set as 0-20sec
- Now we have to figure out the array of t and results, with the help of the function code the given variables are placed inside the ODE function code.
- After getting the values the array is an column vector it has 2 colums
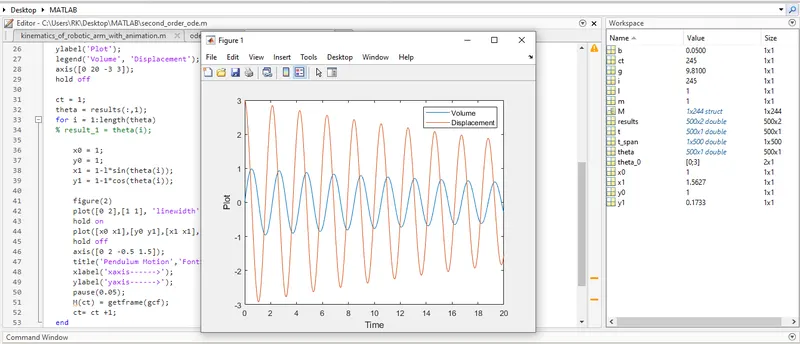
- With this result we will plot out the volume and displacement diagram with respect to time in the figure(1)'
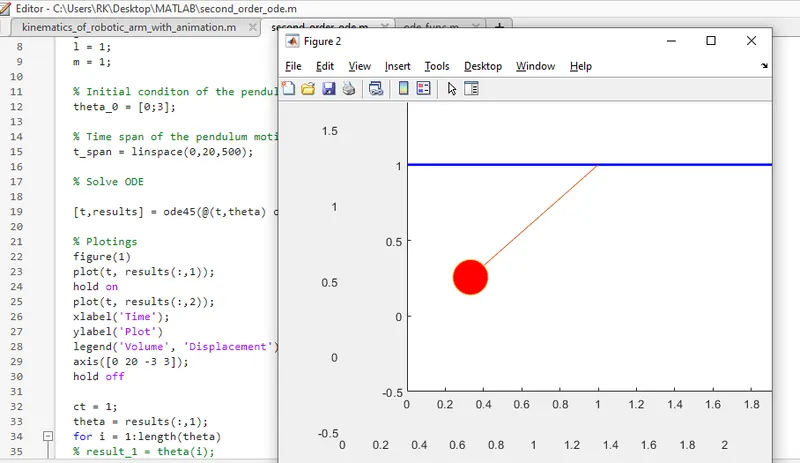
- Then using the for loop condition to create an animation part of the 'PENDULUM MOTION'
- Assign values x0 and y0 as 0. (Fixed at Base)
- Calculate values of x1, x2, y1and y2.
- Plotting Graph using values calculated before and giving axis values to the plot.
- The pause command was used to stop Matlab code temporarily(0.05s), M command was given to capture the frames every time the FOR Loop runs.
- The counter variable is added with +1 increment to help increment the frames every time the FOR Loop runs, Loop end here.
- Within the for loop we plot out the fixed pivot line of the pendulum, followed by the string hold with a mass at the end of it
- After successfully wrote the program we give a tittle.
- Finally the animation part takes place in the figure(2)'
- title - For giving title to the graph
- Linewidth - The line width command is given to the width of the line which is going to be plotted on a graph
- plot - This command is used to Plot Graph
- legend - It is used for indication of the line
- axis - For assigning axis to the plot
- pause - Command stops MATLAB execution temporarily
- movie - Command used to make a movie.
- videofile - main video file stores here.
- close - Close command closes the file in the end.
- .avi - Extension in which the video file gets saved.
OUTPUTS OF THE PROGRAM:
{Animated pendulum simulation YOUTUBE video link}
Error Occured while Programing:

- while writing the plot command i just simply mentiond only the string line i faced this error
- And the only i figured for the proper functioning we need to fix the pivot point and followed by the string line and mass command the program gets exicuted and got the result as i expected.
CONCLUSION:
- As a conclusion of this program i learned a bit more about how the for loop performs to create an animation using Matlab,
- specially in this program it gives a chance to learn how the Pendulum works with respect to volume and displacement using second order ODE function.