Week 3 - Solving second order ODEs
Program to solve the given ODE function of a Simple Pendulum.
ODE Function Program.
function [dtheta_dt] = ode_function(time,theta,b,g,l,m)

theta1 = theta(1);
theta2 = theta(2);
dtheta1_dt = theta2;
dtheta2_dt = -(b/m) * theta2 - (g/l) * sin(theta1);
dtheta_dt = [dtheta1_dt ; dtheta2_dt];

end
ODE main program
clear all
close all
clc

% Input
b = 0.05;   % damping coefficient
g = 9.81;   % gravity in m/s^2
l = 1;      % length of pendulum in meter
m = 1;      % mass of the ball in kg

%Initializing the variable
count = 1;

% Initial condition of displacement and velocity
theta_0 = [0,3];

% time period
time_span = linspace(0,20,500);

% Solve the given ODE
[time,result] = ode45(@(time,theta) ode_function(time,theta,b,g,l,m),time_span,theta_0);

% plotting
figure(1)
plot(time,result(:,1))
hold on
plot (time,result(:,2))

%label
xlabel('Time in seconds')
ylabel('Angular displacement(rad) / Angular velocity (rad/sec)')
title('motion of a simple pendulum with damping')
legend('Angular displacement','Angular velocity')

% Animation
amplitude = result(:,1);    % store the displacement values in amplitude
for i = 1:length(amplitude)
    angle = amplitude(i);
    figure(2)

    % fix the top point of pendulum
    x0 = 0;
    y0 = 0;

    % Other end of pendulum
    x1 = l * sin(angle);
    y1 = -l * cos(angle);

    %plotting
    plot([-1.1 1.1],[0 0],'linewidth',2)    % celling line
    hold on
    plot([x0 x1],[y0 y1],'color','r','linewidth',3)     % pendulum string line
    plot(x1,y1,'o','markers',20,'markeredgecolor',[1 1 0],'markerfacecolor',[1 0 1])
    hold off
    axis ([-1.5 1.5 -1.5 0.5])
    title ('Motion of Simple Pendulum')
    legend('celling line','pendulum string','ball')
    grid on
    pause(0.001)
    M(count) =getframe(gcf);
    count = count + 1;
end

% create a movie
movie(M)
videofile = VideoWriter('simple_pendulum.avi','Uncompressed AVI');
open(videofile)
writeVideo(videofile,M)
close(videofile)
Output:
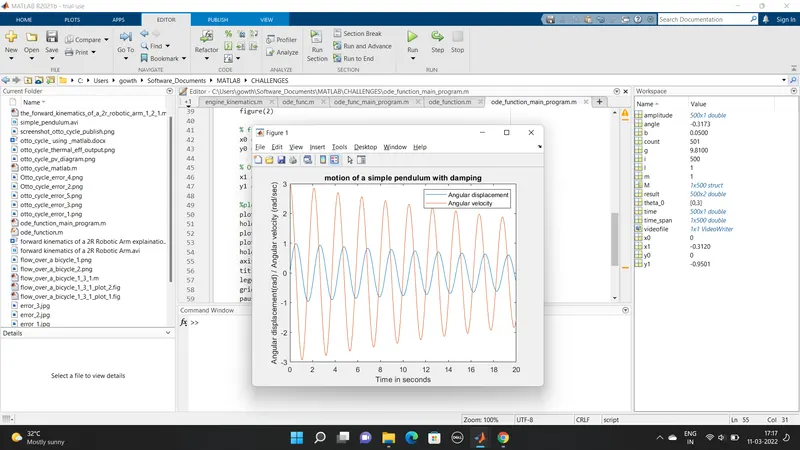
Animation video:
Click here to see my animated video "motion of simple pendulum"
Step wise explanation of ode function code
Line 1 Use function keyword and define the output array name and the function name as “ode_function” and call the inputs
Line 3 & 4 Initialling theta 1 and theta 2.
Line 5 Assume dtheta1_dt is equal to theta2
Line 6 Put the above condition in the given ODE equation and solve it. Finally, we get “dtheta2_dt = -(b/m) * theta2 - (g/l) * sin(theta1)”
Line 7 The values of dtheta1_dt and dtheta2_dt are taken in column vector.
Line 9 Terminate the for loop by using the ‘end’ command.
NOTE: Save the function in the function name.
Step wise explanation of ODE main program code
Line 1 ‘clear all’ It clear all the memory of the temporary variable and clear the workspace.
Line 2 ‘close all’ It closes all the plots.
Line 3 ‘clc’ It clear the command window.
Line 6 to 9 Initializing the value given for damping coefficient (b), gravity (g), length of string (l), mass of the ball (m) respectively.
Line 12 Initializing the variable count.
Line 15 Initial condition of displacement and velocity is stored in the array called “theta_0”.
Line 18 Initializing the time given as 0 to 20 with “linspace” command.
Line 21 Solve the given ODE function by using the “ode45” solver, define the function of ode time & theta after that call the ode function which I already saved in the same folder. The value of ode 45 solver is stored in [time , result]
Line 24 Plot the points in the figure (1)
Line 25 First plot the time vs displacement values stored in the results array in 1st column.
Line 26 Use “hold on” command to hold the figure.
Line 27 Second plot the time vs displacement values stored in the results array in 2nd column.
Line 30 & 31 Using the “xlabel & ylabel” command label the x and y axis in the figure.
Line 32 Using the ‘title” command name the plot figure.
Line 33 Use the “legend” command to show the Angular displacement line and Angular velocity line.
Line 36 Store the displacement values in amplitude.
Line 37 For loop is created for simple pendulum animation. The length of the loop is equal to number of values of the displacement.
Line 38 The swing angle is equal to corresponding amplitude values.
Line 39 Plot the points in the figure (2).
Line 42 & 43 To fix the top point of pendulum initializing the x and y coordinates as (0,0)
Line 46 & 47 To determine the other point of the string of the pendulum the value of x1 and y1 is to find. The length is determined in negative for y1 point because the pendulum will hang in the wall and swing in. Due to gravity the string in the downward direction. So, the y point is in negative.
Line 50 Determine the celling line using “plot” command.
Line 51 Use “hold on” command to hold the figure.
Line 52 Determine the pendulum string line using the “plot” command.
Line 53 Using “markers” command create a circular shape in the end of the string. The points are x1,y1.
Line 54 Use “hold off” command to remove the previous positions.
Line 55 Use the “axis” command to determine the x and y axis.
Line 56 Using the ‘title” command name the plot figure.
Line 57 Use the “legend” command to show the celling line, pendulum string & ball.
Line 58 Use the “grid on” command to show the grid lines
Line 59 To slow down the speed of the pendulum motion “pause” command is used.
Line 60 Assign a new array called ‘M’. To record the data of each frame by getting data from each plot using “getframe(gcf)” command. Here “gcf” means Get the Current Figure.
Line 61 Incrementing the count variable to get each plot data.
Line 62 Terminate the for loop by using the ‘end’ command.
Line 65 To play the recorded movie using the ‘movie’ command. Already the array M stored the data of each frame.
Line 66 To save the movie, create a video file and give the filename and the specific the file format.
Line 67 Open the created video file.
Line 68 Write the video data to the file stored in M.
Line 69 Close the video file.
Mention the errors faced while programming and Steps taken to overcome those errors.
Error 1 :
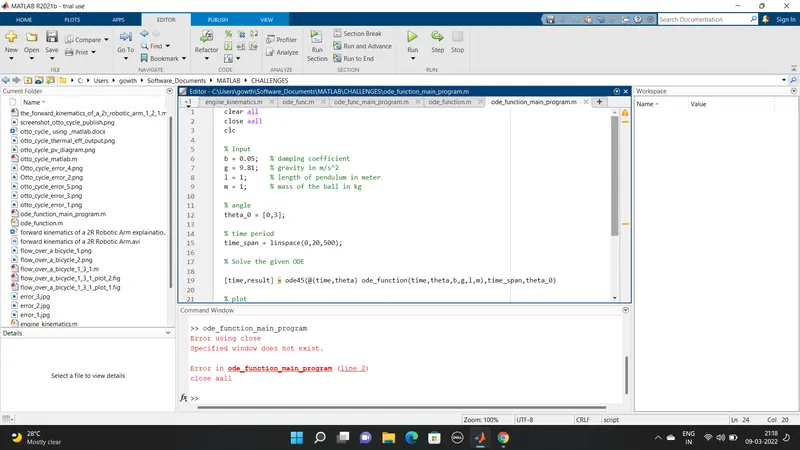
Solution 1: The "close all" command spelling wrong after that I corrected my mistake.
Error 2:
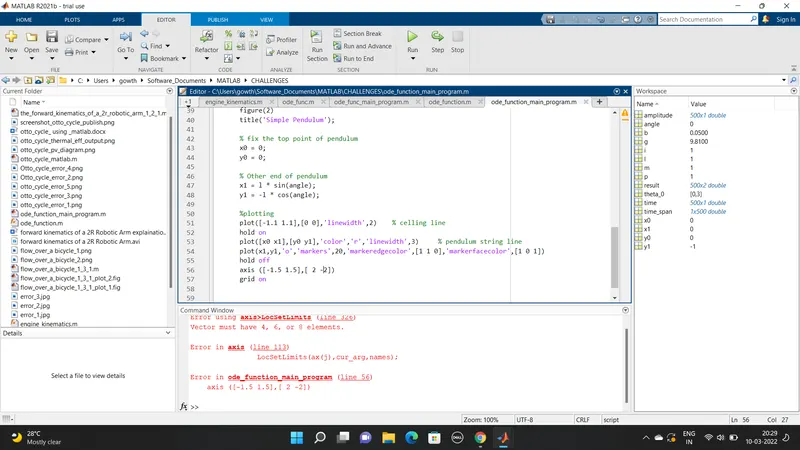
Solution 2: The axis syntax is wrong after that I corrected my mistake. the syntax is "axis([xmin xmax ymin ymax]).
Error 3:
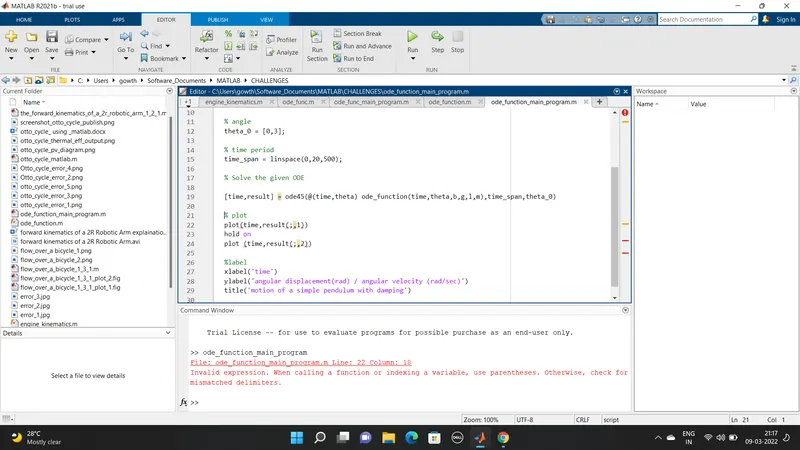
Solution 3 : I made a mistake in sub matrix format. After the error shown i corrected it "result(:,1)"