Week 3 - Solving second order ODEs
Solving second order ODEs to created SIMPLE PENDULAM.
LINK 1 ODE FUNCTION
https://drive.google.com/file/d/1X1_GPUbeubVhqqYX4byP4-LEvP8tj9ng/view?usp=sharing
LINK 2 SECOND ORDER ODE FINAL PROGRAM
https://drive.google.com/file/d/1FkgCNnAw-yAfWIi7-DhoEKa3xo4xTe1l/view?usp=sharing
LINK 3 AVI FILE VIDEO
https://drive.google.com/file/d/1L1sG1Bz7bTqBbCJU5T8jdD_ipeQPkYmF/view?usp=sharing
LINK 3 YOUTUBE LINK
EXPLANATION OF FUNCTION
%CREATING FUNCTION FOR FINAL ODE SIMPLE PENDULAM

function [dtheta_dt] = FUNC_ODE_FINAL(t,theta,b,g,l,m)

theta1 = theta(1);
theta2 = theta(2);
dtheta1_dt = theta2;
dtheta2_dt = -(b/m)*theta2 - (g/l)*sin(theta1);
dtheta_dt = [dtheta1_dt; dtheta2_dt];
end
[dtheta_dt] is output varable of function.
FUNC_ODE_FINAL(t,theta,b,g,l,m) is input varibale of function.
First element is "ANGULAR VELOCITY" it is nothing but theta1 = theta(1) ;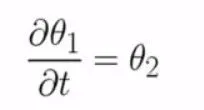 . it is 1st ODE
theta2 = theta(2);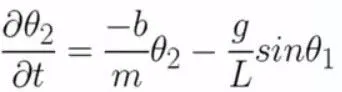 . it is 2nd ODE
at the end of this program we combine this entire formula dtheta_dt = [dtheta1_dt; dtheta2_dt] put ';' semicolan it will shows it's column matrix.
the above function it will helps to solve ODE [t,results] t = integration time and results
results will be column vector shows that we are solving 2ODE
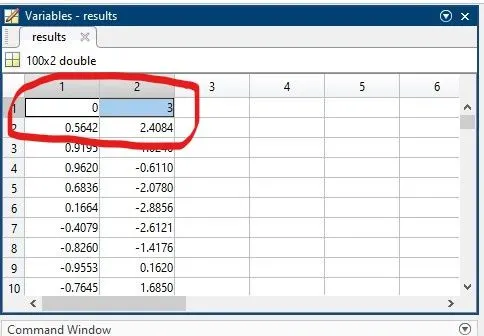 1st column shows 'DISPLACEMENT' & 2nd column shows 'VELOCITY'.
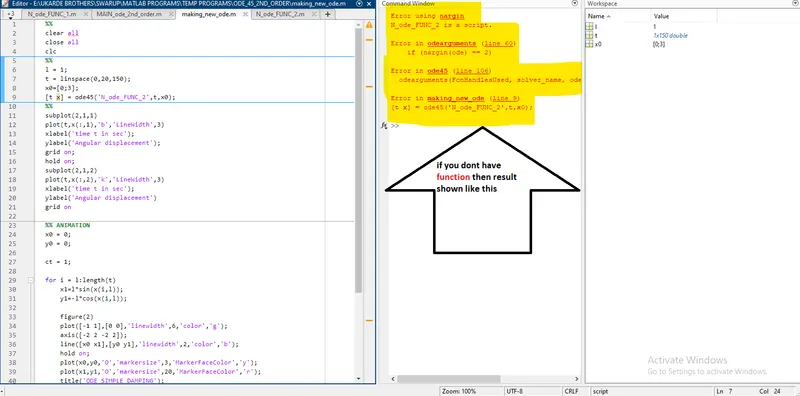
ERROR FOR RUNNING WHOLE PROGRAM WITHOUT ADDITNG FUCNTION
EXPLANTION OF SECOND ORDER ODE FINAL PROGRAM IN 4 PARTS
1st PART
clear all
close all
clc

%Inputs
b=0.05;
g=9.81;
l=1;
m=1;

%Initial condition
theta_0=[0;3];

%Time points
t_span=linspace(0,20,100);

%Solve ODE
[t,results]= ode45(@(t,theta)FUNC_ODE_FINAL(t,theta,b,g,l,m),t_span,theta_0);
i put all input variable wich was required for solving program wich was shown above file
INITIAL CONDITON for displacement is "0"
INITAL CONDITION for velocity is 3m/sec 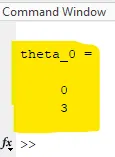
then we going to integrating ODE SYSTEM to obtain solution which will hepls to define value of time to travel pendulam.
t_span is TIME ARRAY which was 0 to 20seconds having 100 values in between
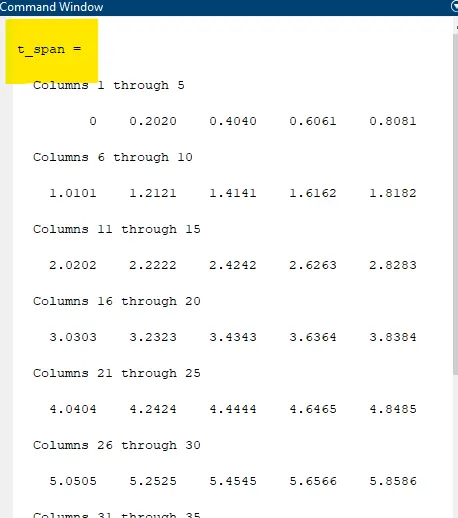
solve ODE = CALLING ODE FUNCTION
%Solve ODE
[t,results]= ode45(@(t,theta)FUNC_ODE_FINAL(t,theta,b,g,l,m),t_span,theta_0);
ode45 it is inbult solver in MATLAB "ode45(@(t,theta)" is says that our main input. theta and t is dependent and independent variables of ODE system.
it is says that ODE is FUNCTION of '(t,theta)' it will hepls to defining the function 'FUNC_ODE_FINAL(t,theta,b,g,l,m)'.
FUNC_ODE_FINAL - it is nothing but our ODE FUNCTION DEFINATION.
Function name and file name it needs to match. if it will save in diffrent name then we get error.
"t_span,theta_0" is input parameters which will helps to start our system.
2nd PART- Ploting
%plot for Angular displacement
figure(1)plot(t,results(:,1),'c','linewidth',3)xlabel('Time')ylabel('Angular displacement')grid on
following curve represnts DISPLACEMENT
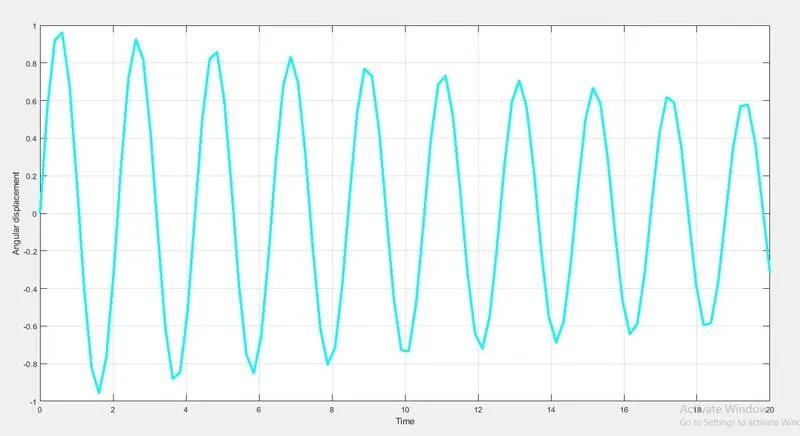
%plots for Angular velocityfigure(2)plot(t,results(:,2),'r','linewidth',3)xlabel('Time')ylabel('Anglar velocity')grid on
following curve represnts VELOCITY
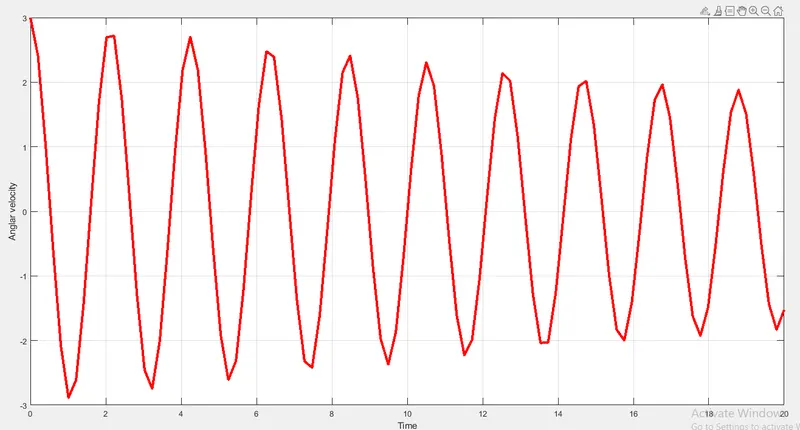
%Merge plot for Angular displacement and Anglar velocityfigure(3)plot(t,results(:,1),'c','linewidth',3)hold onplot(t,results(:,2),'r','linewidth',3)xlabel('Time')ylabel('Plot')grid on
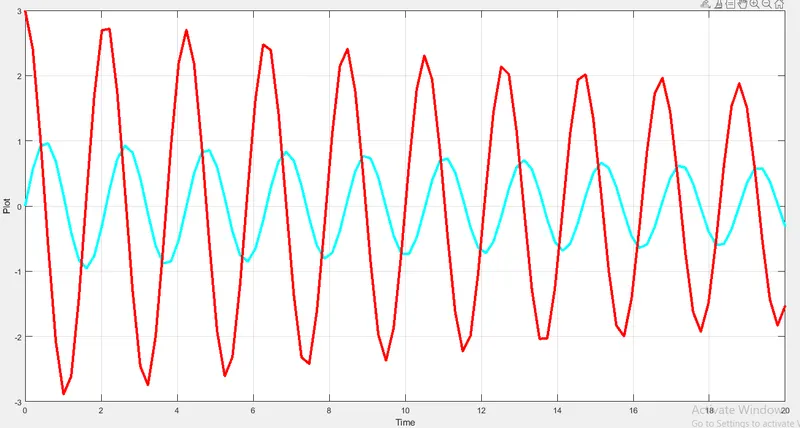
HOLD ON command = Retain current plot when adding new plot ON = option.
GRID on command = display or hide axes grid lines.
3rd PART - ANIMATION
%ANIMATION
ct = 1;

for i = l:length(t)

    %Co-ordinates
    x0 = 0;
    y0 = 0;
    x1=l*sin(results(i,l));
    y1=-l*cos(results(i,l));

    figure(4)
    plot([-1 1],[0 0],'linewidth',20,'color','k');
    axis([-1.5 1.5 -1.5 1.5]);
    line([x0 x1],[y0 y1],'linewidth',5,'color','c');
    hold on
    plot(x0,y0,'O','markersize',6,'MarkerFaceColor','y');
    plot(x1,y1,'O','markersize',25,'MarkerFaceColor','r');
    title('ODE SIMPLE DAMPING');
    legend('SUPPORT ROD','LENGTH OF PENDULUM','FIXED POINT','BOD OF PENDULUM');
    grid on;
    hold off
    M(ct) = getframe(gcf);
    ct= ct+1;
end
ct = counter command it represents each and every frame.
forloop = it is set of commands that repeats itself for a specified number of time. i = variable
it hepls to repeat the value of length(t)
    %Co-ordinates
    x0 = 0;
    y0 = 0;
    x1=l*sin(results(i,l));
    y1=-l*cos(results(i,l));
in this case using the values in RADIANS. thats whys didnt put x1=l*sin(results(i,l));
for i = l:length(t)

    %Co-ordinates
    x0 = 0;
    y0 = 0;
    x1=l*sin(results(i,l));
    y1=-l*cos(results(i,l));

    figure(4)
    plot([-1 1],[0 0],'linewidth',20,'color','k');
    axis([-1.5 1.5 -1.5 1.5]);
    line([x0 x1],[y0 y1],'linewidth',5,'color','c');
    hold on
    plot(x0,y0,'O','markersize',6,'MarkerFaceColor','y');
    plot(x1,y1,'O','markersize',25,'MarkerFaceColor','r');
    title('ODE SIMPLE DAMPING');
    legend('SUPPORT ROD','LENGTH OF PENDULUM STRING','FIXED POINT','BOD OF PENDULUM');
    grid on;
    hold off
    M(ct) = getframe(gcf);
    ct= ct+1;
end
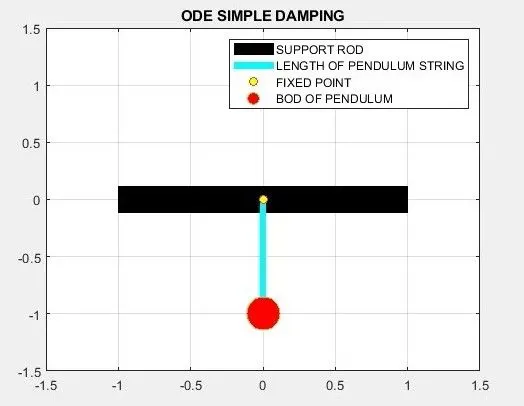
plot command for adding 'SUPPORT ROD' is = plot([-1 1],[0 0],'linewidth',20,'color','k');
ERROR
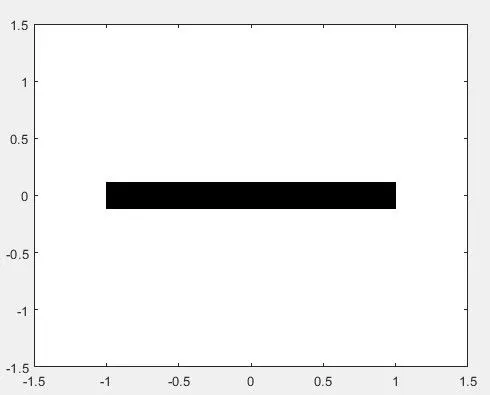
Axis is helps to xlimts changes -1.5 to 1.5 and ylimt changes from -1.5 to 1.5 ([-1.5 1.5 -1.5 1.5]);
when miss adding axes command then get ERROR like this
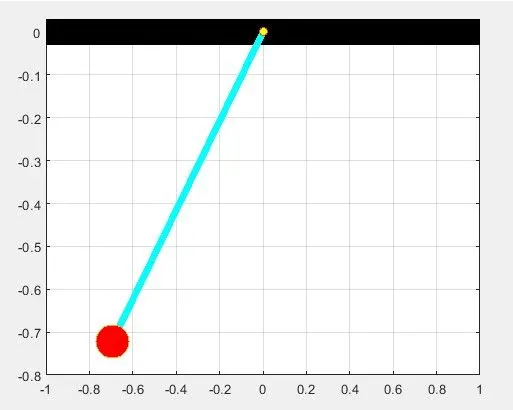
line command for adding 'LENGTH OF PENDULUM STRING' code = line([x0 x1],[y0 y1],'linewidth',5,'color','c');
plot command for adding 'FIXED POINT' code = plot(x0,y0,'O','markersize',6,'MarkerFaceColor','y');
plot command for adding 'BOD OF PENDULUM' code = plot(x1,y1,'O','markersize',25,'MarkerFaceColor','r');
'O' = Marker style code. all the coordinates will be marked by a circle
'markersize' = this command is reprersent Yellow dot size is 0.6mm and Red dot size is 0.25mm wich name 'FIXED POINT' and 'BOD OF PENDULUM'
adding title command for adding line to final program
adding legend command to axes it represent all plot and line command names and symbols colors in one box.
when i miss the HOLD OFF command then i get ERROR like this
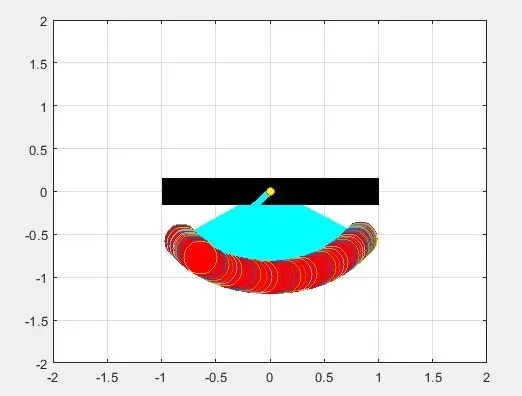 = Retain current plot when adding HOLD OFF.
final sucessfully run image of SIMPLE PENDULAM
4th PART - CODE to Creating movie
 M(ct) = getframe(gcf);
    ct= ct+1;
end

movie(M)
videofile = VideoWriter('ODE_FINAL.avi','Uncompressed AVI');
open(videofile)
writeVideo(videofile,M)
close(videofile)
M = save in array. and ct represent each and every frame.
getframe(gcf) = g= get; c = current; f=figure;.get individual films;
wich will be getting from plots we are getting 4four figure but we need to animate figure no 4 then we get figure 4 as animation. and it will save as array is called M
movie(M) = MATLAB is going to genrate movie. using with all above frame.
videofile = VideoWriter('ODE_FINAL.avi','Uncompressed AVI'); it is that file wich saving the above frame in avi format to play as video by using VideoWriter this command hepls to store and control ARRAY AND ITS COMMAND to creat and run video file in avi format.
'ODE_FINAL.avi' is our filename.
'Uncompressed AVI' is our profile.
writeVideo(videofile,M) = it helps to Open the video file for writing. Then, write the image data in 'M' to the file.
close = closes the current figure. Calling close is equivalent to calling close(videofile).
FINAL SUCESSFUL FUNCTION CODE
%CREATING FUNCTION FOR FINAL ODE SIMPLE PENDULAM

function [dtheta_dt] = FUNC_ODE_FINAL(t,theta,b,g,l,m)

theta1 = theta(1);
    theta2 = theta(2);
dtheta1_dt = theta2;
dtheta2_dt = -(b/m)*theta2 - (g/l)*sin(theta1);
dtheta_dt = [dtheta1_dt; dtheta2_dt];
end
FINAL SUCESSFUL PROGRAM FOR SIMPLE PENFULAM.
clear all
close all
clc

%Inputs
b=0.05;
g=9.81;
l=1;
m=1;

%Initial condition
theta_0=[0;3];

%Time points
t_span=linspace(0,20,100);

%Solve ODE
[t,results]= ode45(@(t,theta)FUNC_ODE_FINAL(t,theta,b,g,l,m),t_span,theta_0);

%plots for Angular displacement
figure(1)
plot(t,results(:,1),'c','linewidth',3)
xlabel('Time')
ylabel('Angular displacement')
grid on
%plots for Angular velocity
figure(2)
plot(t,results(:,2),'r','linewidth',3)
xlabel('Time')
ylabel('Anglar velocity')
grid on

%Combine plot for Angular displacement and Anglar velocity
figure(3)
plot(t,results(:,1),'c','linewidth',3)
hold on
plot(t,results(:,2),'r','linewidth',3)
xlabel('Time')
ylabel('Plot')
grid on

%ANIMATION
ct = 1;

for i = l:length(t)

    %Co-ordinates
    x0 = 0;
    y0 = 0;
    x1=l*sin(results(i,l));
    y1=-l*cos(results(i,l));

    figure(4)
    plot([-1 1],[0 0],'linewidth',20,'color','k');
    axis([-1.5 1.5 -1.5 1.5]);
    line([x0 x1],[y0 y1],'linewidth',5,'color','c');
    hold on
    plot(x0,y0,'o','markersize',6,'MarkerFaceColor','y');
    plot(x1,y1,'o','markersize',25,'MarkerFaceColor','r');
    title('ODE SIMPLE DAMPING');
    legend('SUPPORT ROD','LENGTH OF PENDULUM STRING','FIXED POINT','BOD OF PENDULUM');
    grid on;
    hold off
    M(ct) = getframe(gcf);
    ct= ct+1;
end

    movie(M)
videofile = VideoWriter('ODE_FINAL.avi','Uncompressed AVI');
open(videofile)
writeVideo(videofile,M)
close(videofile)
FINAL PROGRAM IMAGE