Project 1 - Parsing NASA thermodynamic data
Project 1 - Parsing NASA thermodynamic data
Write a code in MATLAB to parse the NASA thermodynamic data file and then calculate thermodynamic properties of various gas species.
OBJECTIVE :
- Write a function that extracts the 14 co-efficients and calculates the enthalpy, entropy and specific heats for all the species in the data file.
- Calculate the molecular weight of each species and display it in the command window.
- Plot the Cp, Enthalpy and Entropy for the local temperature range (low temperature : high temperature) specific for each species.
- Save the plots as images with appropriate names and dump them in separate folders for each species with suitable name. all these should be generated automatically.
- The main program that you will submit will just take the "THERMO.dat" file as an input and generate Cp, H and S plots.
- Screenshot of the window where all the folders are saved.
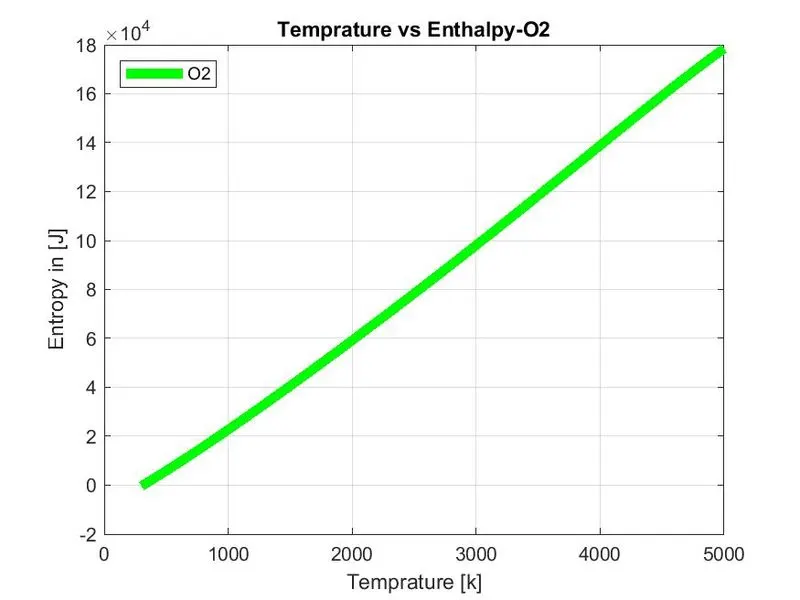
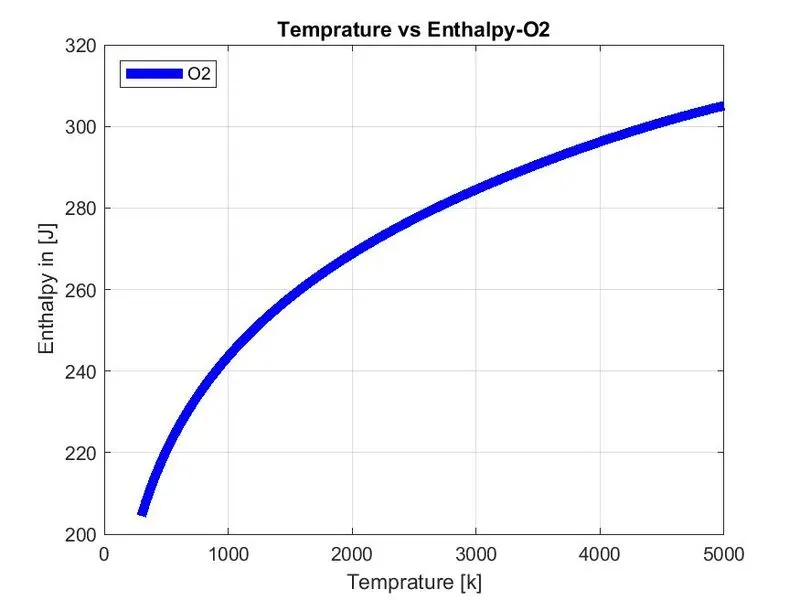
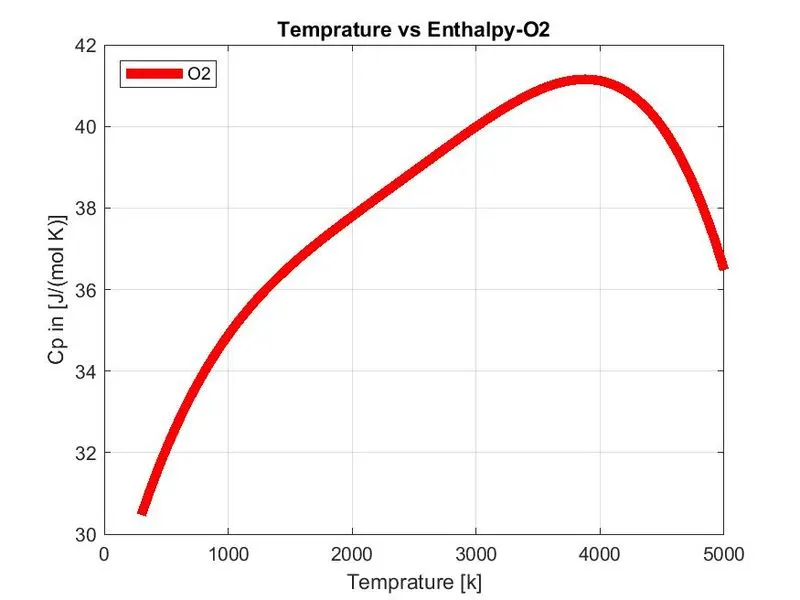
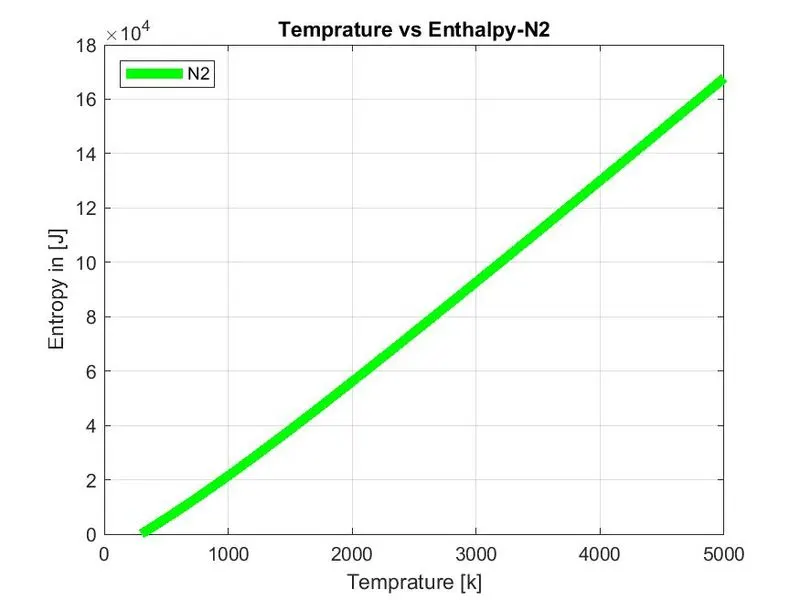
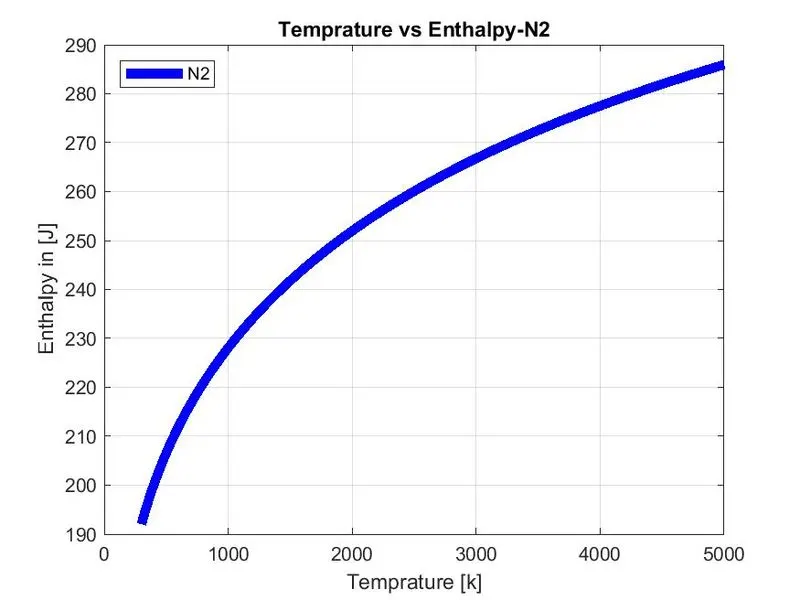
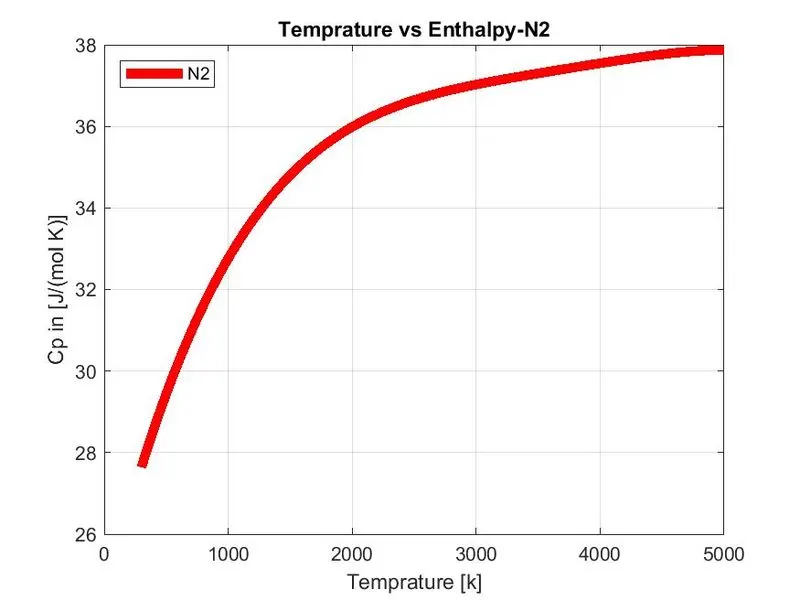
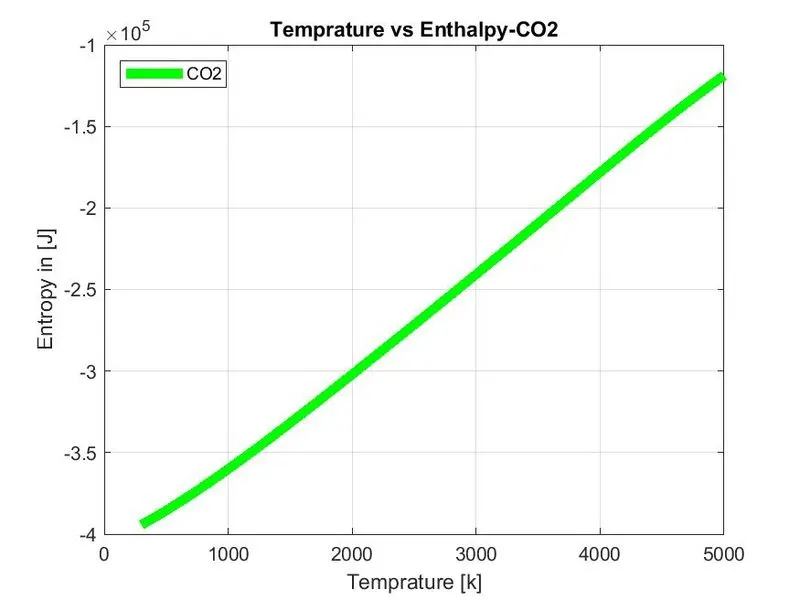
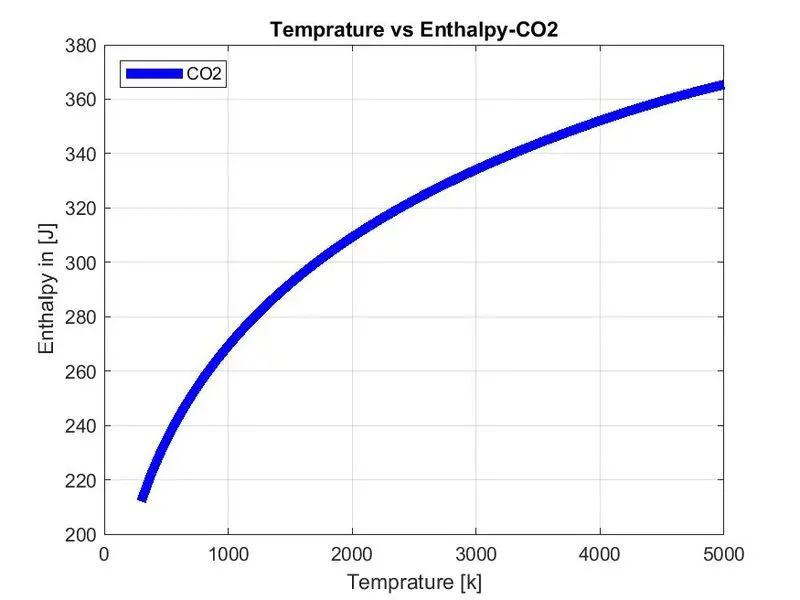
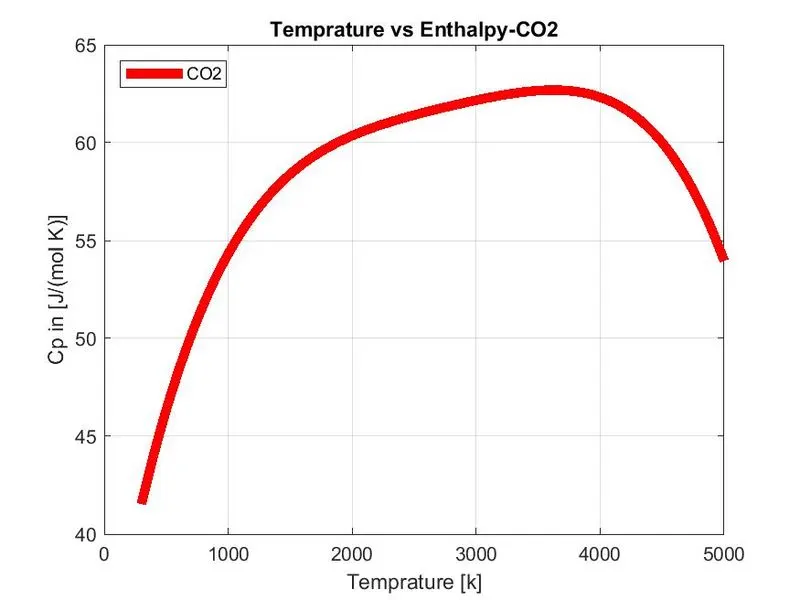
- PLots for o2, N2 and Co2 species.
NASA came up with polynomials that can be used to evaluate thermodynamic properties such as
Cp = Specific heat , H = Enthalpy and S = Entropy.
They have also documented the co-efficients that are required to evaluate these polynomials for 1000+ species.
What is file parsing ?
a file parsing means reading in a data stream of some sort and building an in memory model of the semantic content of that data. This aims at facilitating perfoming some kind of transformation on the data.
Project 1 - Parsing NASA thermodynamic data
using following formula to reading the NASA thermodynamic data. which is use to create function helps to solve.
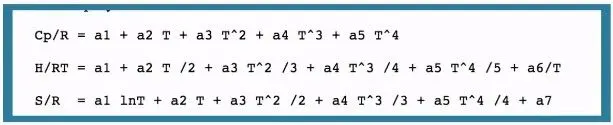
R = Universal gas constant,
T = Temprature,
- Specific heat (Cp) :- It is defind as the amount of heat required to raise the tempraure of 1kg of substance by 1degree of temprature.
Cp/R = a1 + a2 T +a3 T^2 + a4 T^3 + a5 T^4
- Enthalpy (H) :- A property of a thermodynamic system, is equal to the system's internal energy plus the product of its pressure and volume. In a system contained so as to prevent mass transfer, for processes at constant pressure, the heat absorbed or released equals the change in enthalpy.
H/RT = a1 + a2 T /2 + a3 T^2 /3 + a4 T^3 /4 + a5 T^4 /5 + a6/T
- Entropy (S) :- The thermodynamic properties which were defined in terms of the statistics of the molecular motions of a system. Entropy is a measure of the molecular disorder.
S/R = a1 lnT +2 T + a3 T^2 /2 a4 T^3 /3 + a5 T^4 /4 a7
EXPLANATION OF CODES & COMMANDS [click on every command to go refrence]: -
STEP 1 :-
f1 = fopen('THERMO.dat','r')
get = fgetl(f1);
% Reading temperature from this file
temp = fgetl(f1);

tic
%spliting temprature
s = strsplit(temp);

% converting strings cells into numbers &skipping next three lines
for i= 1:3
get=fgetl(f1);
end
Our INPUT parameter is saved as name of THERMO.dat file.
fopen = Open file, or obtain information about open files. hepls to open THERMO.dat file and 'r' Read.
| Open file for reading. |
fgetl(f1) = fgetl reads characters using the encoding scheme associated with the file. it helps to read the THERMO.dat file.
tic toc = tic works with the toc function to measure elapsed time. command to know the how much time will taken by program to run
temp = fgetl(f1) it read the temprature data inside of this file then,
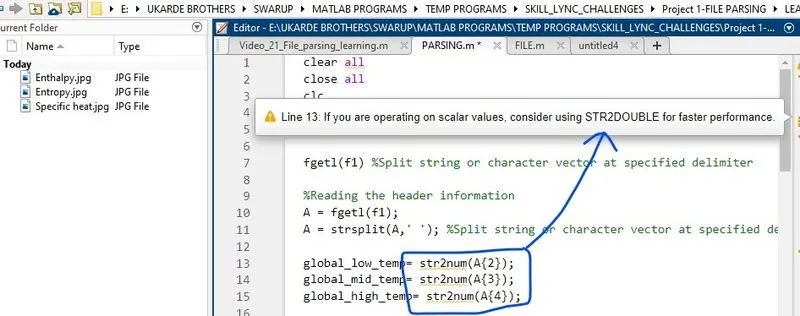
strsplit(temp) = Split string or character vector at specified delimiter. spliting the temprature and it will convert in to cell array. then it will convert this string to number using str2num to find low,mideum and high temprature.
! GRI-Mech Version 3.0 Thermodynamics released 7/30/99
! NASA Polynomial format for CHEMKIN-II
! see README file for disclaimer
forloop = executes a group of statements in a loop for a specified number of times. for skipping next three lines wich was inside of THERMO.dat file.
STEP 2:-
now using forloop to find 53 elements in the data file by assigning fgetl(f1) and then splitting into cell array to find and Read the species line, species name, and species number of temprature.
cell array = A cell array is a data type with indexed data containers called cells, where each cell can contain any type of data. Cell arrays commonly contain either lists of text, combinations of text and numbers, or numeric arrays of different sizes. Refer to sets of cells by enclosing indices in smooth parentheses, (). Access the contents of cells by indexing with curly braces, {}.
for j= 1:53 %finding 53 elements inside 'THERMO.dat' file

tline=fgetl(f1);

A=strsplit(tline,' '); %finding and reading spliting species line
species = (A{1});   %finding and reading species number

%converting string to number (l1-lowtemp,l2-midtemp,l3-hightemp)
l1 = str2num(A{end-3});
l2 = str2num(A{end-2});
l3 = str2num(A{end-1});

tline1 = fgetl(f1);            %getting next line
a = strfind(tline1,'E');      %Finding the string E
str2num = convert character array or string to numeric array. converting 'species' string to number using str2num to find low,mideum and high temprature.
In order to read the coefficient in the data file we will first find the 'E' string using
(A{1}) = Access the contents of cells by indexing with curly braces, {}.
STEP 3 :-
as per requested The FIRST 7 coefficients are HIGH-temperature coefficients and the SECOND 7 coefficients are LOW-temperature coefficients.
% Finding First 7 higher and second 7 lower coefficients
%Finding Higher coefficients
a1 = tline1(1:a(1)+3);
a1 = str2num(a1);
a2 = tline1(a(1)+4:a(2)+3);
a2 = str2num(a2);
a3 = tline1(a(2)+4:a(3)+3);
a3 = str2num(a3);
a4 = tline1(a(3)+4:a(4)+3);
a4 = str2num(a4);
a5 = tline1(a(4)+4:a(5)+3);
a5 = str2num(a5);

tline2 = fgetl(f1);
b = strfind(tline2,'E');
a6 = tline2(1:b(1)+3);
a6 = str2num(a6);
a7 = tline2(b(1)+4:b(2)+3);
a7 = str2num(a7);
%%
%Finding Lower coefficients
a8 = tline2(b(2)+4:b(3)+3);
a8 = str2num(a8);
a9 = tline2(b(3)+4:b(4)+3);
a9 = str2num(a9);
a10 = tline2(b(4)+4:b(5)+3);
a10 = str2num(a10);

tline3 = fgetl(f1);
c = strfind(tline3,'E');
a11 = tline3(1:c(1)+3);
a11 = str2num(a11);
a12 = tline3(c(1)+4:c(2)+3);
a12 = str2num(a12);
a13 = tline3(c(2)+4:c(3)+3);
a13 = str2num(a13);
a14 = tline3(c(3)+4:c(4)+3);
a14 = str2num(a14);
converting 'species' string to number using str2num to find temperature coefficients.
strfind = Find strings within other strings. command to find before and after numbers of the coefficients. then find remaining 14 coefficients and convert them to numbers from strings.
using these 14 coefficients for lower and higher temperature. then we will specify SPECIFIC HEAT, ENTROPY,ENTHALPY and MOLECULAR WEIGHT function and hepls to find molecular weight of the different species.
STEP 4 :-
To calculate SPECIFIC HEAT, ENTROPY,ENTHALPY (M=MEDUIM TEMP)
%EXTRACTING GLOBAL TEMPRATURE (L=LOW TEMP ,M=MEDUIM TEMP ,H=HIGH TEMP)
L = str2num(s{2});
M = str2num(s{3});
H = str2num(s{4});

T = linspace(L,H,1000); %Temprature range
R=8.314 ; % Universal gas constant
using linspace =command to assign temperature range and converting 'species' string to number using str2num to find temperature.
%To calculate SPECIFIC HEAT
Cp = Specific_heat(a1,a2,a3,a4,a5,a8,a9,a10,a11,a12,T,R,M);

% calculate ENTROPY
S = Entropy(a1,a2,a3,a4,a5,a7,a8,a9,a10,a11,a12,a14,T,R,M);

% calculate ENTHALPY
H = Enthalpy(a1,a2,a3,a4,a5,a6,a8,a9,a10,a11,a12,a13,T,R,M);
using these 14 coefficients for lower and higher temperature. then we will specify molecular weight W function to find the molecular weight of the different species.
STEP :5
%plotting cp, H and S with Temperature & saving in a folder
%Creating folder
mkdir(['E:\UKARDE BROTHERS\SWARUP\MATLAB PROGRAMS\PROJECT 1\NASA\',species]);

%plotting the graphs [Temprature vs Cp]
figure(1)
plot(T,Cp,'LineWidth',5,'color','r')
title(strcat('Temprature vs Enthalpy','-',species))
legend(species,Location="northwest")
xlabel('Temprature [k]')
ylabel('Cp in [J/(mol K)]');
grid on
saveas(1,'Cp','jpg');  %save figure to specific file format.

%plotting the graphs [Temprature vs Enthalpy]
figure(2)
plot(T,S,'LineWidth',5,'color','b')
title(strcat('Temprature vs Enthalpy','-',species))
legend(species,Location="northwest")
xlabel('Temprature [k]')
ylabel('Enthalpy in [J]');
grid on
saveas(2,'Entropy','jpg');

%plotting the graphs [Temprature vs Entropy]
figure(3)
plot(T,H,'LineWidth',5,'color','g')
title(strcat('Temprature vs Enthalpy','-',species))
legend(species,Location="northwest")
xlabel('Temprature [k]')
ylabel('Entropy in [J]');
grid on
saveas(3,'Enthalpy','jpg');

%Using the full path, change the current folder from E:\
saving = (['E:\UKARDE BROTHERS\SWARUP\MATLAB PROGRAMS\PROJECT 1\NASA\',species]);
cd(saving)            %Changing current folder.
mkdir :Creating folder To write to a remote location.
saveas : save figure to specific file format im using jpg format to save the figure.
cd : cd displays the current folder.
STEP : 6
% Calculate Molecular weight of the Species
W = Molecular_weight(species)

% writing molecular weight file
MW_file = fopen('Molecular weight.txt','w');

fprintf(MW_file,'Molecular weight of %s is %d ',species,W);
fclose(MW_file); %Closeing the file
toc
end
calculating molecular weight by using molecular weight function.writing molecular weight.txt file wich was aloso save in cd for each species
fprintf = Write data to text file.
fclose = Close one or all open files.
%s in the formatSpec input indicates that the values of the variables url and sitename, should be printed as text.
format specifire = ( applies the fileID,formatSpec,A1,...,An)formatSpec to all elements of arrays A1,...An in column order, and writes the data to a text file.
FUNCTIONS : -
SPECIFIC HEAT
%SPECIFIC HEAT = Cp
function Cp = Specific_heat(a1,a2,a3,a4,a5,a8,a9,a10,a11,a12,T,R,M)

% Calculating specific heat.
% Calculating specific heat for higher and lower temperature respectively.

if (T <= M)
    Cp = R*(a8 + (a9*T) + (a10*(T).^2) + (a11*(T).^3) + (a12*(T).^4));
else
    Cp = R*(a1 + (a2*T) + (a3*(T).^2) + (a4*(T).^3) + (a5*(T).^4));
end
end
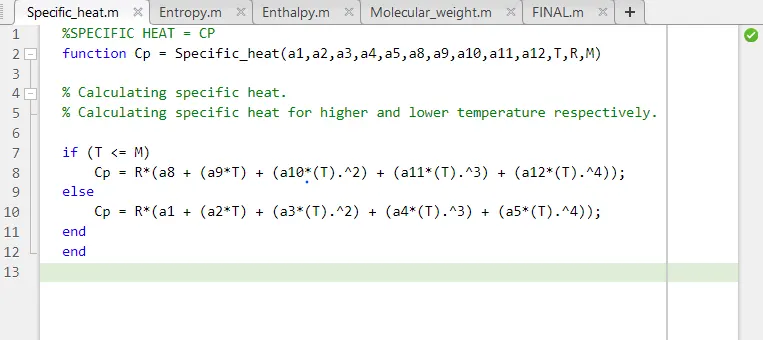
Creating specific heat function by using above formula and it containts 14coefficient,Temprature,medium temprature,Universal gas constant.
using if loop and to make the temperature less than and equal to mid temperature to specify lower temperature coefficent in the formula.
ENTROPY
%Entropy = S
function S = Entropy(a1,a2,a3,a4,a5,a7,a8,a9,a10,a11,a12,a14,T,R,M)

% Calculating Entropy.
% Calculating Entropy for higher and lower temperature respectively.

if (T <= M)
S = R*(a8.*log(T) + (a9*T) + ((a10*(T).^2)/2) + ((a11*(T).^3)/3) + ((a12*(T).^4)/4) + a14);
else
    S = R*(a1.*log(T) + (a2*T) + ((a3*(T).^2)/2) + ((a4*(T).^3)/3) + ((a5*(T).^4)/4) + a7);
end
end
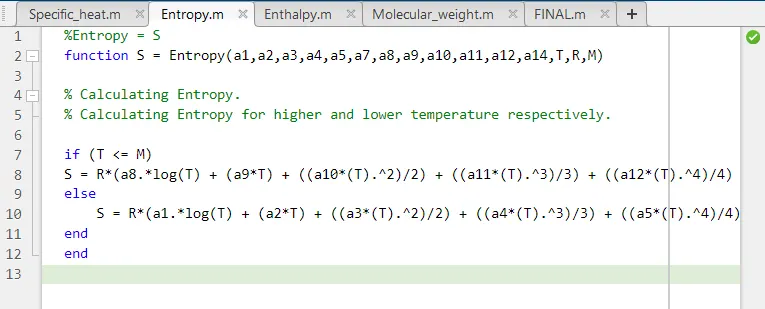
Creating Entropy function by using above formula and it containts 14coefficient,Temprature,medium temprature,Universal gas constant.
using if loop and to make the temperature less than and equal to mid temperature to specify lower temperature coefficent in the formula.
ENTHALPY
%ENTHALPY - H
function [H] = Enthalpy(a1,a2,a3,a4,a5,a6,a8,a9,a10,a11,a12,a13,T,R,M)

% Calculating Enthalpy.
% Calculating Enthalpy for higher and lower temperature respectively.

if (T <= M)
    H = R*T.*(a8 + ((a9*T)/2) + ((a10*(T).^2)/3) + ((a11*(T).^3)/4) + ((a12*(T).^4)/5) + ((a13./T)));
else
    H = R*T.*(a1 + ((a2*T)/2) + ((a3*(T).^2)/3) + ((a4*(T).^3)/4) + ((a5*(T).^4)/5) + ((a6./T)));
end
end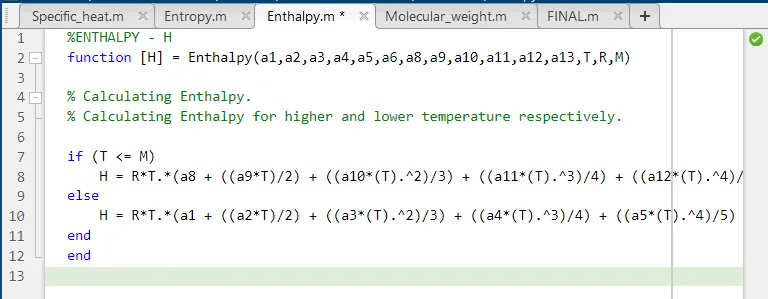
Creating Entropy function by using above formula and it containts 14coefficient,Temprature,medium temprature,Universal gas constant.
using if loop and to make the temperature less than and equal to mid temperature to specify lower temperature coefficent in the formula.
MOLECULAR WEIGHT
%Molecular_weight
function W = Molecular_weight(species)

atomic_name = ['H','C','O','N','A'];
atomic_weight = [1.008 12.011 15.999 14.007 39.948];
W=0;

for i=1:length(species)
    for j=1:length(atomic_name)
        if strcmp(species(i), atomic_name(j))
            W = W + atomic_weight(j);
            position = j;
        end
    end
    n = str2num(species);
    if n>1
        W = W + atomic_weight(position)*(n-1);
    end
end

fprintf('Molecular weight of %s :- ',species);
fprintf('%f',W);
disp(' ')
end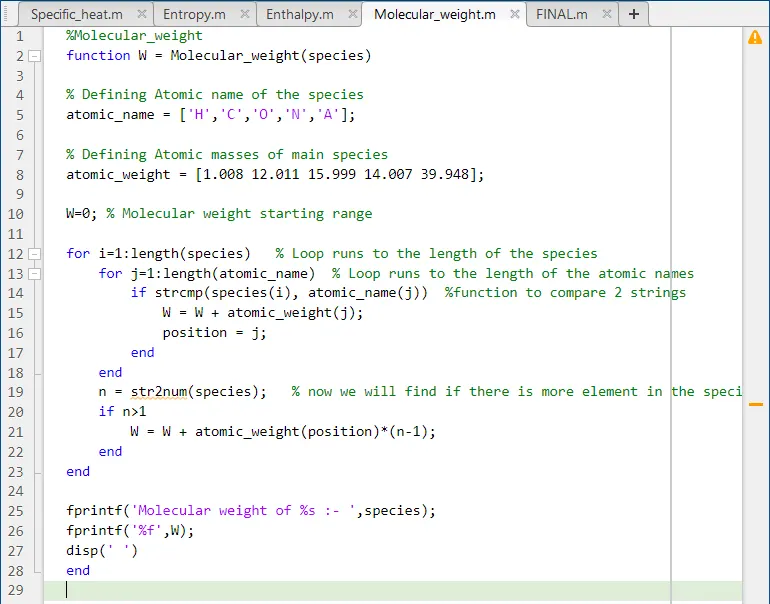
Creating Molecular_weight function = W and assigning species input values.
In this function Defining Atomic name of the species = ['H','C','O','N','A'];
Defining Atomic weight of main species = [1.008 12.011 15.999 14.007 39.948];
Molecular weight starting range = W=0;
strcmp = Use strcmp to compare character vectors.
if = Execute statements if condition is true.find the molecular mass for each and every element atomic weight is assigned using the 'strcmp' command each species elements are compared and molecular mass is stored.
disp = Display value of variable.
FINAL PROGRAM
%FINAL
clear all
close all
clc

%INPUT
% Reading data file
f1 = fopen('THERMO.dat','r') % open file and reading THERMO.dat file
get = fgetl(f1);

tic
% Reading temperature from this file
temp = fgetl(f1);
%spliting
s = strsplit(temp);

% converting strings cells into numbers
%skipping next three lines
for i= 1:3
    get=fgetl(f1);
end

%%
%Reading the species
for j= 1:53
    tline=fgetl(f1);

    A=strsplit(tline,' '); %spliting into cell array
    species = (A{1});  %to read name of species

% converting string to number (l1-lowtemp,l2-midtemp,l3-hightemp)
l1 = str2num(A{end-3});
l2 = str2num(A{end-2});
l3 = str2num(A{end-1});

tline1 = fgetl(f1); %getting next line
a = strfind(tline1,'E');  %Finding the string E

%%
% Finding First 7 higher and second 7 lower coefficients
%Finding Higher coefficients
a1 = tline1(1:a(1)+3);
a1 = str2num(a1);
a2 = tline1(a(1)+4:a(2)+3);
a2 = str2num(a2);
a3 = tline1(a(2)+4:a(3)+3);
a3 = str2num(a3);
a4 = tline1(a(3)+4:a(4)+3);
a4 = str2num(a4);
a5 = tline1(a(4)+4:a(5)+3);
a5 = str2num(a5);

tline2 = fgetl(f1);
b = strfind(tline2,'E');
a6 = tline2(1:b(1)+3);
a6 = str2num(a6);
a7 = tline2(b(1)+4:b(2)+3);
a7 = str2num(a7);
%%
%Finding Lower coefficients
a8 = tline2(b(2)+4:b(3)+3);
a8 = str2num(a8);
a9 = tline2(b(3)+4:b(4)+3);
a9 = str2num(a9);
a10 = tline2(b(4)+4:b(5)+3);
a10 = str2num(a10);

tline3 = fgetl(f1);
c = strfind(tline3,'E');
a11 = tline3(1:c(1)+3);
a11 = str2num(a11);
a12 = tline3(c(1)+4:c(2)+3);
a12 = str2num(a12);
a13 = tline3(c(2)+4:c(3)+3);
a13 = str2num(a13);
a14 = tline3(c(3)+4:c(4)+3);
a14 = str2num(a14);

%%
% calculate SPECIFIC HEAT (M=MEDUIM TEMP)
%EXTRACTING GLOBAL TEMPRATURE (L=LOW TEMP ,M=MEDUIM TEMP  ,H=HIGH TEMP)
L = str2num(s{2});
M = str2num(s{3});
H = str2num(s{4});

T = linspace(L,H,1000);  %Temprature range
R=8.314 ;  % Universal gas constant

Cp = Specific_heat(a1,a2,a3,a4,a5,a8,a9,a10,a11,a12,T,R,M);

% calculate ENTROPY
S = Entropy(a1,a2,a3,a4,a5,a7,a8,a9,a10,a11,a12,a14,T,R,M);

% calculate ENTHALPY
H = Enthalpy(a1,a2,a3,a4,a5,a6,a8,a9,a10,a11,a12,a13,T,R,M);

%plotting cp, H and S with Temperature & saving in a folder
%Creating directory
mkdir(['E:\UKARDE BROTHERS\SWARUP\MATLAB PROGRAMS\PROJECT 1\NASA\',species]);  %creating direcotry &   %changing directory

%plotting the graphs [Temprature vs Cp]
figure(1)
plot(T,Cp,'LineWidth',5,'color','r')
title(strcat('Temprature vs Enthalpy','-',species))
legend(species,Location="northwest")
xlabel('Temprature [k]')
ylabel('Cp in [J/(mol K)]');
grid on
saveas(1,'Cp','jpg');

%plotting the graphs [Temprature vs Enthalpy]
figure(2)
plot(T,S,'LineWidth',5,'color','b')
title(strcat('Temprature vs Enthalpy','-',species))
legend(species,Location="northwest")
xlabel('Temprature [k]')
ylabel('Enthalpy in [J]');
grid on
saveas(2,'Entropy','jpg');

%plotting the graphs [Temprature vs Entropy]
figure(3)
plot(T,H,'LineWidth',5,'color','g')
title(strcat('Temprature vs Enthalpy','-',species))
legend(species,Location="northwest")
xlabel('Temprature [k]')
ylabel('Entropy in [J]');
grid on
saveas(3,'Enthalpy','jpg');

saving = (['E:\UKARDE BROTHERS\SWARUP\MATLAB PROGRAMS\PROJECT 1\NASA\',species]);  %Changing directory to orignal matlab path
cd(saving)

% Calculate Molecular weight of the Species
W = Molecular_weight(species)

% writing molecular weight file
MW_file = fopen('Molecular weight.txt','w');

fprintf(MW_file,'Molecular weight of %s is %d ',species,W);
fclose(MW_file);  %Closeing the file
toc
end
Plots for o2, N2 and Co2 species
PLOTS FOR O2
PLOTS FOR N2
PLOTS FOR Co2
LOCATION OF FOLDERS

OUTPUT OF MOLECULAR WEIGHT FOR DIFFRENT SPECIES AND WORKSPACE
https://drive.google.com/drive/folders/1cW3Bb2fjYdcW2PcvC1p6yQ4hwH3gvxPf?usp=sharing
ERRORS :