Week 3 - External flow simulation over an Ahmed body.
AIM
External flow simulation over an Ahmed body.
OBJECTIVE
Ansys Fluent is the industry-leading fluid simulation software known for its advanced physics modeling capabilities and industry leading accuracy.Ansys Fluent gives you more time to innovate and optimize product performance. Trust your simulation results with a software that has been extensively validated across a wide range of applications. With Ansys Fluent, you can create advanced physics models and analyze a variety of fluids phenomena—all in a customizable and intuitive space.
Q1.AHMED BODY
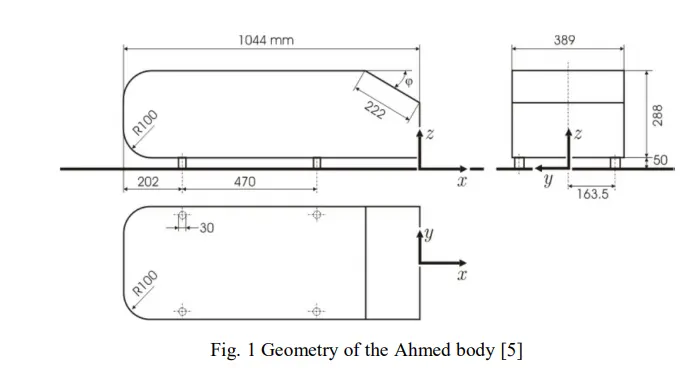
The Ahmed body is a geometric shape first proposed by Ahmed and Ramm in 1984. The shape provides a model to study geometric effects on the wakes of ground vehicles (like cars).The Ahmed body is made up of a round front part, a movable slant plane placed in the rear of the body to study the separation phenomena at different angles, and a rectangular box, which connects the front and rear slant plane . Ahmed body is simplified model of a car body, but it demonstrates all the flow features involved in an actual case of a moving car.
THE DIMESNIONAL DIAGRAM IS GIVEN BELOW.
Q2. Explain the reason for the negative pressure in the wake region.
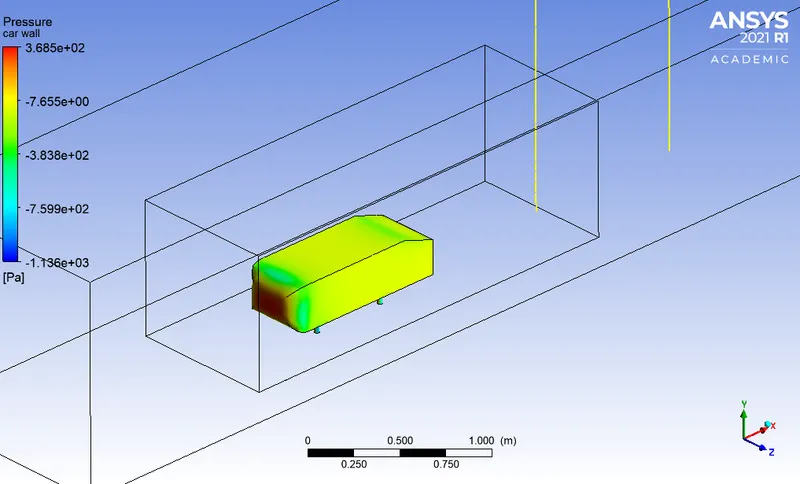
Ans:The following is the reason for the negative pressure in the wake region: Wake is the region of recirculating flow immediately behind a moving or stationary blunt body, caused by viscosity, which may be accompanied by flow separation.As the flow hits the frontal section of the body the maximum pressure gets created in that region and the flow gets seperated in two divisions one above and one below the body. Ahmed body is more like a blunt rectangular bodyand hence the seperate air along the side travelling to the rear end doesnot contact the body surface. This causes the void developing the negative pressurewhere the pressure even drops furtherat the corner of the Ahmed body which we see in contour.
Q3. Explain the significance of the point of separation.
Ans: the boundary seperation occurs due to adverse pressure gradient which means the flow takes place fromlow pressure area to high pressure area. Due to viscocity the velocity of fluid decreases. A point comes when the velocity of fluid particle first reduces to zero at the wall, and then to negetiveat the wall and area closer to the wall while the layer of fluidabove them continues to flow. This leads to boundary layer seperation.
STEPS TO FOLLOW FOR MODELLING AND DEVELOPING MESH FOLLOWED BY PREPROCESSING ARE GIVEN BELOW.
THE VELOCITY OF AIR IS 25m/s AND THE STANDARD VISCOCITY IS TAKEN INTO ACCOUNT.
THE STEPS ARE AS FOLLOWS.
STEP 1- FIRST WE NEED TO OPEN SPACE CLAIM
STEP 2- THEN WE NEED TO IMPORT THE AHMED BODY STEP FILE INTO THE SYSTEM WHICH WILL GENERATE THE BODY.
STEP 3- NOW WE NEED TO MAKE 2 ENCLOSURES. FIRST ONE IS SIGIFIES THE WIND TUNNEL AND THE SECOND NE IS USED FOR MESHING THE WAKE REGION WHERE THERE IS NEGETIVE VELOCITY AND PRESSURE IS ALSO NEGETIVE.
STEP 4-THE ENCLOSURE CAN BE CREATED USING THE ENCLOSURE TOOL IN THE PREPARE SECTION OF THE RIBBON.
STEP 5- AFTER THIS WE WILL SUPRES THE SOLID MODEL OF AHMED BODY FOR PHYSICS AND REMOVE THE INTERFERANCE BETWEEN THE TWO ENCLOSURE AD OPEN MESHING
STEP 6- IN MESHING WE GIVE A MESH SIZE STANDARD OF 100mm AND GENERATE THE MESH.
STEP 7-THEN WE WILL CREATE THE NAME SELCTION OF CARBODY,INLET AND OUTLET.
STEP 8-THEN WE WILL INSERT METHOD OF MESHING TO MULTIZONE WHICH WILL PERFORM HEXAHEDRAL MESH AS FOLLOWS.
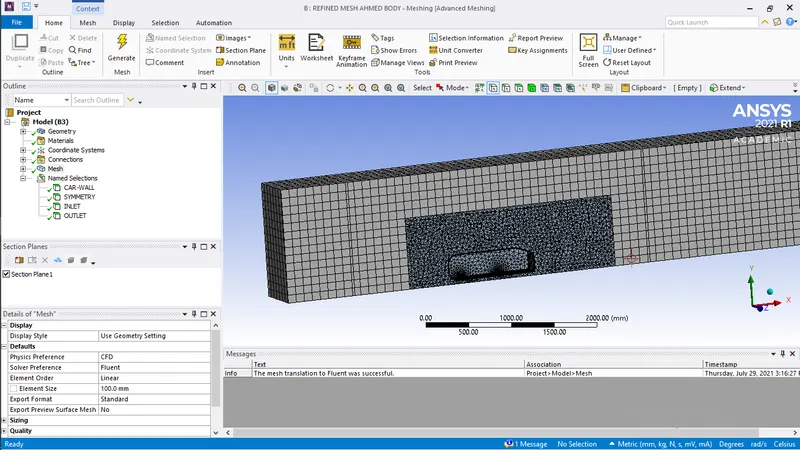
STEP 9- WE WILL INSERT SIZING FOR THE SECONDARY ENCLOSURE TO 50mm WHICH WILL REFINE THE MESH FOR BETTER RESULT TO VIEW THE WAKE REGION.
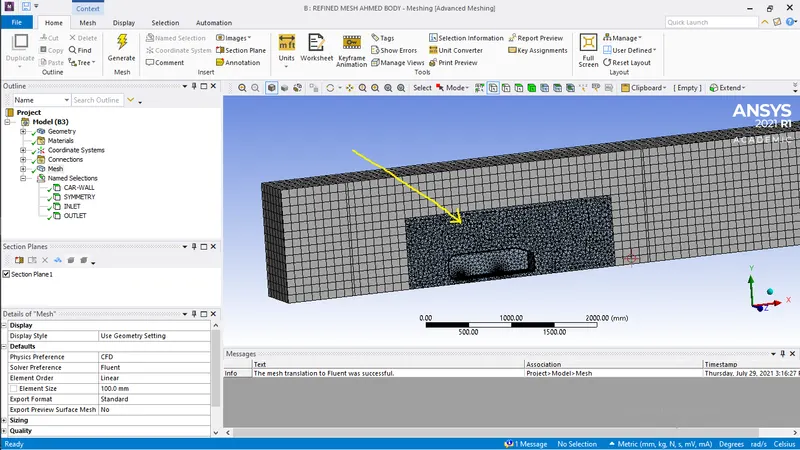
STEP 10- THEN WE WILL AGAIN INSERT SIZING TO REFINE THE MESH NEAR THE WHEEL BASE SO THAT THE MESH BECOMES SMOOTH.
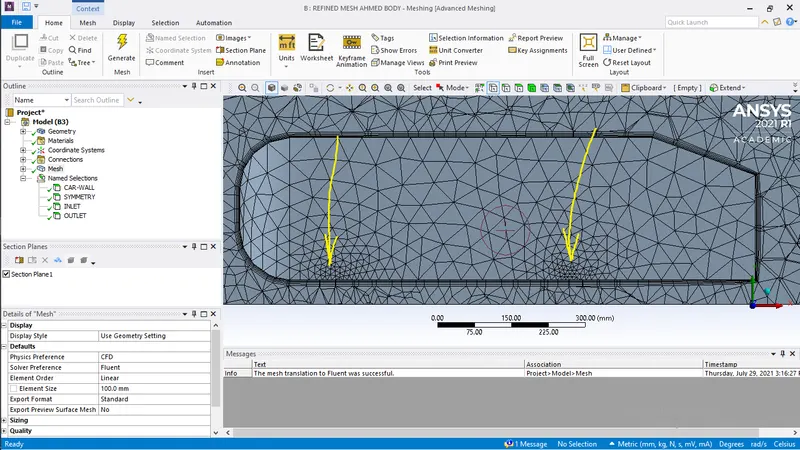
STEP 11- AFTER THIS WE WILL INDUCE INFLATION .WE WILL GIVE A TOTAL HEIGHT OF 12 MM WITH GROWTH RATE OF 1.20 ADN TOTAL OF 6 LAYERS.IT IS MARKED IN RED COLOR.
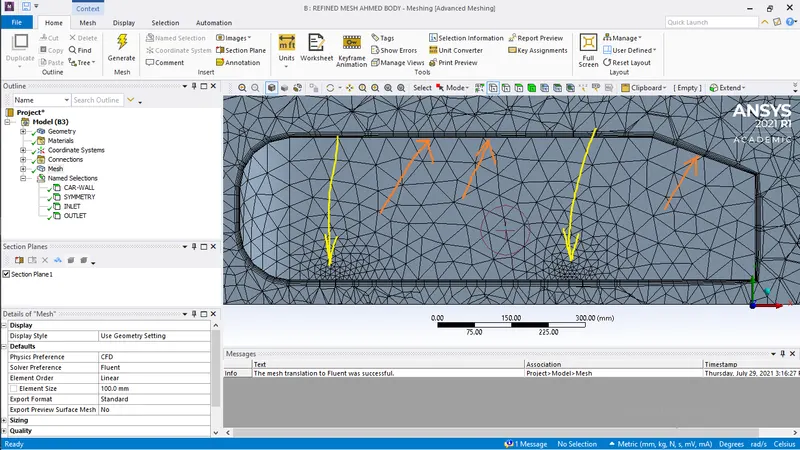
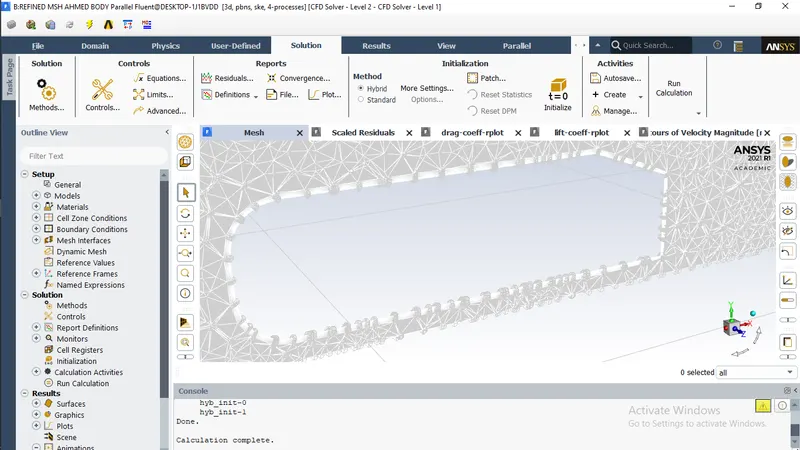
STEP 12-AFTER COMPLETING MESHING OUR TOTAL ELEMENT COUNT IS 194212.
STEP 13- NOW WE WILL BE SETTING UP THE SIMULATION IN THE SETUP OF ANSYS FLUENT.
STEP 14-WE WILL BE USING A PRESSURE BASED SOLVER BECAUSE WE WILL NOT BE REACHIN EVEN 1/5 OF 1 MACH NO. HENCE THE COMPRESIBILITY IS NOT TO BE TAKEN INTO ACCOUNT.
STEP 15-THE k-epsilon TURBULANCE MODEL WILL BE USED TO SOLVE THIS PROBLEM AND THE ENERGY EQUATION WILL BE TURNED OFF.
STEP 16-THE INLET VELOCITY IS DEFINED AS 25m/s ADN THE OUTLET PRESSURE IS 0 GAUGE PRESSURE.
STEP 17-THE REFERENCE VALUE OF AREA AND VELOCITY IS ADDED . THE REFERENCE PROJECTED AREA OF AHMED BODY IS 0.13148 m^2 AND SPEED REFERENCE VALUE IS 25 m/s.
STEP 18- WE WILL CREATE A PLANE ALONG THE XY PLANE TO PROJECT THE VELOCITY CONTOUR AND RECORD THE ANIMATION IN EACH ITERATION AFTER INITIALIZATION.
STEP 19-NOW THAT ALL THE STEPS ARE SET WE WILL COMPUTE THE RESULT FOR 500 ITERATIONS.
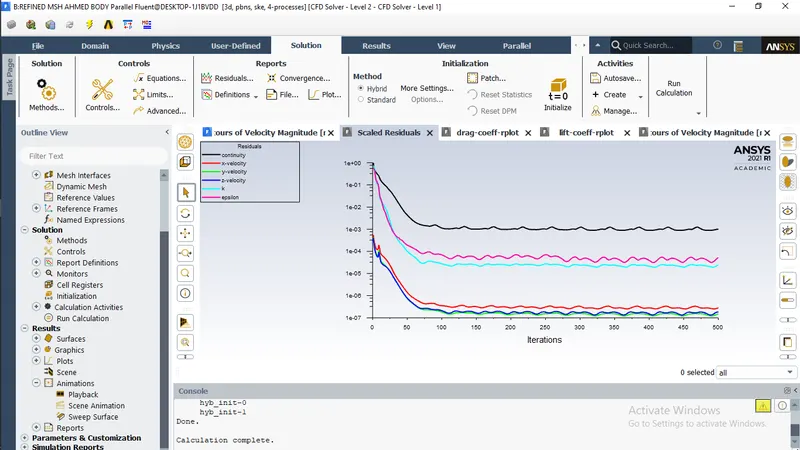
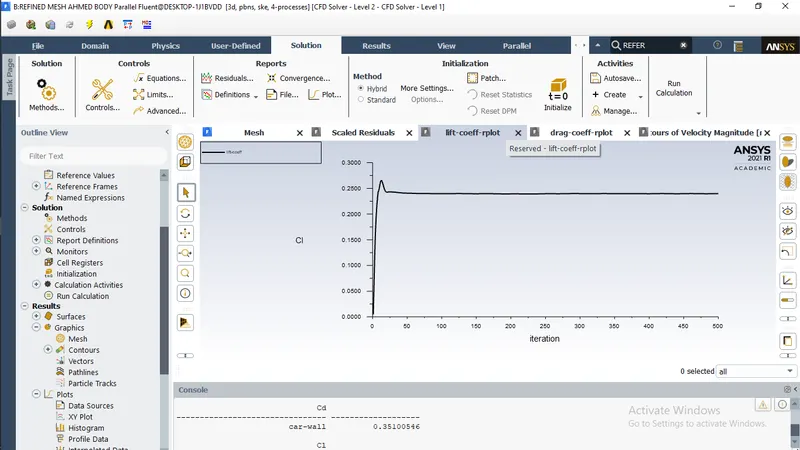
THE FLOW CONVERGES AT 150 ITERATIONS AND CAN BE CONCLUDED FROM THE FOLLOWING RESIDUAL PLOT.
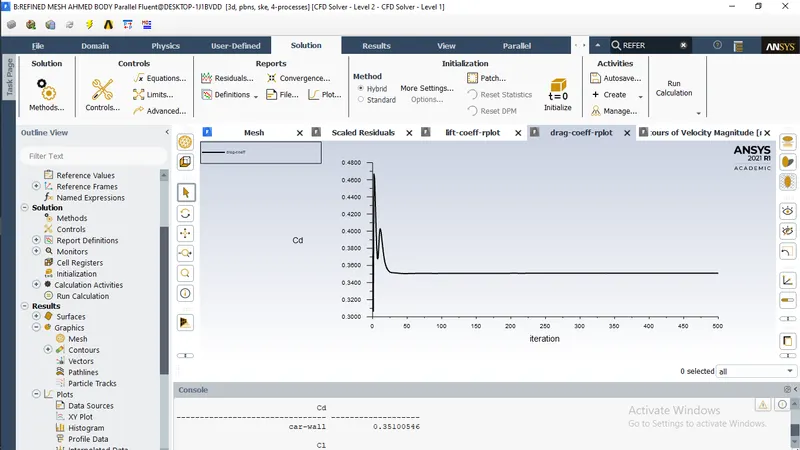
THE PLOT FOR DRAG COEFFICIENT IS AS FOLLOWS AND THE AVERAGE DRAG COEFFICIENT IS 0.35100546.
THE PLOT FOR LIFT COEFFICIENT IS AS FOLLOWS AND THE AVERAGE LIFT COEFFICIENT IS 0.2398.
THE ANIMATION JPG OF VELOCITY CONTOUR IS GIVEN AS FOLLOWS:
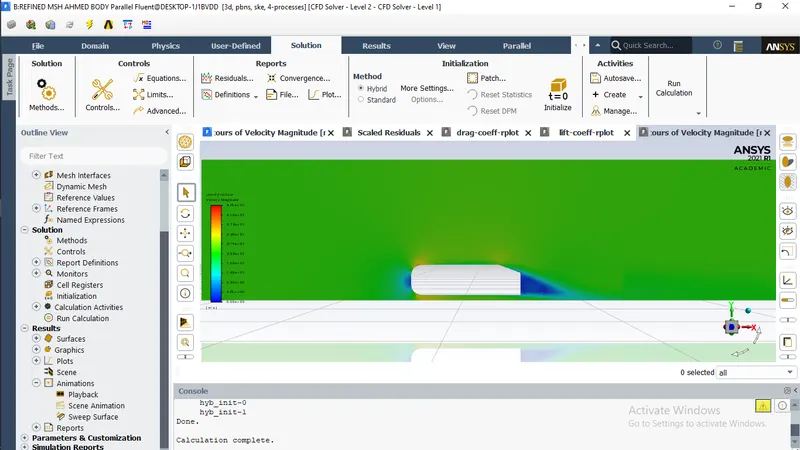
HERE WE CAN SEE THE BLUE PORTION WHICH IS THE REGION OF WAKE.
HERE THE PRESSURE AND VELOCITY FALLS TO NEGATIVE AND THERE IS REVERSE FLOW OF AIR.
THE PRESSURE ON THE AHMED BODY IS DEPICTED IN THE FOLLOWING CONTOUR PLOT.
LET US NOW JUMP INTO POST PROCESSING.
AFTER COMPLEATING THE STEADY STATE SIMULATION IT IS TIME TO SEE SOME RESULTS.
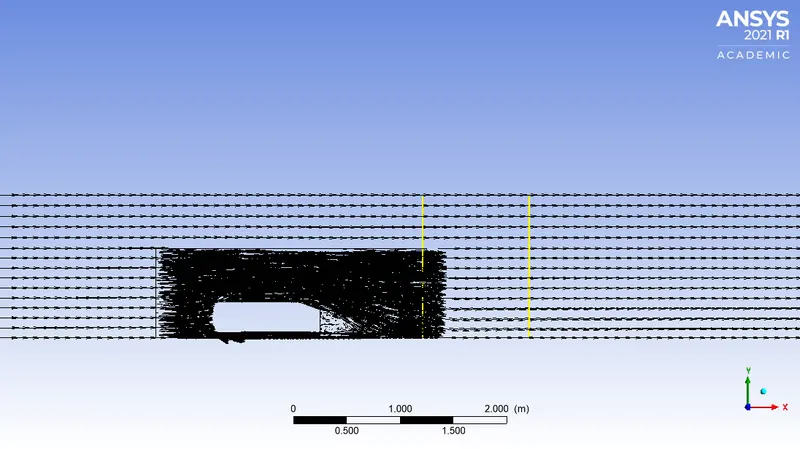
THE VECTOR PLOT OF THE WIND VELOCITY IN THE WIND TUNNEL IS AS FOLOWS.
1.
2.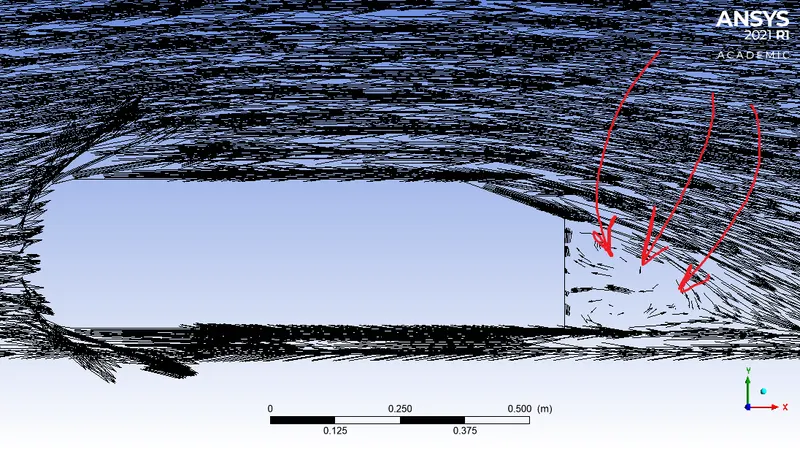
IN THE ABOVE PICTURE WE CAN CLEARLY VISUALIZE THE BACKFLOW OF AIR AND FORMING A PRESSURE DROP WHICH IS THE WAKE REGION.
NOW WE HAVE CREATED TWO LINES ALONG WHICH WE WILL SEE THE VELOCITY PROFILE USING A CHART PLOT.THE LINES CAN BE SEEN IN THE PICTURES BELOW:
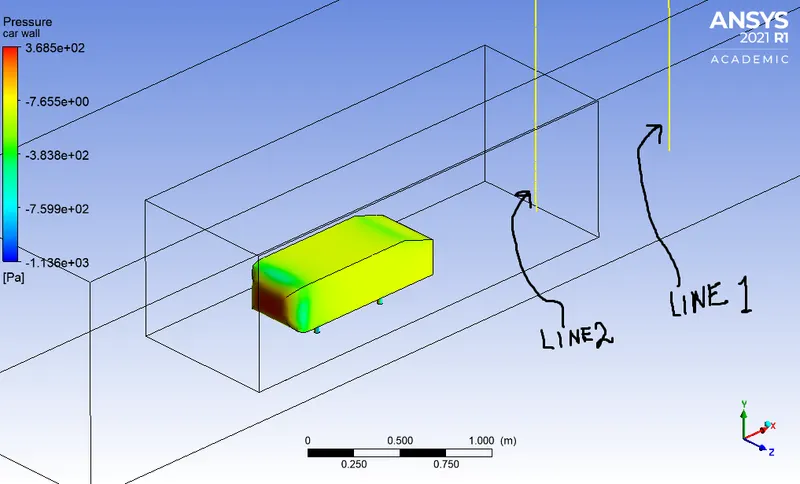
HERE WE ARE TRYING TO SEE THE EFFECT OF WIND PROFILE AFTER ENCOUNTERING THE AHMED BODY.THE PLOT LOOKS LIKE BELOW.
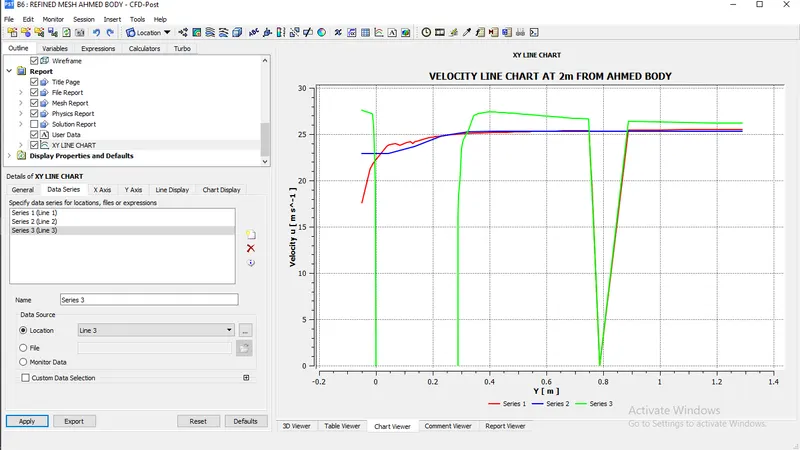
P.S. IGNORE THE GREEN GRAPH(LINE 3)
NOW WE HAVE OBTAINED SIMILAR RESULTS FROM COARSE MESH AND THE ABOVE ONE WITH FINE MESH.THE DIFFERENCE IS VELOCITY PROFILE IS EXPLAINED IN THE EXCEL FILE NAMED FINE MESH ATTACHED BELOW.
Performance the grid independency test and provide the values of drag and lift with each case.

CONCLUSION:
1.THE COEFF OF DRAG AND LIFT CHANGES WITH MESH SIZE.
2.MORE REFINE THE MESH MORE CLEAR IS THE WAKE REGION.
3.THE ERROR PERCENTAGE FOR NOT PERFORMING A FINE MESH ANALYSIS IS QUITE HIGH.
4.NEGATIVE PRESSURE DEVELOPS INSIDE THE WIND TUNNEL AS A RESULT OF BOUNDARY LAYER SEPERATION
THE VIDEO FOR ANIMATION IS ATTACHED BELOW.