Project 1 - Parsing NASA thermodynamic data
THE CODE IS ATTACHED WITH PROPER COMMENTS TO UNDERSTAND THE CODE BETTER.
AIM:- PARSING NASA THERMODYNAMIC DATA
THEORY:-The program utilizes the process of loading and parsing the particular file called THERMO.dat and extracting the needed data from it and consequently plotting graphs with that data and saving them into each seperate directory.Also we will be computing the molecular wt of each species in the command window.
PROCEDURE:- The above process starts with clear all
close all
and clc
By this we get rid of any unwanted data that are present in the window.The consequent steps are mentioned below:-
- Determination of universal gas constant r=8.314
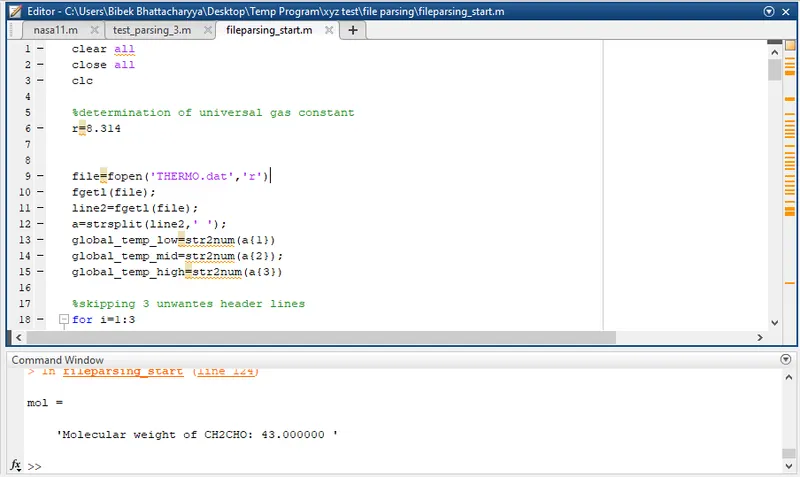
- The next step inolves loading the file in Matlab , skipping the first line, followed by loading and splitting the second line. With this we are seperating 3 strings from that particular line and then we are convering them into number by command str2num .The screenshot is attached below
- The next step involves skipping the next 3 line using a for loop
- Now that we have laid our foundation we can now ,move onto the foundation of our code.This starts with the for loop which is used to calculate the 14 constant of 53 different species and also to computer the specific heat,entropy,enthalpy of the species and plotting the graphs wrt local temperatures. Lastly it will consists of a for loop inside the main for loop to calculate the molecular wt of all the species.
- First we will compute all the constants ,Cp,H,S & plots for monoatomic oxygen.
- So we first load the line with fgetl command and then seperating out the strings using strsplit command.
- We assign the species name to the first string element in the line.
- There are more 4 datas in the line which are importent and they are the 6th,7th and 8th elements which are the local temperatures within which the Cp,H,S are to be calculated.
- The first 7 constants a1-a7 are valid for temperatures greater than or equal to 1000 K & a8-a14 are for temp less then 1000K.
- Splitting the low and high low temp into 1000 equal halves to create values for calculating graph
e.g_t=linspace(local_low_temp,local_high_temp,1000); - Now we will calculate for the constants in the next line.
- We use the pointer'E' to determine the location of all 5 string in that particular line. %then assigning variable b to find out the position of 'E' in that particular line. eg-b=findstr(line1,'E');
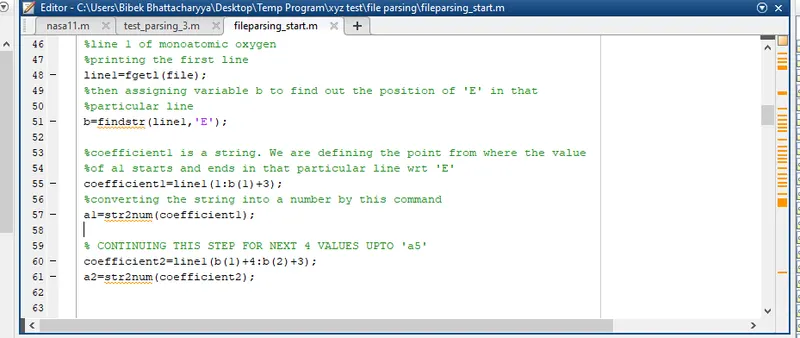
- In the above image you can see that we have used 'b' as a ponter to save the values of the position of E.
- Coefficient1 is a string. We are defining the point from where the value of a1 starts and ends in that particular line wrt 'E' in line 55
- Next converting the string into a number by this command in line57.
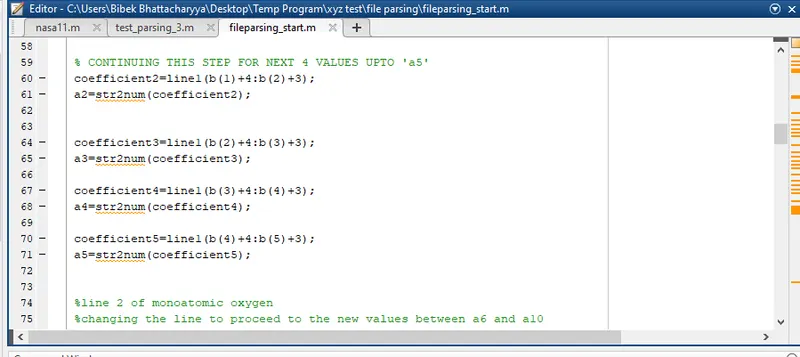
- After that we need to compute the resrt of the 4 string in the line in same manner. The screenshot is attched below.Hence we have successfully computed a1-a5
- Now we proceed to the second line of monoatomic oxygen to compute a6-a10. We follow the same step as previous but the pointer becomes 'b1' and in the next line the pointer becomes 'b2' and hence we compute all 14 constants.
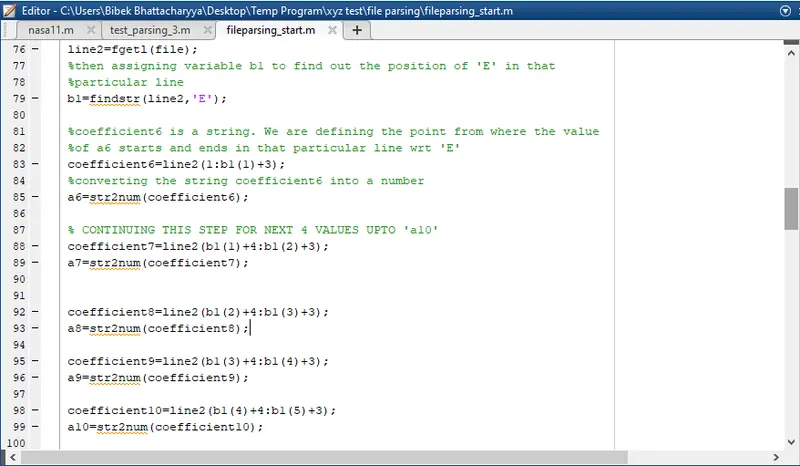
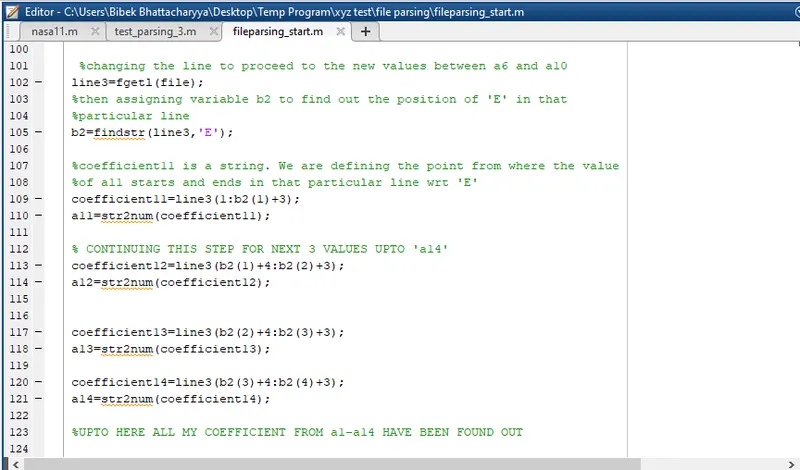
- All the 14 constants have been found out.
- mkdir(species_name)%making directory command for each species(folder creation)
cd(species_name)%current directory command to set it as current
The next step involves finding out the Specific Heat, Enthalpy,and Entropy by the given condition:-
Here we are asigning the formulaes for determining the value sofspecific heat, enthalpy and entropy from the given formulaes
so:
- if
t(i)>=1000 (since a1-a7 is valid for temperature greater then or equal to temp_mid/1000K )
Cp(i)=r*(a1+a2*t(i)+a3*t(i)^2+a4*t(i)^3+a5*t(i)^4);
H(i)=r*t(i)*(a1+a2*t(i)/2+a3*t(i)^2/3+a4*t(i)^3/4+a5*t(i)^4/5+a6/t(i));
S(i)=r*(a1*log(t(i))+a2*t(i)+a3*t(i)^2/2+a4*t(i)^3/3+a5*t(i)^4/4+a7);
else (since a8-a14 is valid for temperature lesserr then temp_mid/1000 kelvin)
Cp(i)=r*(a8+a9*t(i)+a10*t(i)^2+a11*t(i)^3+a12*t(i)^4);
H(i)=r*t(i)*(a8+a9*t(i)/2+a10*t(i)^2/3+a11*t(i)^3/4+a12*t(i)^4/5+a13/t(i));
S(i)=r*(a8*log(t(i))+a9*t(i)+a10*t(i)^2/2+a11*t(i)^3/3+a12*t(i)^4/4+a14);
PLOTTING OF THE CURVES OF T VS CP; T VS H AND T VS S
T=TEMPERATURE
H=ENTHALPY
S=ENTROPY
THE CODE IS INSERTED HERE WITH COMMENTS FOR BETTER UNDERSTANDING
%plotting the curves wrt the values obtained from above for loop
%figure 1 plots the temp vs Cp curve
figure(1)
plot(t,Cp,'linewidth',3)
title(species_name)%labelling title of the  plot
xlabel('Temperature')%labeling X axis
ylabel('Specific Heat,Cp{kJ/kgK}')%labeling Yaxis
grid on %turning the grid on for references
%figure 2 plots the temp vs H curve
figure(2)
plot(t,H,'linewidth',3)
title(species_name)%labelling title of the  plot
xlabel('Temperature')%labeling X axis
ylabel('Enthalpy,h{kJ/kgK}')%labeling Yaxis
grid on%turning the grid on for references
%figure 3 plots the temp vs S curve
figure(3)
plot(t,S,'linewidth',3)
title(species_name)%labelling title of the  plot
xlabel('Temperature')%labeling X axis
ylabel('Entropy,s{kJ/kgK}')%labeling Yaxis
grid on%turning the grid on for references
%saving the plots in the directory as fer figure number with respective
%lables
saveas(1,"Cp vs t.jpg")
saveas(2,"H vs t.jpg")
saveas(3,"S vs t.jpg")
cd ..           %cd .. is used to exit the loop of one directory,to come back and again form another directory
%cd .. is a command that is used to come out of the present directory .
%so when the loop again continues it creates another directory using
%mkdir(species_name)
%and assigning the values in that directory using cd(species_name)
THE SAVEAS COMMAND IS USED TO CONVERT AND SAVE THE PLOTS IN JPG FORMAT IN CURRENT DIRECTORY. THE PLOTS ARE SAVED BY FIGURE NUMBERS AND HAVE TITLE AT TOP TO UNDERSTAND WHICH SPECIES IT IS DISPLAYING.
MOLECULAR WEIGHT CALCULATION:-
- Firstly we have to assign the basic values of 'H','C','O','N','A'.
- Atomic_wt of the above elements are 1 12 16 14 40 respectively.
- Then we use the following for loop to compare the elements of 53 species to find out which species have what element and in how many numbers.
- for k=1:length(species_name)
for l=1:length(elements)
if strcmp(species_name(k),elements(l)) %string comparison
%comparison of the chracters, and proceed if yes
mol_wt=mol_wt+atomic_wt(l);
position=l; %storing the position for reference outside loop
end
end - n=str2double(species_name(k));
if n>1
mol_wt= mol_wt+atomic_wt(position)*(n-1); % adding the extra atoms' weights
end
end
mol=sprintf('Molecular weight of %s: %f ',species_name,mol_wt) %THIS LINE IS USED TO PRINT THE MOLECULAR WEIGHT INTHE COMMAND WINDOW. 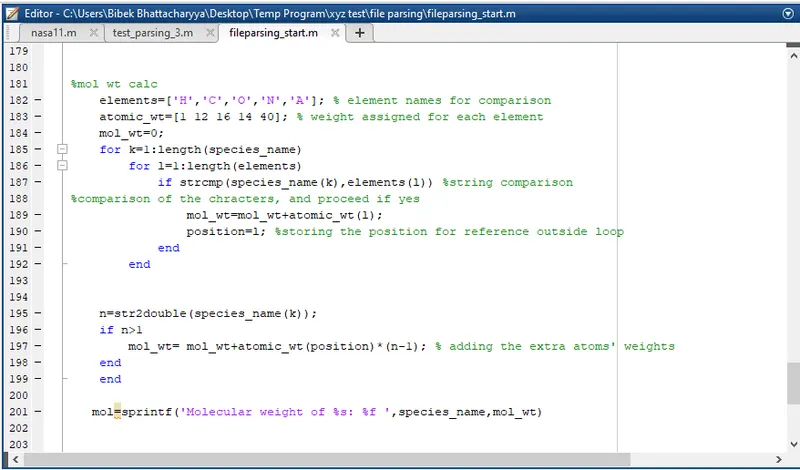
AT THE END WE CLOSE THE BIG FOR LOOP OF 53 ELEMENTS TO COMPUTE THE CALCULATION.
THE MOL WT WILL BE DISPLAYED IN COMMAND WINDOW. SCREENSHOT IS ATTACHED BELOW.
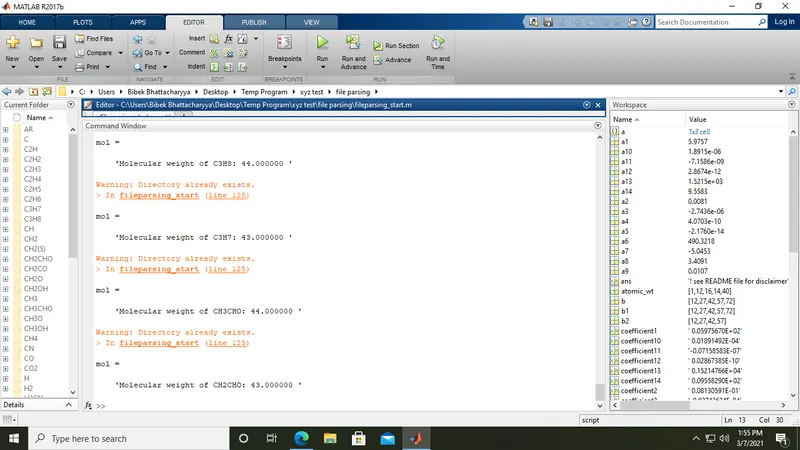
THE ENTIRE CODE IS ATTACHED BELOW WITH COMMENTS TO FURTHER EXPLORE AND FOR BETTER UNDERSTANDING.
clear all
close all
clc

%determination of universal gas constant
r=8.314


file=fopen('THERMO.dat','r')
fgetl(file);
line2=fgetl(file);
a=strsplit(line2,' ');
global_temp_low=str2num(a{1})
global_temp_mid=str2num(a{2});
global_temp_high=str2num(a{3})

%skipping 3 unwantes header lines
for i=1:3
    fgetl(file);
end

%here we ahve 53 species so we need a for loop to facilitate the calculation
%of all 53 species and get the graphs.
for i=1:53

%     reading the header line for the monoatomic oxygen
x=fgetl(file);
%seperating the line into number f different styrings and segrigating and
%picking by choice
y=strsplit(x);

%denoting the first charecter as species name
species_name=y{1};

%Determining the local low mid and high temperatures.
 local_low_temp=str2num(y{length(y)-3});%local_low_temp=str2num(y{6})
local_mid_temp=str2num(y{length(y)-1});%local_mid_temp=str2num(y{8})
local_high_temp=str2num(y{length(y)-2});%local_high_temp=str2num(y{7})

% splitting the low and high low temp into 1000 equal halves to create
% values for calculating graph
t=linspace(local_low_temp,local_high_temp,1000);


%line 1 of monoatomic oxygen
%printing the first line
line1=fgetl(file);
%then assigning variable b to find out the position of 'E' in that
%particular line
b=findstr(line1,'E');

%coefficient1 is a string. We are defining the point from where the value
%of a1 starts and ends in that particular line wrt 'E'
coefficient1=line1(1:b(1)+3);
%converting the string into a number by this command
a1=str2num(coefficient1);

% CONTINUING THIS STEP FOR NEXT 4 VALUES UPTO 'a5'
coefficient2=line1(b(1)+4:b(2)+3);
a2=str2num(coefficient2);


coefficient3=line1(b(2)+4:b(3)+3);
a3=str2num(coefficient3);

coefficient4=line1(b(3)+4:b(4)+3);
a4=str2num(coefficient4);

coefficient5=line1(b(4)+4:b(5)+3);
a5=str2num(coefficient5);


%line 2 of monoatomic oxygen
%changing the line to proceed to the new values between a6 and a10
line2=fgetl(file);
%then assigning variable b1 to find out the position of 'E' in that
%particular line
b1=findstr(line2,'E');

%coefficient6 is a string. We are defining the point from where the value
%of a6 starts and ends in that particular line wrt 'E'
coefficient6=line2(1:b1(1)+3);
%converting the string coefficient6 into a number
a6=str2num(coefficient6);

% CONTINUING THIS STEP FOR NEXT 4 VALUES UPTO 'a10'
coefficient7=line2(b1(1)+4:b1(2)+3);
a7=str2num(coefficient7);


coefficient8=line2(b1(2)+4:b1(3)+3);
a8=str2num(coefficient8);

coefficient9=line2(b1(3)+4:b1(4)+3);
a9=str2num(coefficient9);

coefficient10=line2(b1(4)+4:b1(5)+3);
a10=str2num(coefficient10);

 %changing the line to proceed to the new values between a6 and a10
line3=fgetl(file);
%then assigning variable b2 to find out the position of 'E' in that
%particular line
b2=findstr(line3,'E');

%coefficient11 is a string. We are defining the point from where the value
%of a11 starts and ends in that particular line wrt 'E'
coefficient11=line3(1:b2(1)+3);
a11=str2num(coefficient11);

% CONTINUING THIS STEP FOR NEXT 3 VALUES UPTO 'a14'
coefficient12=line3(b2(1)+4:b2(2)+3);
a12=str2num(coefficient12);


coefficient13=line3(b2(2)+4:b2(3)+3);
a13=str2num(coefficient13);

coefficient14=line3(b2(3)+4:b2(4)+3);
a14=str2num(coefficient14);

%UPTO HERE ALL MY COEFFICIENT FROM a1-a14 HAVE BEEN FOUND OUT

mkdir(species_name)%making directory command for each species(folder creation)
cd(species_name)%current directory command to set it as current

for i=1:length(t)%THIS FOR LOOP EXISTS BETWEEN ALL THE VALUES FOR WHICH THE t EXISTS, ie ALL 1000 VALUES OF TEMPERATURE

    %here we are asigning the formulaes for determining the value sof
    %specific heat, enthalpy and entropy from the given formulaes
    if t(i)>=1000 %since  a1-a7 is valid for temperature greater then or equal to temp_mid/1000K
        Cp(i)=r*(a1+a2*t(i)+a3*t(i)^2+a4*t(i)^3+a5*t(i)^4);
        H(i)=r*t(i)*(a1+a2*t(i)/2+a3*t(i)^2/3+a4*t(i)^3/4+a5*t(i)^4/5+a6/t(i));
        S(i)=r*(a1*log(t(i))+a2*t(i)+a3*t(i)^2/2+a4*t(i)^3/3+a5*t(i)^4/4+a7);
    else   %since  a8-a14 is valid for temperature lesserr then temp_mid/1000 kelvin
        Cp(i)=r*(a8+a9*t(i)+a10*t(i)^2+a11*t(i)^3+a12*t(i)^4);
        H(i)=r*t(i)*(a8+a9*t(i)/2+a10*t(i)^2/3+a11*t(i)^3/4+a12*t(i)^4/5+a13/t(i));
        S(i)=r*(a8*log(t(i))+a9*t(i)+a10*t(i)^2/2+a11*t(i)^3/3+a12*t(i)^4/4+a14);
    end


end
%plotting the curves wrt the values obtained from above for loop
%figure 1 plots the temp vs Cp curve
figure(1)
plot(t,Cp,'linewidth',3)
title(species_name)%labelling title of the  plot
xlabel('Temperature')%labeling X axis
ylabel('Specific Heat,Cp{kJ/kgK}')%labeling Yaxis
grid on %turning the grid on for references
%figure 2 plots the temp vs H curve
figure(2)
plot(t,H,'linewidth',3)
title(species_name)%labelling title of the  plot
xlabel('Temperature')%labeling X axis
ylabel('Enthalpy,h{kJ/kgK}')%labeling Yaxis
grid on%turning the grid on for references
%figure 3 plots the temp vs S curve
figure(3)
plot(t,S,'linewidth',3)
title(species_name)%labelling title of the  plot
xlabel('Temperature')%labeling X axis
ylabel('Entropy,s{kJ/kgK}')%labeling Yaxis
grid on%turning the grid on for references
%saving the plots in the directory as fer figure number with respective
%lables
saveas(1,"Cp vs t.jpg")
saveas(2,"H vs t.jpg")
saveas(3,"S vs t.jpg")
cd ..           %cd .. is used to exit the loop of one directory,to come back and again form another directory
%cd .. is a command that is used to come out of the present directory .
%so when the loop again continues it creates another directory using
%mkdir(species_name)
%and assigning the values in that directory using cd(species_name)


%mol wt calc
    elements=['H','C','O','N','A']; % element names for comparison
    atomic_wt=[1 12 16 14 40]; % weight assigned for each element
    mol_wt=0;
    for k=1:length(species_name)
        for l=1:length(elements)
            if strcmp(species_name(k),elements(l)) %string comparison
%comparison of the chracters, and proceed if yes
                mol_wt=mol_wt+atomic_wt(l);
                position=l; %storing the position for reference outside loop
            end
        end


    n=str2double(species_name(k));
    if n>1
        mol_wt= mol_wt+atomic_wt(position)*(n-1); % adding the extra atoms' weights
    end
    end

   mol=sprintf('Molecular weight of %s: %f ',species_name,mol_wt)


end

%end of the for loop to proceed to the next loop or species
- THE PLOTS FOR O2,N2 AND CO2 ATTACHED BELOW IN RAR DOCUMENT.
- ALL DATA PRESENT IS THE SCREENSHOT FOR REPRESENTING THE WINDOW CONTAINING ALL THE SPECIES FOLDERS.
- FILE PARSING ALL FILE (RAR FILE) CONATINS ALL 53 SPECIES PLOTS.
CONCLUSION:-WITH THIS CODE WE HAVE SUCCESSFULLY COMPLETED THE PARSING OF NASA's THERMODYNAMIC FILE AND PLOTTED THE GRAPHS FOR LOCAL TEMP VS CP,H &S. WE HAVE ALSO COMPUTED FOR THE MOLECULAR WEIGHT ALL SPECIES TO DISPLAY IN COMMAND WINDOW.