Week 3 - External flow simulation over an Ahmed body.
Q1: Ahmed's Body and its Importance
Ahmed’s body is a simplified geometric model introduced by S.R. Ahmed in 1984 to study airflow over vehicles. It is commonly used in wind tunnel experiments and CFD simulations. The model consists of a rectangular base, flat roof, straight sides, and a rear slant with variable angles, designed to mimic basic vehicle shapes without intricate details like mirrors or wheel arches.
The importance of Ahmed’s body lies in its ability to study key aerodynamic principles such as flow separation and wake formation, particularly at the rear slant. It helps analyze drag coefficient, which is crucial for automotive design focused on fuel efficiency. Additionally, the wake region behind the body, where vortices form, provides insights into how these turbulent flows affect aerodynamic performance. One significant discovery is that slant angles between 25° and 30° cause the highest drag due to strong flow separation, making this a critical area of study for vehicle design improvements.
Q2: Negative Pressure in the Wake Region
The wake region behind an object like Ahmed’s body experiences negative pressure due to flow separation, turbulence, and vortex formation. As airflow moves over the object, it separates near sharp edges, creating a turbulent zone with lower velocity and, consequently, lower pressure, according to Bernoulli’s principle. This turbulent wake acts like a vacuum, pulling back on the object and increasing drag.
Vortices that form in this region further contribute to the low pressure, making the wake a critical factor in overall drag. The inability of the airflow to recover pressure in this turbulent zone leads to additional aerodynamic resistance, which is especially significant for blunt objects like Ahmed’s body or cars.
Q3: Significance of the Point of Separation
The point of separation marks where airflow detaches from the surface of an object, such as a vehicle or Ahmed’s body, creating turbulence and affecting aerodynamic performance. This point is crucial for controlling drag, as delaying separation can reduce drag by keeping the airflow smoother for longer. The location of this separation also influences whether the wake behind the object is laminar (lower drag) or turbulent (higher drag).
The point of separation also plays a key role in vortex formation, which can affect vehicle stability at high speeds. Designers manipulate this point using tools like spoilers to reduce drag and improve handling. In automotive design, controlling the point of separation is essential for balancing pressure drag and skin friction drag, improving overall fuel efficiency and aerodynamic performance.
Introduction
The simulation project focuses on analyzing the aerodynamic properties of the Ahmed body, a simplified geometric model widely used in automotive and aerodynamics research. The Ahmed body is significant because it provides insights into fundamental airflow behaviors, such as drag, flow separation, and wake formation, making it a valuable tool for optimizing vehicle designs for better fuel efficiency and performance. This project aims to understand these phenomena using Computational Fluid Dynamics (CFD) simulations. 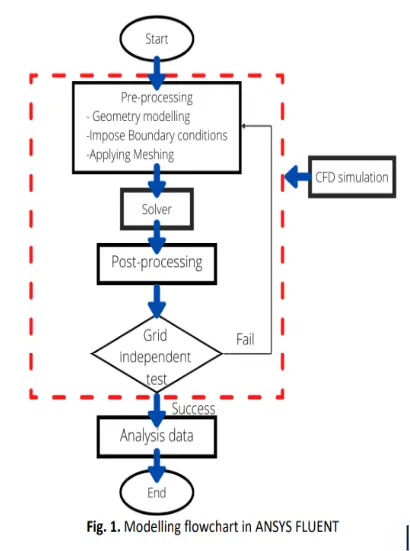
The CFD process follows the steps outlined in Figure 1. The process begins with pre-processing, which involves geometry modeling, imposing boundary conditions, and applying meshing to the Ahmed body. The solver is then used to compute the simulation results, followed by post-processing to analyze the output. To ensure accuracy, a grid independence test is conducted, which checks whether further mesh refinement significantly alters the results. If the test fails, adjustments are made, and the simulation is re-run. Once the simulation passes the grid independence test, the results are analyzed to draw meaningful conclusions about the Ahmed body’s aerodynamic performance.
Overview of the project
The explanation of the simulation setup
Results
Grid-independent study
Reference
The explanation of the simulation setup
The simulation begins with the creation of the geometry using SpaceClaim. Since the Ahmed body is symmetric along the z=0 plane, only half of the domain is modeled to reduce computational cost and improve efficiency. By leveraging this symmetry, the problem size is effectively halved without sacrificing accuracy in the simulation results.
Following the geometry creation, the next step is meshing, where the mesh is carefully generated to balance accuracy and computational load. After meshing, the solver settings are configured, followed by the setup of the physics governing the simulation. This involves defining the relevant fluid dynamics properties and conditions. The solution models and methods are then selected to ensure accurate representation of the aerodynamic phenomena being studied. This structured approach ensures a streamlined and efficient simulation process while maintaining high levels of accuracy.
Geometry of Ahmed body
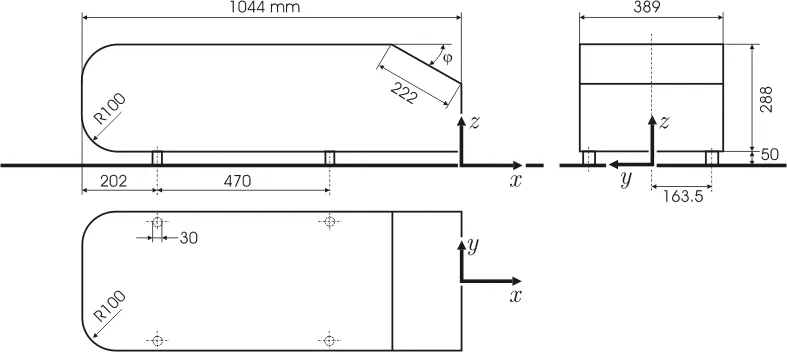
Figure 2
The Ahmed body is a simplified model of a ground vehicle that is used to study the geometric effects on the wakes of vehicles. The geometry of the Ahmed body includes:
Dimensions: The Ahmed body is 1.044 m long, 0.288 m high, and 0.389 m wide.
Rear slant angle: The rear slant angle of the Ahmed body is typically 25°.
Flow field: The flow field of the Ahmed body includes two major vortices, an "empty" region behind the body, and one vortex from the interaction between the floor and the stilts.
Wake: The wake of the Ahmed body is highly dependent on the slant angle. When the slant angle is less than 12°, the flow remains attached over the slant. When the slant angle is between 12° and 30°, the flow becomes more three-dimensional. When the slant angle is past 30°, the flow separates fully off the slant.
Meshing Process
Various mesh configurations with element sizes of 25 mm, 50 mm, and 75 mm are generated for the study. An inflation layer is applied with a maximum thickness of 12.5 mm, a growth rate of 1.2, and a total of 5 layers to refine the mesh near critical areas. The meshing domain is split into two regions, with the region closest to the area of interest referred to as the "body of influence." To achieve finer control in this area, the "body sizing" option is utilized in the meshing process.
The dimensions of the body sizing around the Ahmed body are carefully defined to ensure accurate results. Specifically, the body sizing extends 0.26 meters away from the Ahmed body along the faces parallel to the z-axis. In the y-axis direction, the sizing extends 0.5 meters above the surface parallel to the y-axis. Additionally, the body sizing reaches 0.5 meters in front of the Ahmed body and 1 meter behind it, aligned with the x-axis. This detailed sizing ensures that the mesh accurately captures the flow behavior around the body while maintaining computational efficiency.
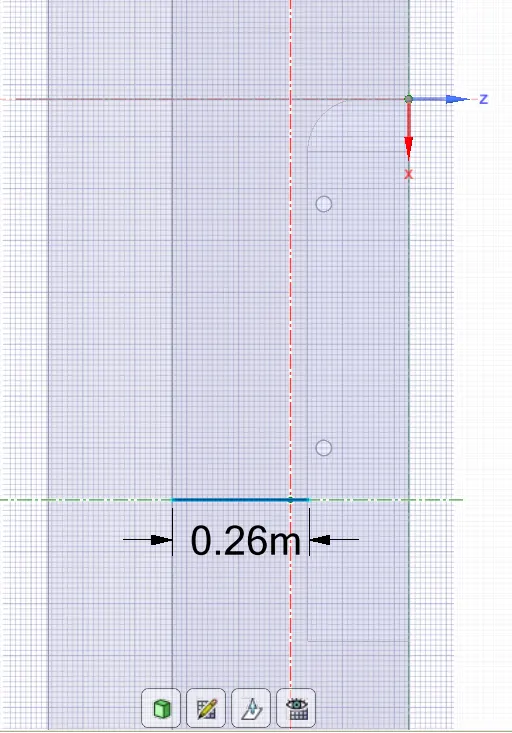
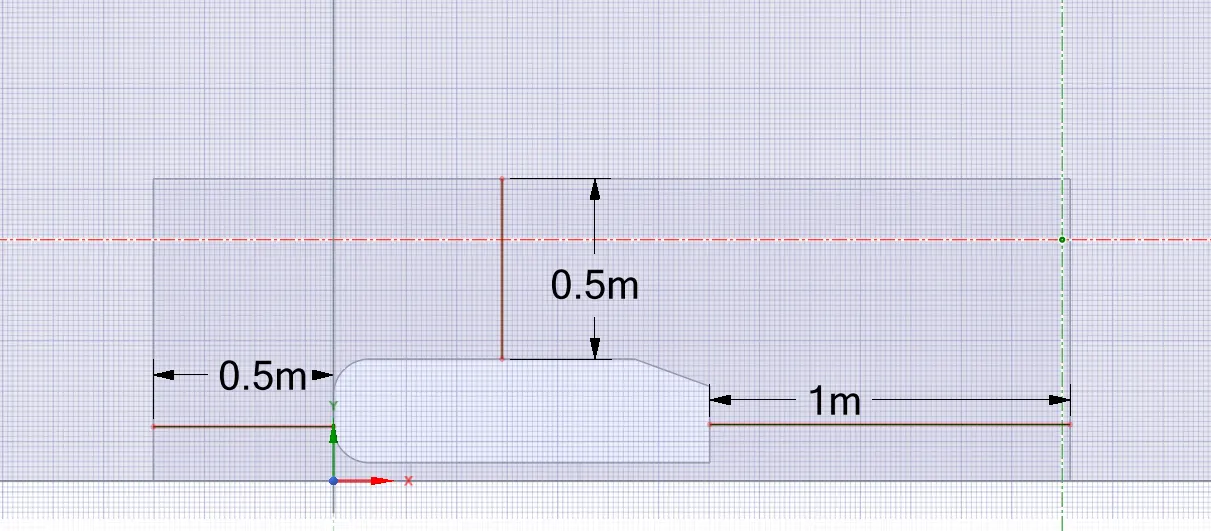
Figure 3. Showing the mesh regions.
Tetrahedral meshes were utilized in the simulation to capture the geometric features of the model. To enhance simulation efficiency and ensure accuracy in the region of interest, the mesh was refined in specific areas by creating a "body of influence." This technique allowed for finer mesh resolution where it was most needed, improving the quality of the simulation without unnecessarily increasing the computational load.
Additionally, face sizing was applied to circular areas where the standard mesh struggled to capture curved geometric features due to its coarseness. This refinement ensured that the mesh adequately represented the curvature and detail of the geometry, providing more accurate simulation results in regions with complex shapes.
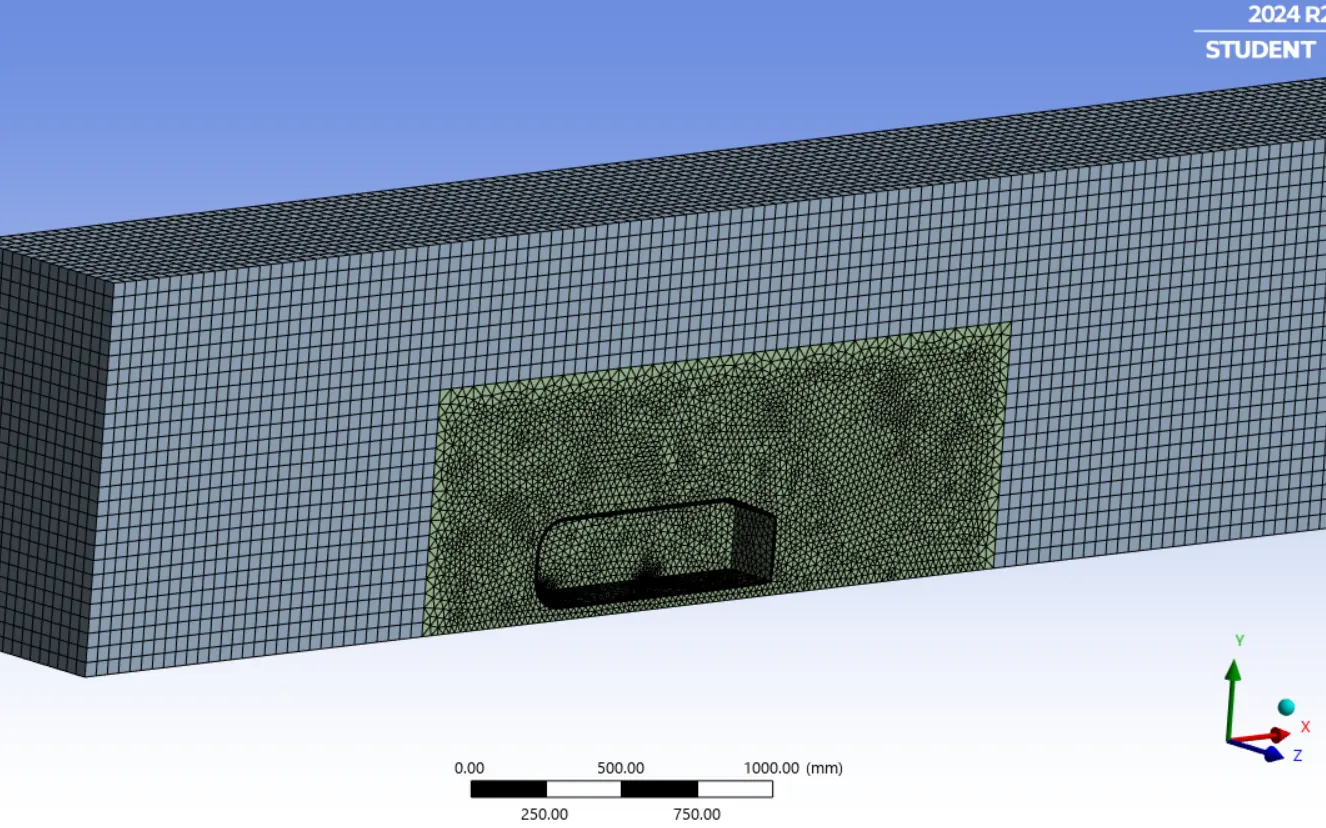
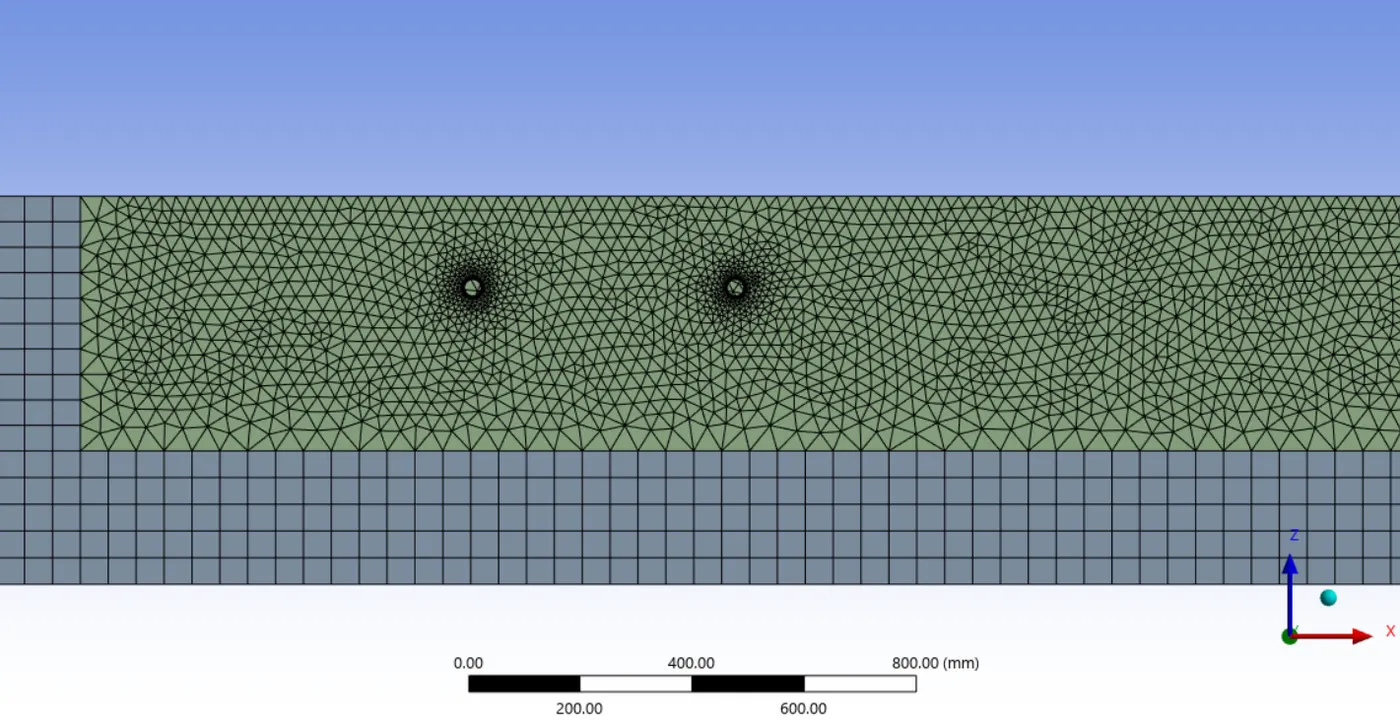
Figure 4. Showing the meshing of the domain and face sizing.
Mesh Quality:
Minimum Orthogonal Quality = 1.37370e-01 cell 116229 on zone 3 (ID: 195607 on partition: 1) at location ( 2.28171e-01, 3.93737e-02, -1.70227e-01)
Maximum Aspect Ratio = 7.13104e+01 cell 138847 on zone 3 (ID: 66486 on partition: 3) at location ( 1.03563e+00, 5.87596e-02, -1.94775e-01)
Domain Extents:
x-coordinate: min (m) = -2.000000e+00, max (m) = 6.044000e+00
y-coordinate: min (m) = 0.000000e+00, max (m) = 1.338000e+00
z-coordinate: min (m) = -6.945000e-01, max (m) = 0.000000e+00
Volume statistics:
minimum volume (m3): 2.128034e-09
maximum volume (m3): 1.197604e-04
total volume (m3): 7.419099e+00
Face area statistics:
minimum face area (m2): 1.927863e-06
maximum face area (m2): 2.505629e-03
Solver Settings
In reference values, the area is given as 0.05756699, which was computed automatically from the ‘project surface areas’ (depicted in Figure 5 a.) from the 'Reports’ section.
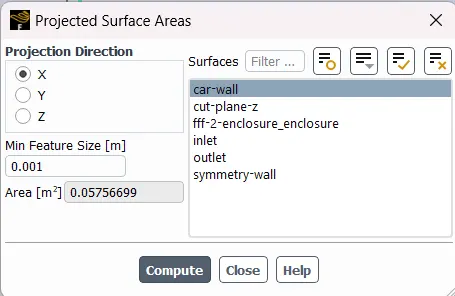
Figure 5 a.
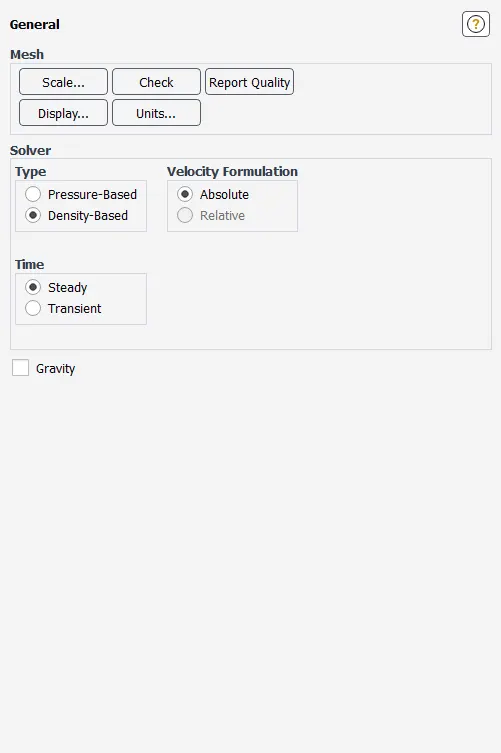
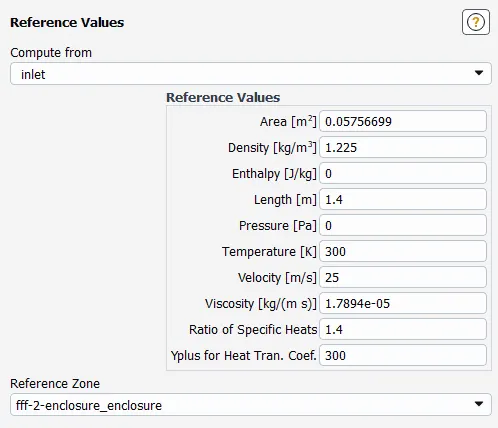
Figure 5 b. Shows the ‘General’ and ‘Reference Values’ windows from solver settings.
A density-based solver is used to consider compressibility effects and steady state because of no time dependence.
The material for this work is air.
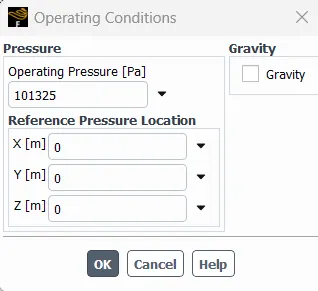
Figure 6. Operating Conditions
Physics of simulation
Standard k-epsilon model with
Inlet Velocity, V=25 m/s,
Density of air = 1.225 kg/m3,
temperature = 300 K
and viscosity = 1.7894e-5 kg s/m.
Boundary conditions are uniform velocity at inlet, uniform pressure at outlet, and symmetry at wall.
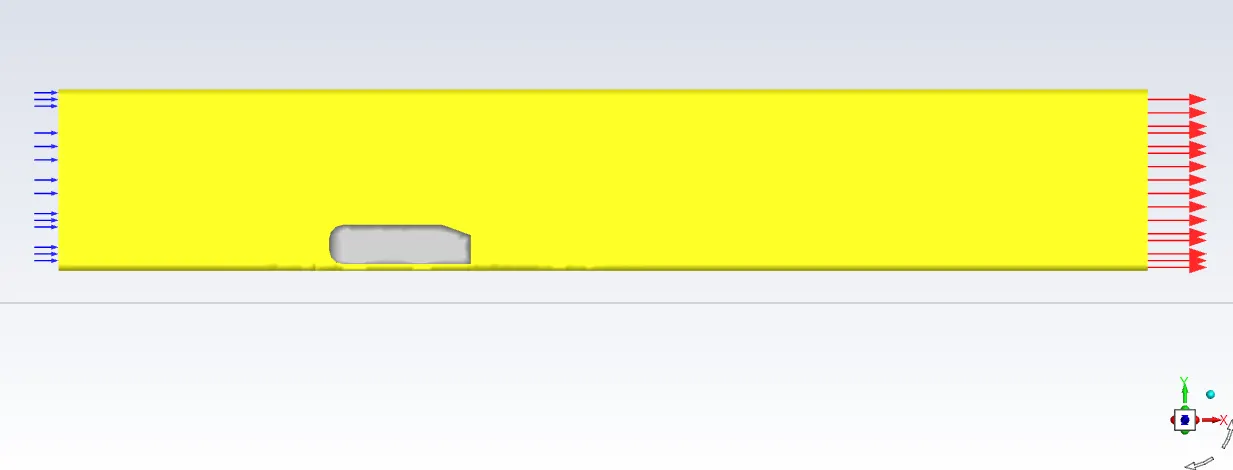
Figure 7. Showing boundary condition
Solution Models and Methods
Models used in this simulation are energy and viscous; kw-sst was taken as the viscous model (Figure 6 ). The SST models are generally less sensitive to the free-stream conditions and avoid buildup of excessive turbulent kinetic energy near stagnation points as compared to the usual k-epsilon models.
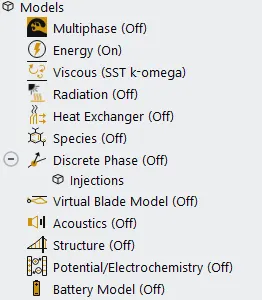
Figure 8. Showing solution models
used in simulation
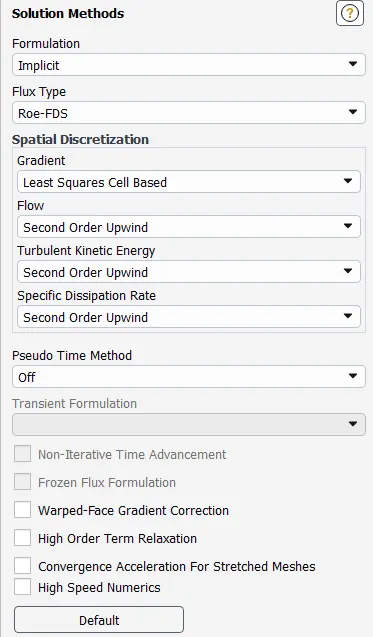
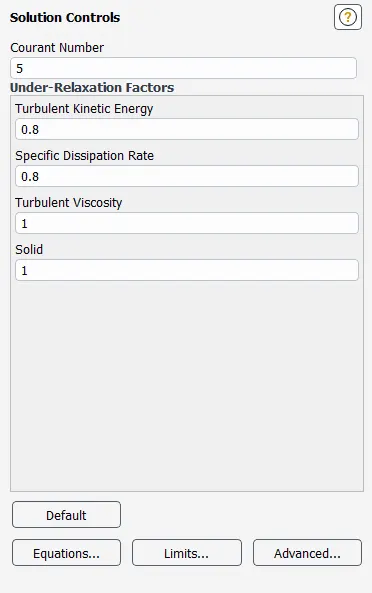
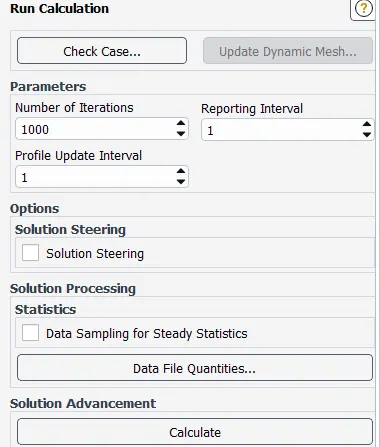
Figure 9. Showing settings in Solution Methods, Solution Controls, and Run Calculation tabs.
Results
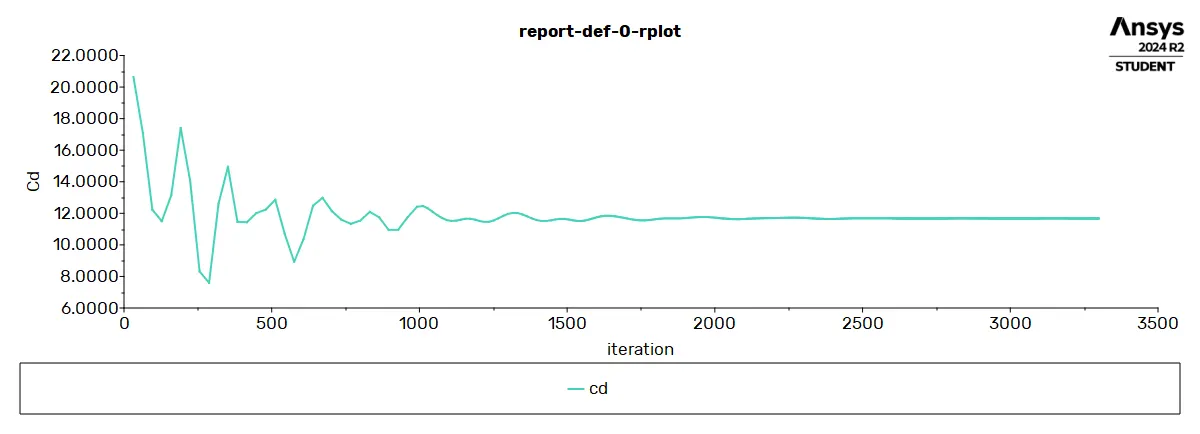
Figure 10a.
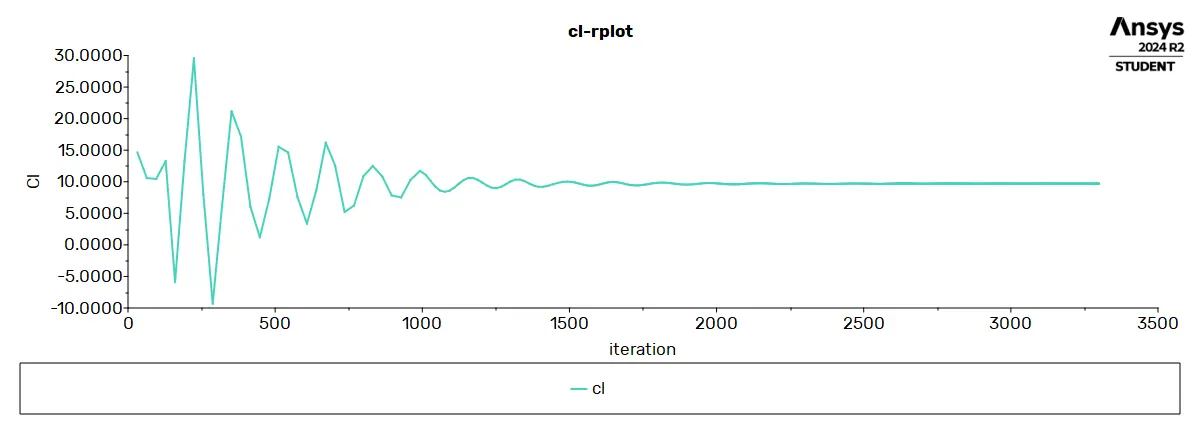
Figure 10b.
Figures 10a and 10b show the cd and cl plots; the iterations were run till 3500. The horizontal straight line in plotted values determines the convergence of the solution.
Velocity and pressure contour
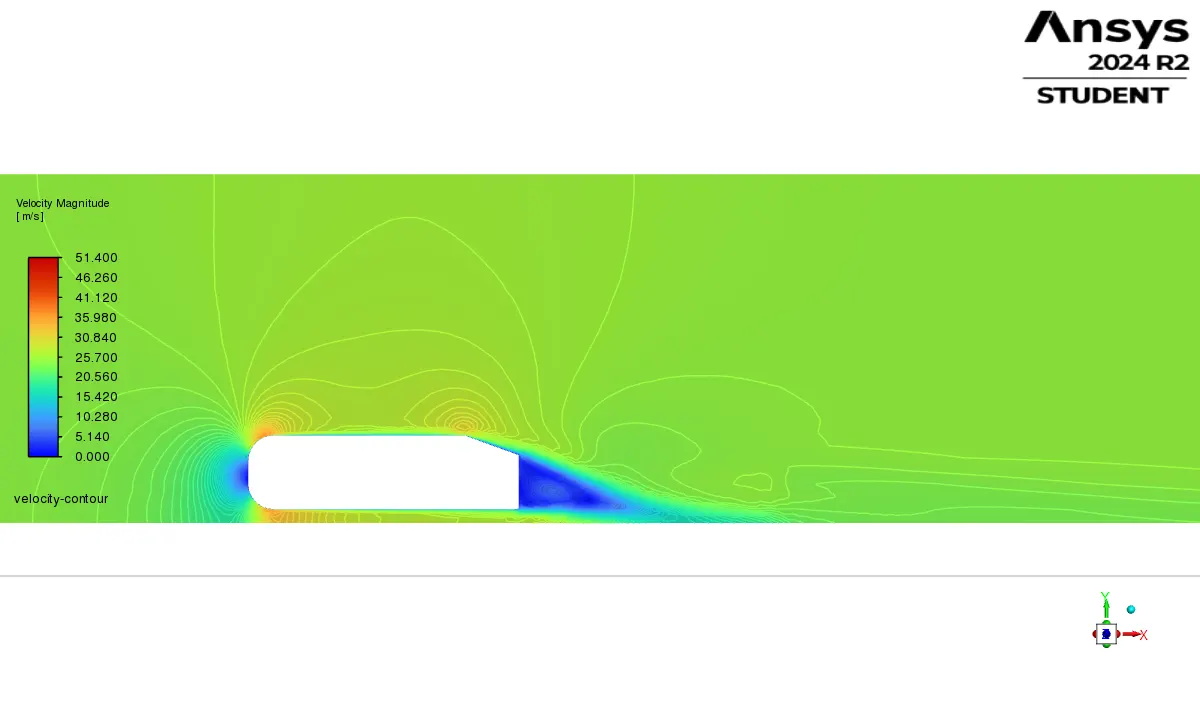 Figure 11a. Velocity contour at z=0 plane.
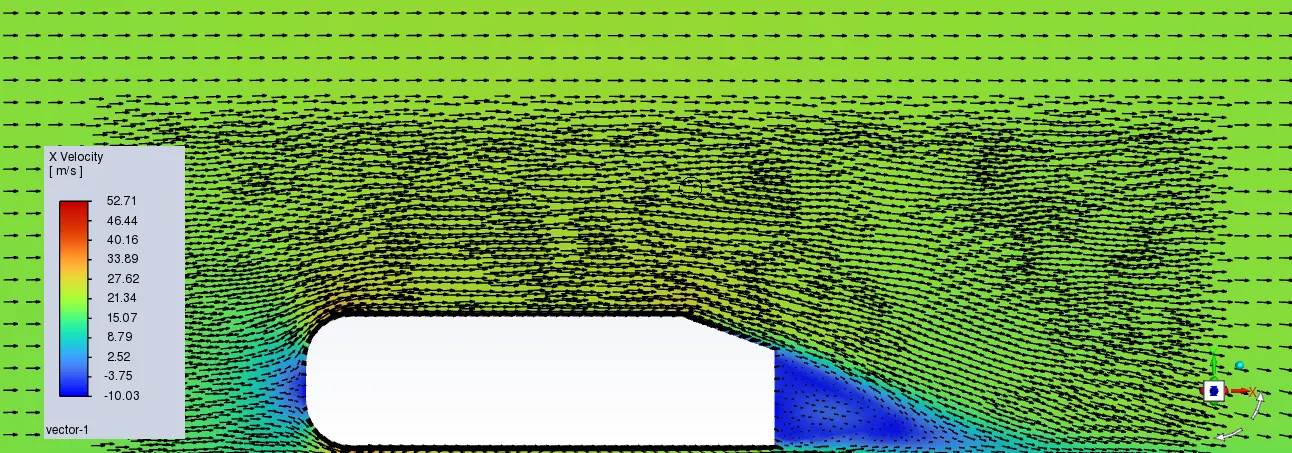 Figure 11b. The vector plot clearly showing the wake region.
In the velocity contour, Figures 11a and 11b show the wake region in blue color behind the Ahmed body. The wake region behind an object like Ahmed’s body experiences negative pressure due to flow separation, turbulence, and vortex formation
Figure 12. Showing the pressure acted on the Ahmed body
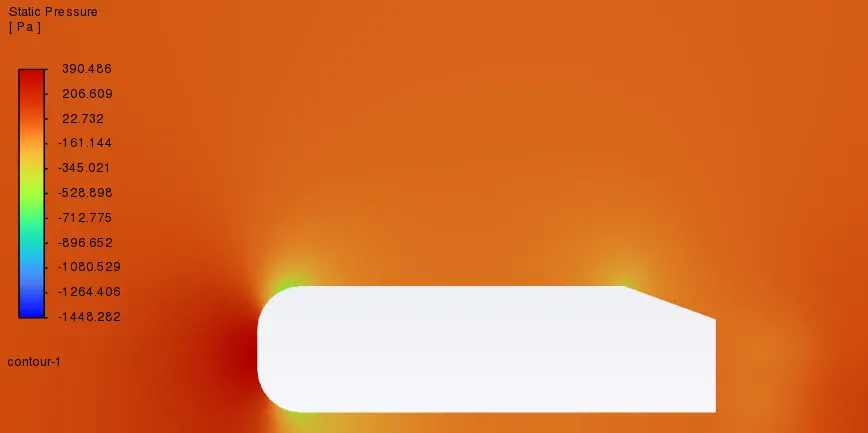
Figure 13. Shows static pressure at the z=0 plane.
Grid independence test
Lift Coefficient | Drag Coefficient | Nodes | Elements | |
Coarser Mesh | 0.2594 | 0.4250 | 34784 | 68800 |
Base Mesh | 0.2311 | 0.355 | 86088 | 151930 |
Finer Mesh | 0.2693 | 0.3250 | 156962 | 545597 |
From this table above, the mesh independence study can be seen as successful. For finer mesh, the Cd was closer to the known value of 0.33.
Reference