Project 1 - Parsing NASA thermodynamic data
FILE PARSING NASA'S THERMODYNAMIC DATA.
AIM
To extract thermodynamic data from NASA’s document to evaluate specific heat (Cp), enthalpy (H), entropy (S) relation with respect to varying temperature and to calculate the molecular weight of each species.
INTRODUCTION
NASA came up with polynomials that can be used to evaluate thermodynamic properties such as Cp, H and S for different temperatures. Here we have a document of the coefficients that are required to evaluate these polynomials for 53 species.
There are 14 co-efficient and three equations to calculate the enthalpy, entropy and specific heats for all the species in the data file. We need to extract the coefficients and apply them on the formulae to find the required thermodynamic properties of each species.
The formulae to find specific heat, enthalpy, entropy are shown below.

Here R is the universal gas constant and T is the temperature
The coefficients vary for both high and low temperature ranges.The first 7 coefficients are meant for higher temperature range and the second 7 coefficients are meant for the lower temperature range .The local temperature range is unique for each individual species, not the global temperature range.
PROCEDURE
1.To write a program to extract the required thermodynamic state properties (Cp, Enthalpy and Entropy) .
- Plot the Cp, Enthalpy and Entropy for the local temperature range (low temperature : high temperature) specific for each species.
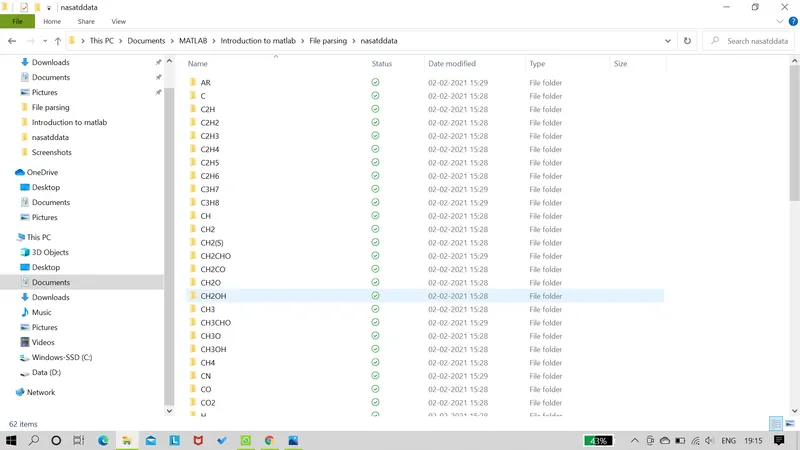
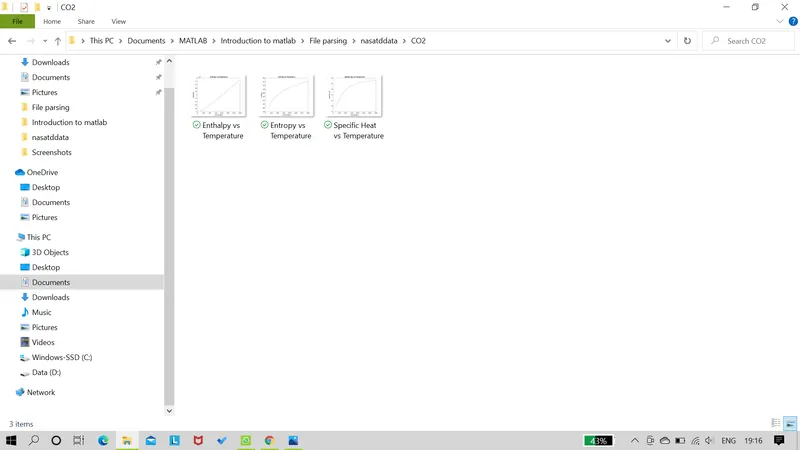
- Save the plots as images with appropriate names and dump them in separate folders for each species with a suitable name. All these should be generated automatically.
- Display the molecular weight of each species in the command window.
DEVELOPING PROGRAM
Data with a repeating format can be extracted by writing a uniform code and a loop. Here we have same pattern for coefficient data for each species. Other unique data has to be parsed manually. Here we create a 'for' loop to parse data. Formulae for Cp, H and S are coded within the main loop so that we can get values for each species. Molecular weight is found by using for each species so the code for finding molecular weight was included within the main 'for loop'.
PROGRAM EXPLANATION
clear all
close all
clc
% Opening THERMO.dat file
f1=fopen('THERMO.dat','r');
%Getting first line
fgetl(f1)
% tline is the name of selected line
tline=fgetl(f1)
% Splitting the string from tline and stored into array A.
A=strsplit(tline,' ')
% Taking numbers (global temperature values) from the string A.
global_low=str2num(A{2});
global_mid=str2num(A{3});
global_high=str2num(A{4});
% Entering to the next line.
fgetl(f1);
fgetl(f1);
fgetl(f1);
% Creating loop to extract data as the data format is same for all the 53
species.
for i=1:53
%Getting into next line
tline1=fgetl(f1);
%Splitting the strings in line
B=strsplit(tline1,' ');
%Species = first character from array B.
Species=B{1};
% All the individual elements are arranged in array Element
Elements=['O','H','C','N','A'];
%Atomic masses arranged in the order of their elements
Atomic_mass=[16,1,12,14,40];
% Finding Molecular weight of each species.
Initial molecular weight is given 0 before iteration.
Mol_wt=0;
Iteration for each 53 species
for k=1:length(Species)
Iteration for each elements of species
for j=1:length(Elements)
Checking the elements in each species, Command ‘strcomp’
compares combination of strings in species with the strings in the
array of elements.
if strcmp(Species(k),Elements(j))
For every matching string corresponding atomic mass is added.
Mol_wt=Mol_wt+Atomic_mass(j);
The j is invalid after the loop ends so p is used instead.
p=j;
end
end
The multiples of string denoted in numbers are stored in array n.
n=str2double(Species(k));
If the number of multiples of string are greater than 1 then product of
atomic mass with number of multiples is added to the molecular weight.
if (n>1)
Mol_wt=Mol_wt+(Atomic_mass(p)*(n-1));
end
end
Printing ‘the molecular wt of the species ‘string’ = ‘float’'. String is the species data type and float is the Mol_wt data type.
m=fprintf('the molecular wt of the species %s =%f \n',Species,Mol_wt);
%Extracting local temperature from file.
local_low_temperature=str2num(B{length(B)-3});
local_mid_temperature=str2num(B{length(B)-1});
local_high_temperature=str2num(B{length(B)-2});
%Getting next line
tline2=fgetl(f1);
%Finding the position of string E to differentiate coefficients.
C=findstr(tline2,'E');
%Position of string E is used to get number values of coefficients
str2num is used to convert string to number within the specified position
C1=str2num(tline2(1:C(1)+3));
C2=str2num(tline2(C(1)+4:C(2)+3));
C3=str2num(tline2(C(2)+4:C(3)+3));
C4=str2num(tline2(C(3)+4:C(4)+3));
C5=str2num(tline2(C(4)+4:C(5)+3));
%Getting into next line
tline3=fgetl(f1);
%Finding the position of string E to differentiate coefficients.
C=findstr(tline3,'E');
C6=str2num(tline3(1:C(1)+3));
C7=str2num(tline3(C(1)+4:C(2)+3));
C8=str2num(tline3(C(2)+4:C(3)+3));
C9=str2num(tline3(C(3)+4:C(4)+3));
C10=str2num(tline3(C(4)+4:C(5)+3));
tline3=fgetl(f1);
%Finding the position of string E to differentiate coefficients.
C=findstr(tline3,'E');
C11=str2num(tline3(1:C(1)+3));
C12=str2num(tline3(C(1)+4:C(2)+3));
C13=str2num(tline3(C(2)+4:C(3)+3));
C14=str2num(tline3(C(3)+4:C(4)+3));
%Creating temperature array for both local temperature ranges.
T=linspace(local_low_temperature,local_high_temperature,48);
%Making a loop with number of iteration as length of temperature values
for j=1:length(T)
R=8.31446261815324;
%Finding Cp, H, and S for local low temperature
if T<1000
Cp=R.*(C8+C9*T+C10*T.^2+C11*T.^3+C12*T.^4);
H=R.*T.*(C8+(C9*T)./2+(C10*T.^2)./3+(C12*T.^4)./5+C13./T);
S=(C8*log(T)+C9*T+(C10*T.^2)./2+(C11*T.^3)./3+(C12*T.^4)./4+C14).*R;
else
%Finding Cp, H, and S for local high temperature
Cp=R.*(C1+C2*T+C3*T.^2+C4*T.^3+C5*T.^4);
H=R.*T.*(C1+(C2*T)./2+(C3*T.^2)./3+(C4*T.^3)./4+(C5*T.^4)./5+C6./T);
S=(C1*log(T)+C2*T+(C3*T.^2)./2+(C4*T.^3)./3+(C5*T.^4)./4+C7).*R;
end
end
%Making directory of species
mkdir(Species)
%Creating folder in the name of species
cd(Species)
%Plotting graphs with extracted data and saving them into respective folders.
figure(1)
plot(T,Cp)
title ('Specific Heat vs Temperature')
xlabel('temperature')
ylabel('specific_heat')
saveas(1,'Specific Heat vs Temperature.png')
figure(2)
plot(T,H)
title ('Enthalpy vs Temperature')
xlabel('temperature')
ylabel('enthalpy')
saveas(2,'Enthalpy vs Temperature.png')
figure(3)
plot(T,S)
title ('Entropy vs Temperature')
xlabel('temperature')
ylabel('entropy')
saveas(3,'Entropy vs Temperature.png')
cd ..
end
PROGRAM
clear all
close all
clc
% Opening THERMO.dat file
f1=fopen('THERMO.dat','r');
%Getting first line
fgetl(f1)
% tline is the name of selected line
tline=fgetl(f1)
% Splitting the string from tline and stored into array A.
A=strsplit(tline,' ')
% Taking numbers (global temperature values) from the string A.
global_low=str2num(A{2});
global_mid=str2num(A{3});
global_high=str2num(A{4});
% Entering to the next line.
fgetl(f1);
fgetl(f1);
fgetl(f1);
% Creating loop to extract data as the data format is same for all the 53
% species.
for i=1:53
    %Getting into next line
     tline1=fgetl(f1);
    %Splitting the strings in line
     B=strsplit(tline1,' ');
    %Species = first character from B array.
     Species=B{1};
    % All the individual elements are arranged in array Element
     Elements=['O','H','C','N','A'];
    %Atomic masses arranged in the order of their elements
     Atomic_mass=[16,1,12,14,40];
% Finding Molecular weight of each species.
     Mol_wt=0;
  for k=1:length(Species)
     for j=1:length(Elements)
        if strcmp(Species(k),Elements(j))
            Mol_wt=Mol_wt+Atomic_mass(j);
            p=j;
        end
     end
  n=str2double(Species(k));
  if (n>1)
        Mol_wt=Mol_wt+(Atomic_mass(p)*(n-1));
  end

  end
m=fprintf('the molecular wt of the species %s =%f \n',Species,Mol_wt);

%Extracting local temperature from file.
local_low_temperature=str2num(B{length(B)-3});
local_mid_temperature=str2num(B{length(B)-1});
local_high_temperature=str2num(B{length(B)-2});
%Getting next line
tline2=fgetl(f1);
%Finding the position of string E to differentiate coefficients.
C=findstr(tline2,'E');
%Position of string E is used to get number values of coefficients
%str2num is used to convert string to number within the specified position
C1=str2num(tline2(1:C(1)+3));
C2=str2num(tline2(C(1)+4:C(2)+3));
C3=str2num(tline2(C(2)+4:C(3)+3));
C4=str2num(tline2(C(3)+4:C(4)+3));
C5=str2num(tline2(C(4)+4:C(5)+3));
%Getting into next line
tline3=fgetl(f1);
%Finding the position of string E to differentiate coefficients.
C=findstr(tline3,'E');
C6=str2num(tline3(1:C(1)+3));
C7=str2num(tline3(C(1)+4:C(2)+3));
C8=str2num(tline3(C(2)+4:C(3)+3));
C9=str2num(tline3(C(3)+4:C(4)+3));
C10=str2num(tline3(C(4)+4:C(5)+3));
tline3=fgetl(f1);
%Finding the position of string E to differentiate coefficients.
C=findstr(tline3,'E');
C11=str2num(tline3(1:C(1)+3));
C12=str2num(tline3(C(1)+4:C(2)+3));
C13=str2num(tline3(C(2)+4:C(3)+3));
C14=str2num(tline3(C(3)+4:C(4)+3));
%Creating temperature array for both local temperature ranges.
T=linspace(local_low_temperature,local_high_temperature,48);
%Making a loop with number of iteration as length of temperature values
for j=1:length(T)
    R=8.31446261815324;
    %Finding Cp, H, and S for local low temperature
    if T<1000
    Cp=R.*(C8+C9*T+C10*T.^2+C11*T.^3+C12*T.^4);
    H=R.*T.*(C8+(C9*T)./2+(C10*T.^2)./3+(C12*T.^4)./5+C13./T);
    S=(C8*log(T)+C9*T+(C10*T.^2)./2+(C11*T.^3)./3+(C12*T.^4)./4+C14).*R;

    else
         %Finding Cp, H, and S for local high temperature
    Cp=R.*(C1+C2*T+C3*T.^2+C4*T.^3+C5*T.^4);
    H=R.*T.*(C1+(C2*T)./2+(C3*T.^2)./3+(C4*T.^3)./4+(C5*T.^4)./5+C6./T);
    S=(C1*log(T)+C2*T+(C3*T.^2)./2+(C4*T.^3)./3+(C5*T.^4)./4+C7).*R;

    end
end
%Making directory of species
 mkdir(Species)
%Creating folder in the name of species
 cd(Species)
%Plotting graphs with extracted data and saving them into respective folders.
 figure(1)
 plot(T,Cp)
 title ('Specific Heat vs Temperature')
 xlabel('temperature')
 ylabel('specific_heat')
 saveas(1,'Specific Heat vs Temperature.png')

 figure(2)
 plot(T,H)
 title ('Enthalpy vs Temperature')
 xlabel('temperature')
 ylabel('enthalpy')
 saveas(2,'Enthalpy vs Temperature.png')

 figure(3)
 plot(T,S)
 title ('Entropy vs Temperature')
 xlabel('temperature')
 ylabel('entropy')
 saveas(3,'Entropy vs Temperature.png')

 cd ..

end
RESULT
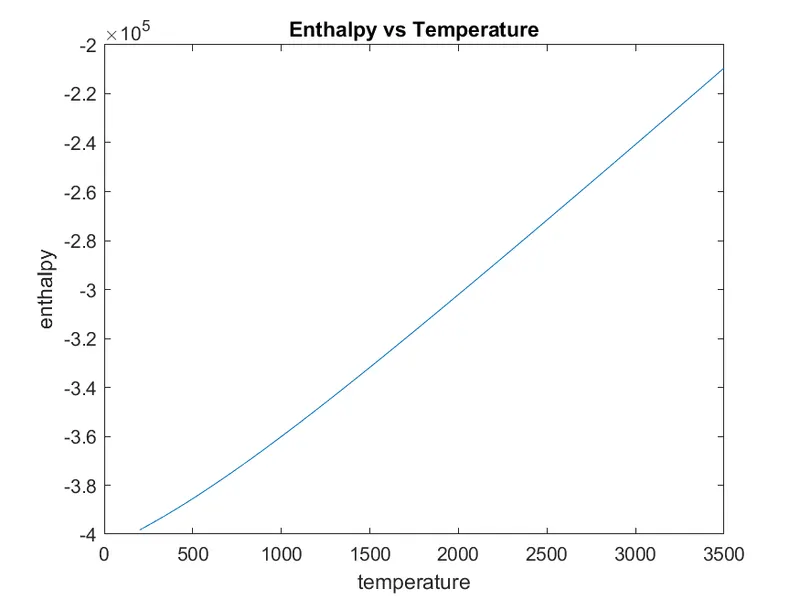
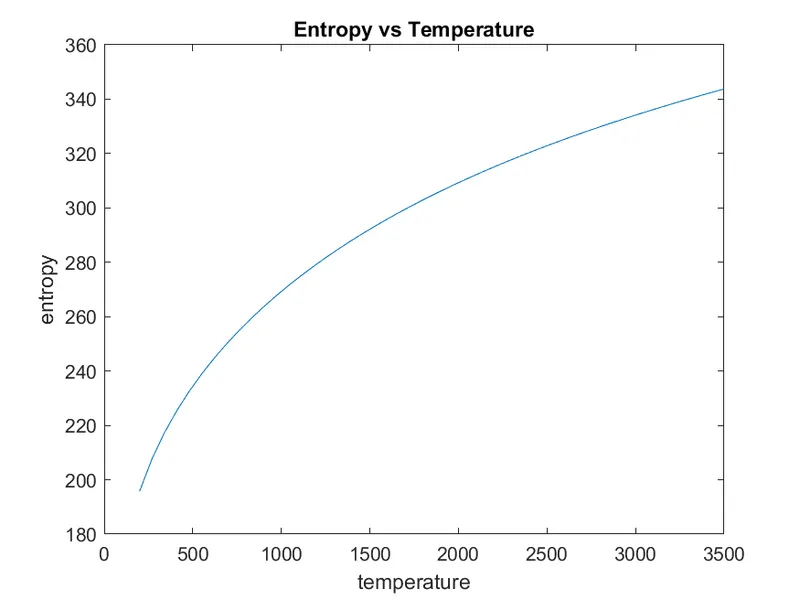
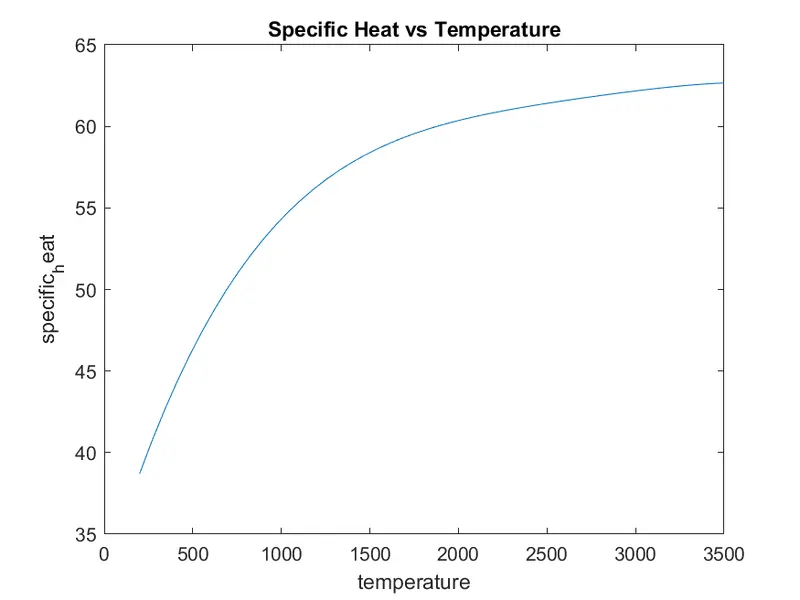
Plotted graphs,
- Relation of Cp, H and S versus T of species N2.
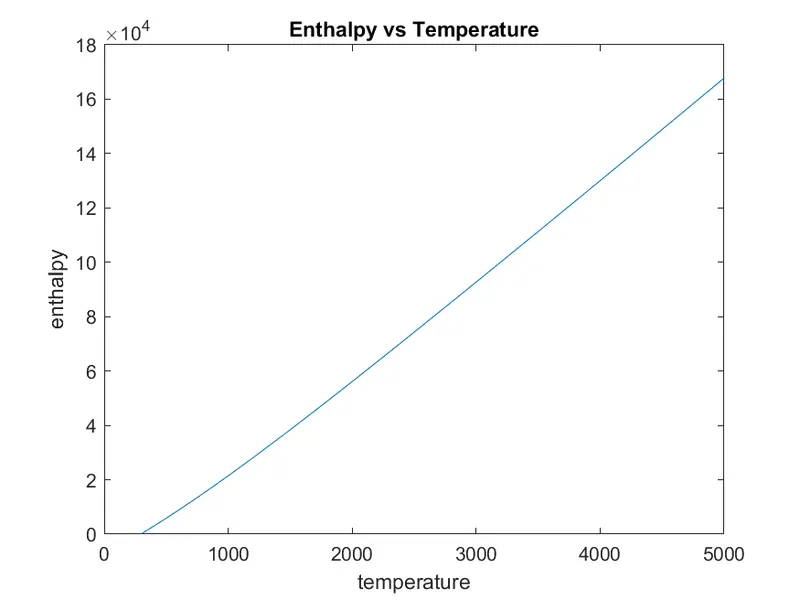
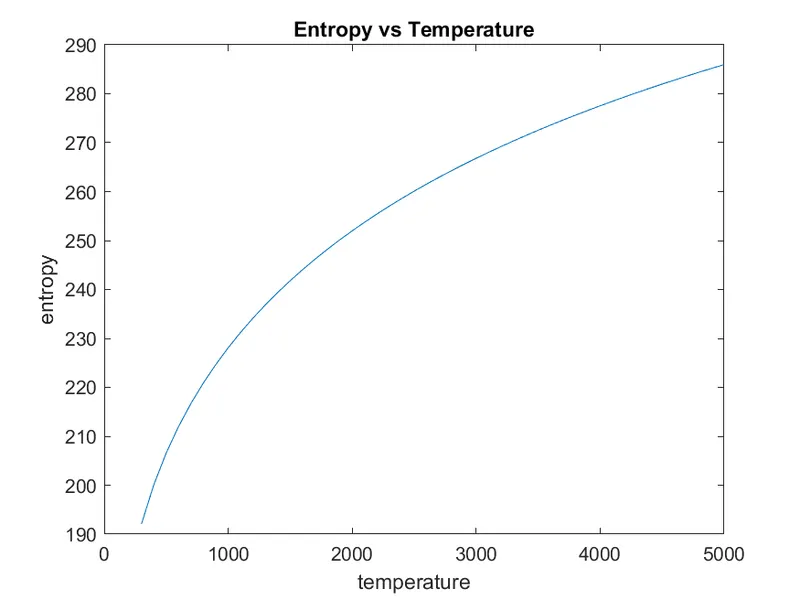
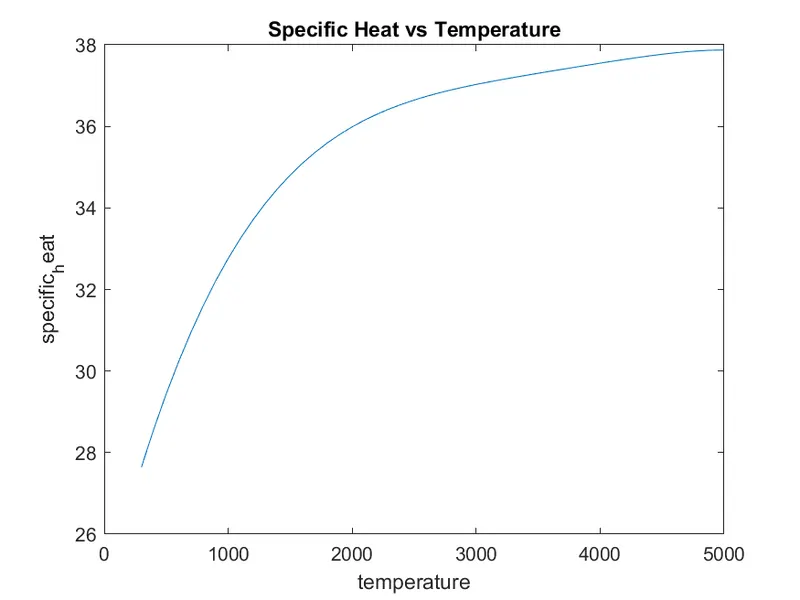
- Relation of Cp, H and S versus T of species O2.
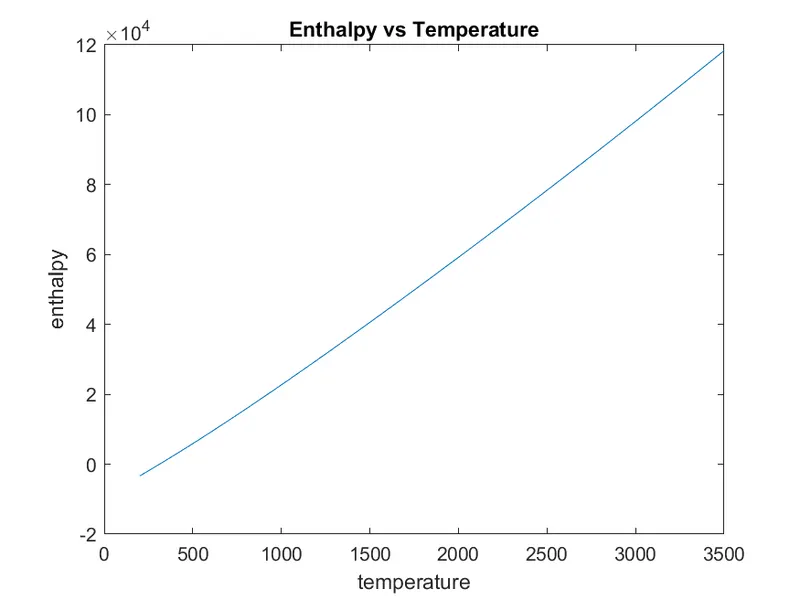
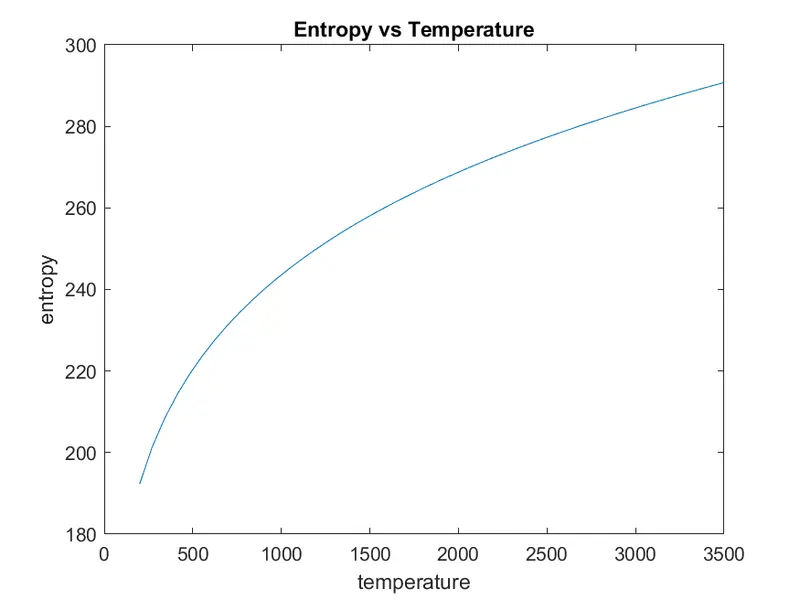
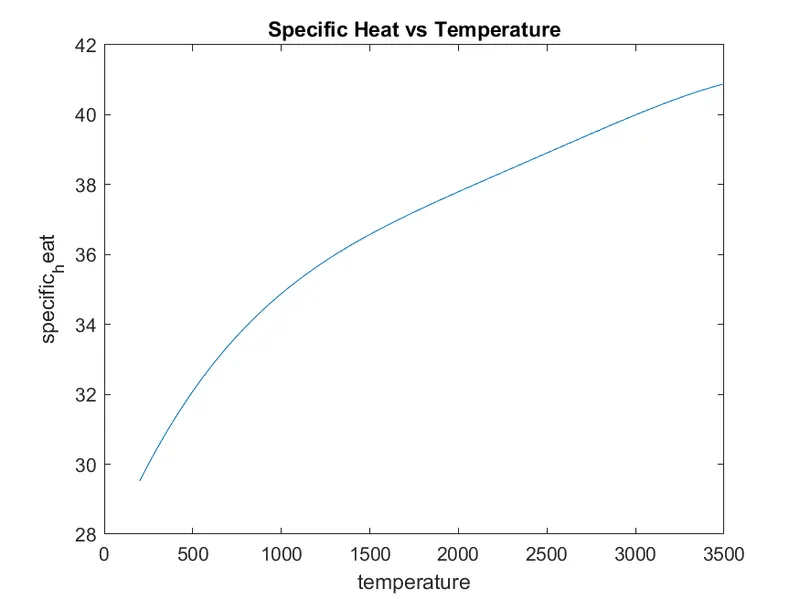
- Relation of Cp, H and S versus T of species CO2.
- Screenshot of files saved in their respective folders.
ERROR
Error faced while programming and it’s solution.
1:Forgot to use single quotes while labeling.
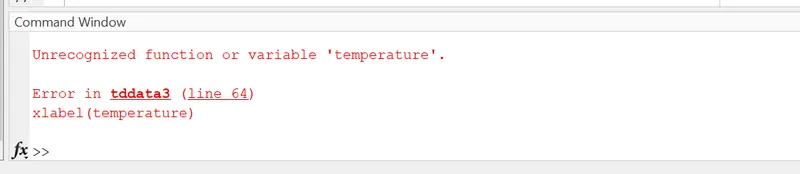
Sloution: Used single quotes inside the paranthesis.
2:Failed to specify data types and identifier in 'fprintf' command.
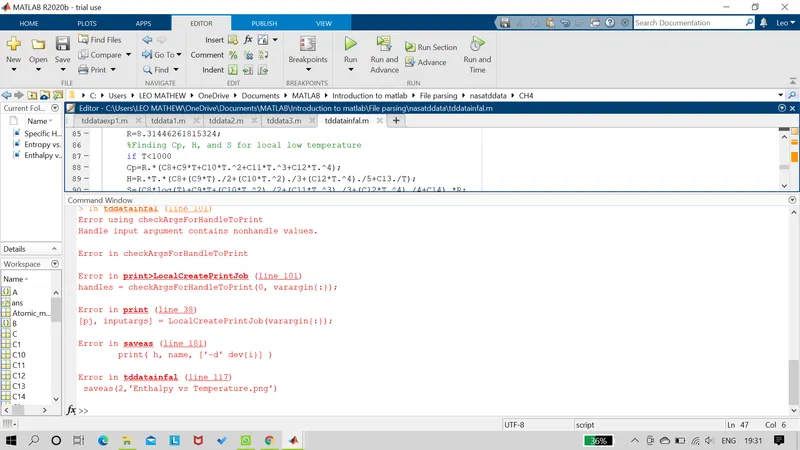
Solution : Data types and identifier specified in the command.