Week 3 - External flow simulation over an Ahmed body.
AIM: To conduct air flow simulation over a ahmed body inside a wind tunnel to understand the real life applications of vehicle. To understand about wake region, to understand about wake region.
IMPORTANCE OF AHMED BODY:
Ahmed body is perfect model to understand the basic concept of air flow, wake region formation, point of separation, drag & lift significance. which helps us to validate our CFD code.
Since it is a base model we can study more complex models in real life like cars etc..,
we can understand how much refining can help us to get best results.
Reason for negative pressure in wake region:
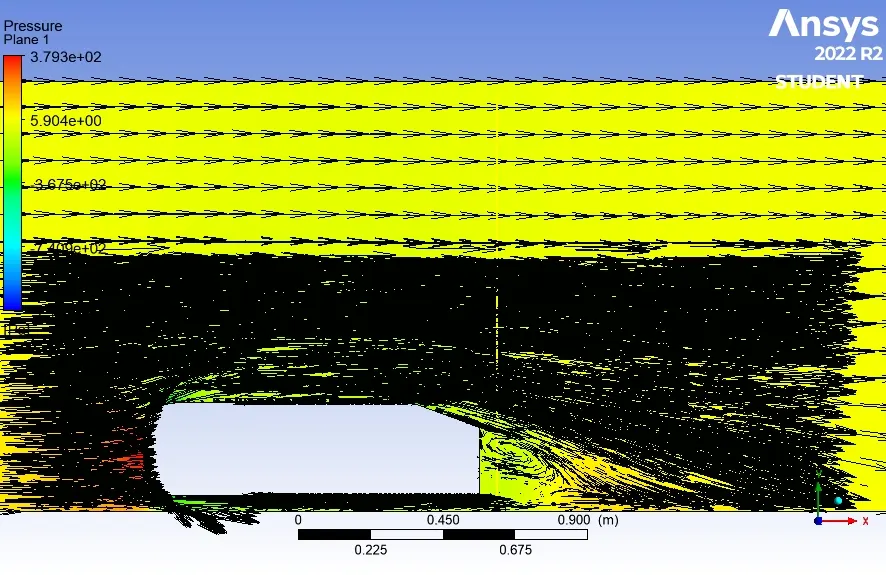
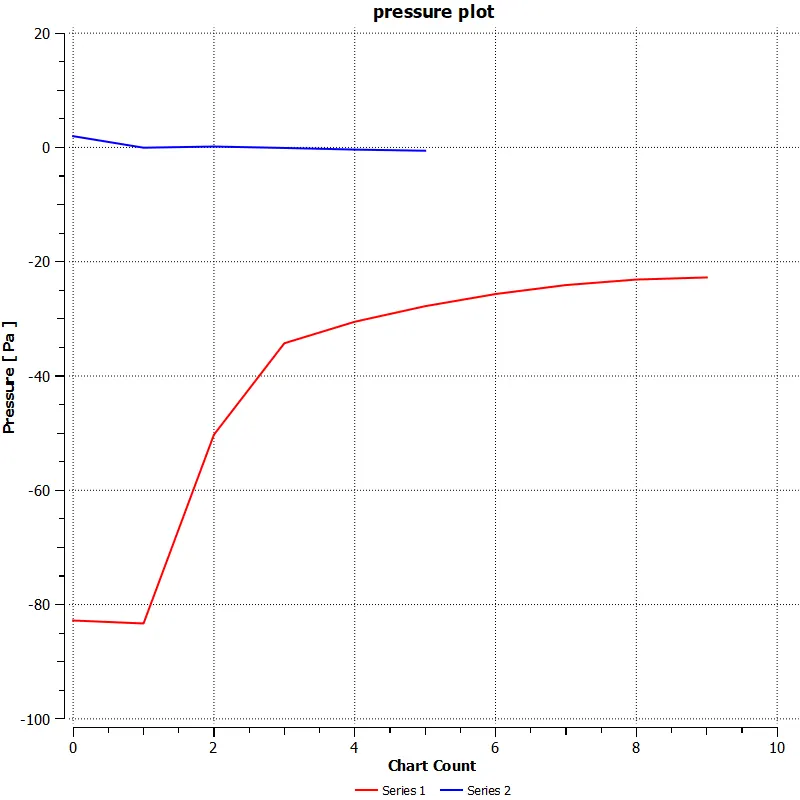
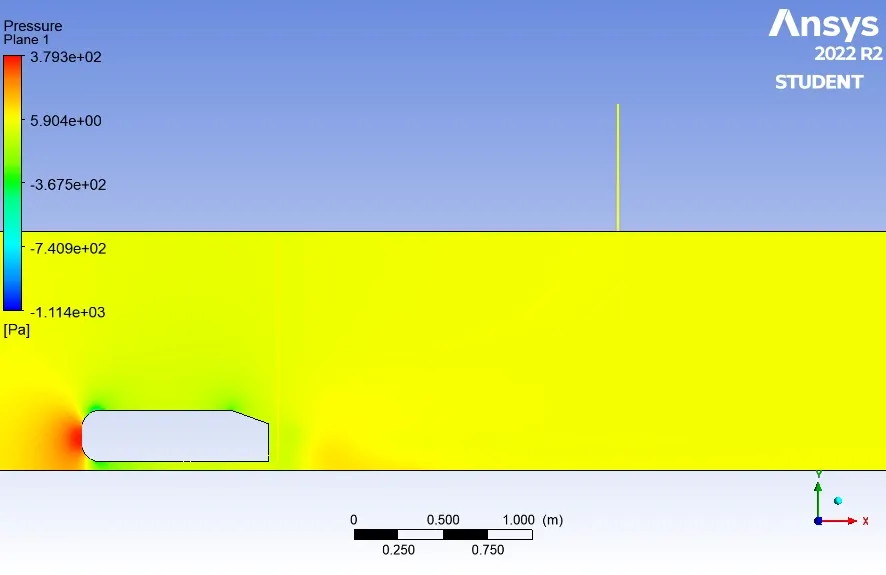
Since there is a flow separation at the back side region of model which results in pressure drag formation. this results in slight vaccum formation. hence there is low pressure in wake region.
This phenomenon can be reduced by minimized by reshaping the body.
Significance of point of separation:
When any fluid, gas or liquid flows a over a body the flow keeps moving till the surface ends. but when the surface ends it results in pressure drag.This point where air starts to form vortex's is called as point of separation.
This phenomenon is widely observed in objects moving against any flow. for example in a aerplane wings, back side of a car.
This phenomenon can be reduced by altering the shape of model, giving it a aerodynamic style.
INTRODUCTION:
Given model is called as Ahmed body which is best model to understand the basics of air flow, drag, lift, wake region etc.
Ahmed body is considerd as real life application similar to car. Results of above can be used to validate the CFD code. since we can judge its results easily.
THEORY:
Given model is considerd similar to a car with a round shape in front and slant slope similar to car. which provides us an opportunity to study the low pressure formation at wake region.
By considering the a wind tunnel around the given model we can pass air flow with the speed of 25m/s. By changing different parameters of meshing we get different results of drag and lift.
Procedure to solve the problem:
- Given model is solved in 3 different mesh refining stage.
- An extra enclosure is added to refine the mesh.
- First the model is meshed with normal, then stage 1 refining and stage 2 refining to find the difference in results in drag and lift in each condition.
Normal meshing:
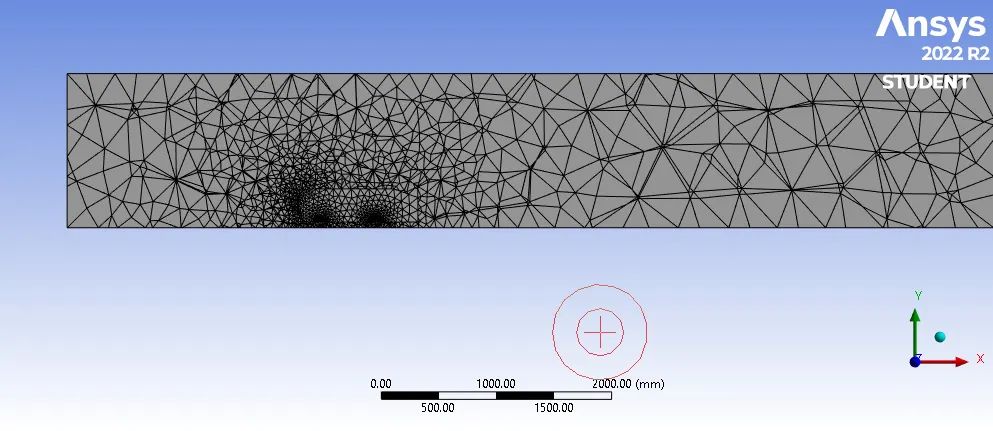
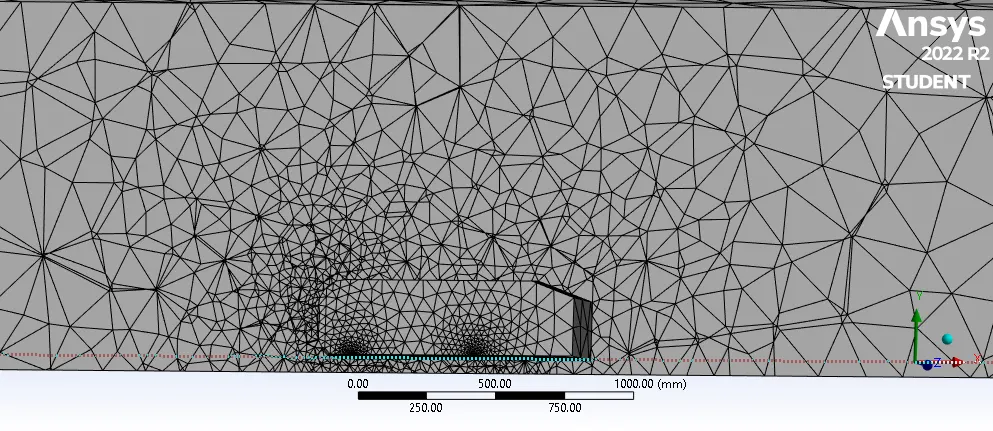
Cell Count : 84073
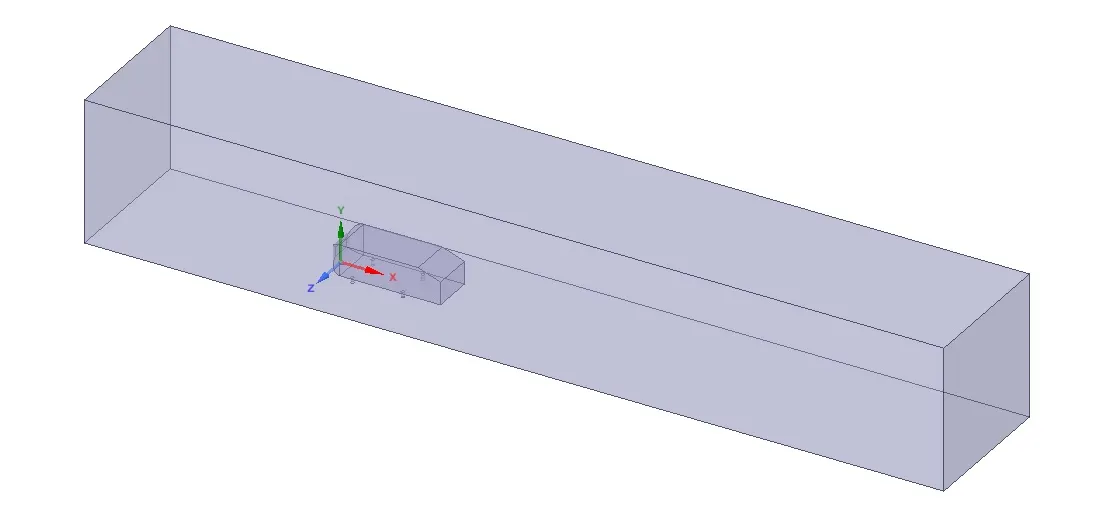
- Given model is imported into spaceclaim the prepared by generating a enclosure around the ahmed body.
- Then body is imported to Meshing interface where its surfaces are named like inlet, outlet, symmetry & car wall. and mesh is generated.
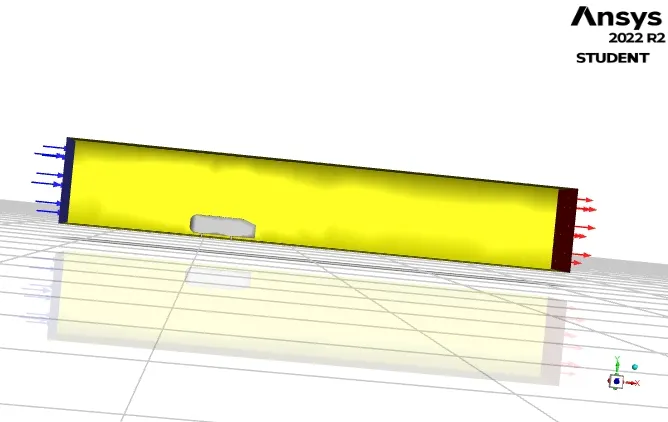
- After finalizing mesh, model is ready for solving in ANSYS Fluent. model is opened in fluent and assigned with reference values, boundry conditions, required air speed of 25m/s. etc.
- Inorder to get some plots and results setting up different definations at cut-z-plane. like drag, lift, velocity plot, pressure plots, scaled residuals.etc.,
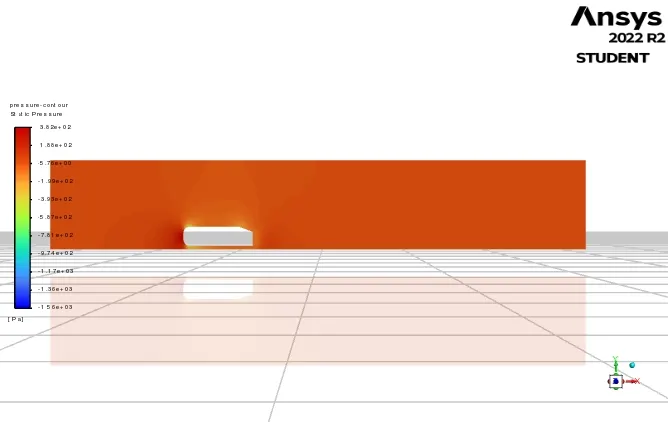
Pressure contour:
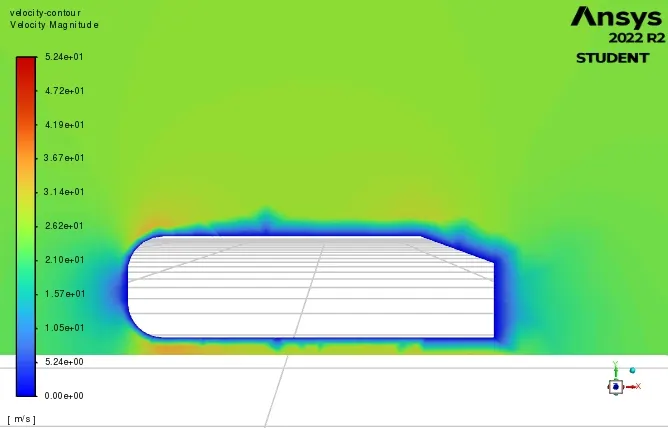
Velocity contour:
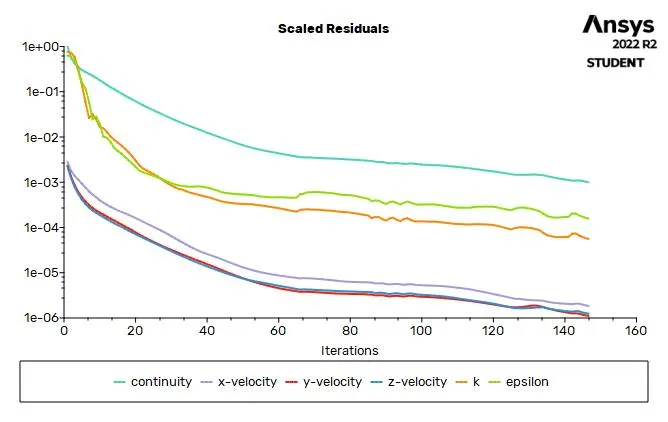
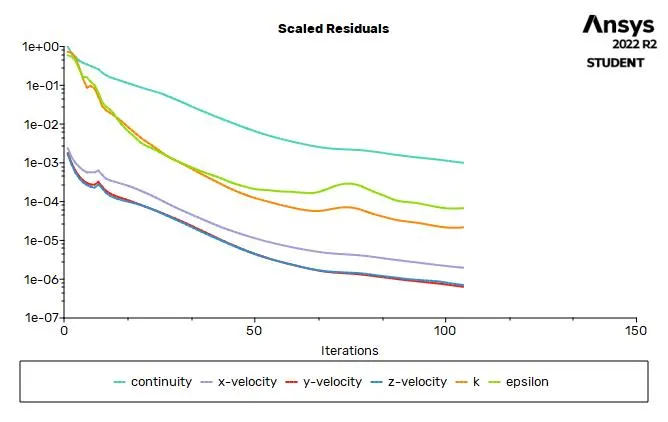
Scaled residuals:
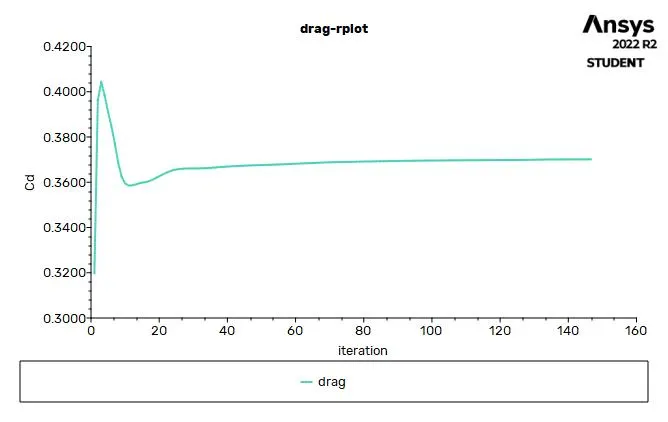
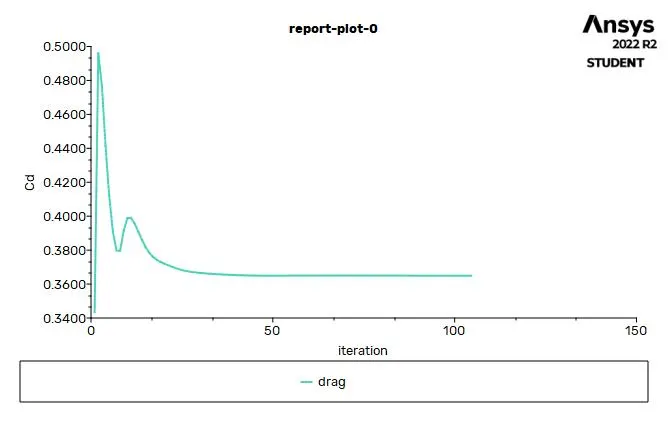
Drag plot:
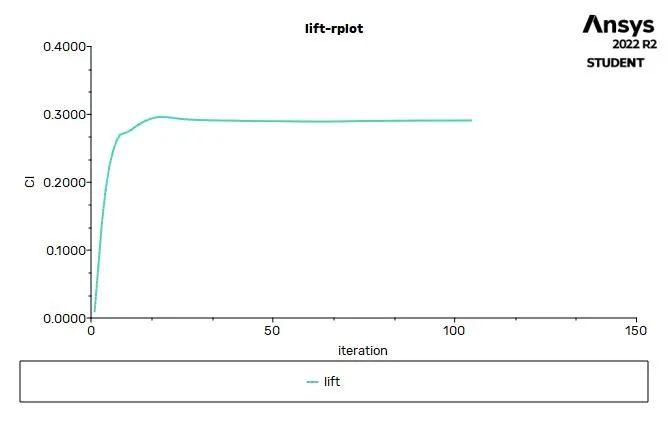
Lift plot:
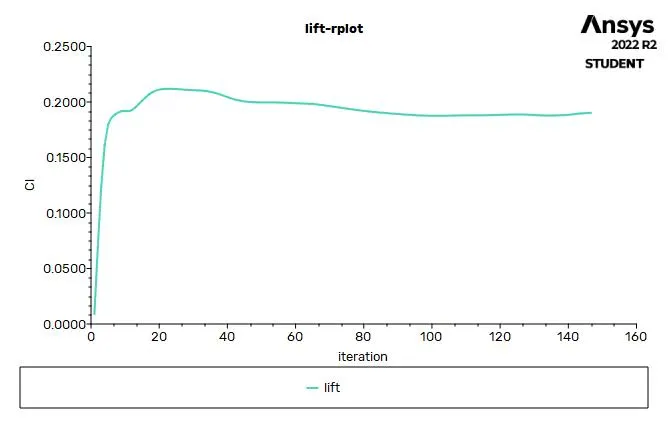
- After completing the solving in fluent and getting plots for drag and lift. next moving towards the CFD post to observe the results.
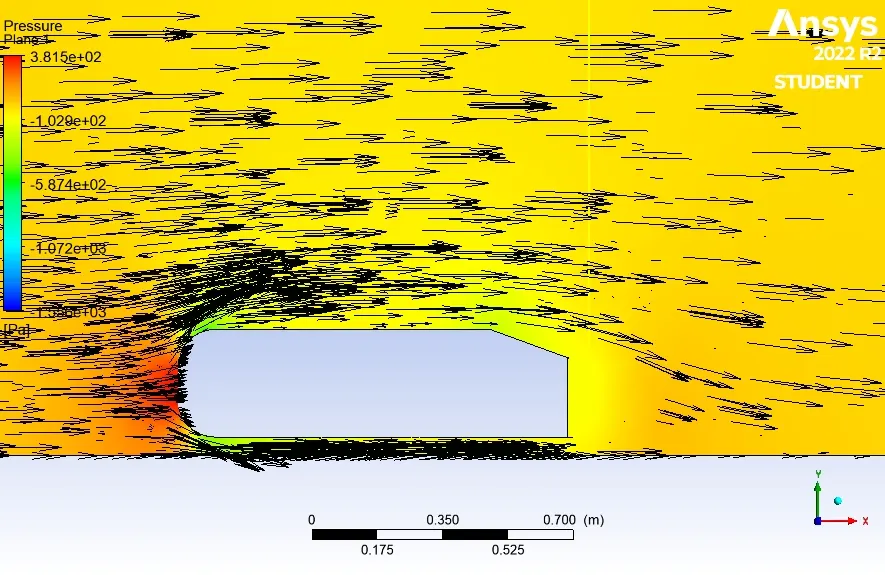
Vector Plot:
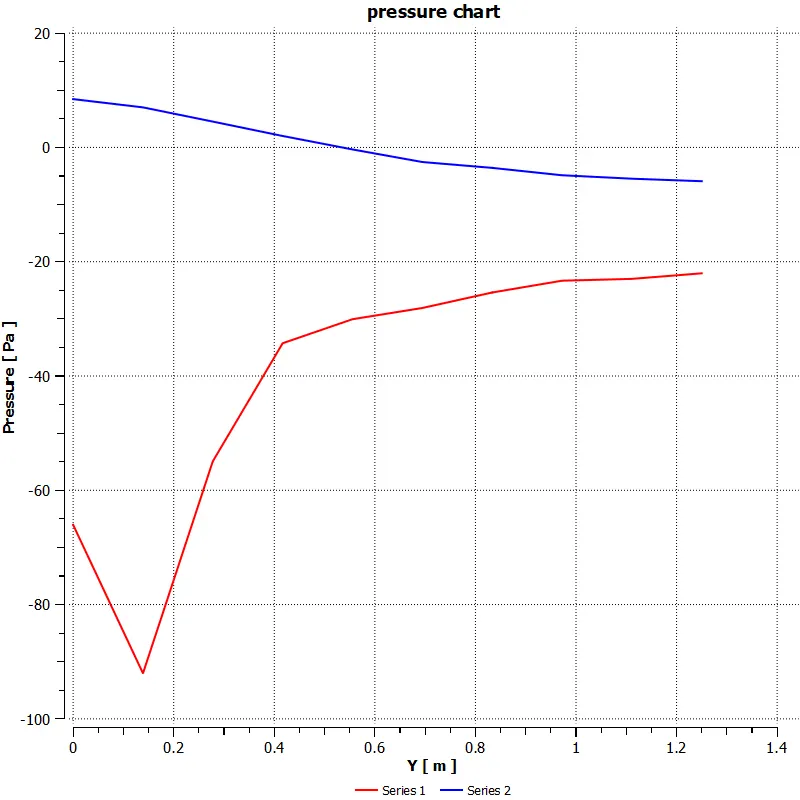
Pressure plot at line 1 and line 2:
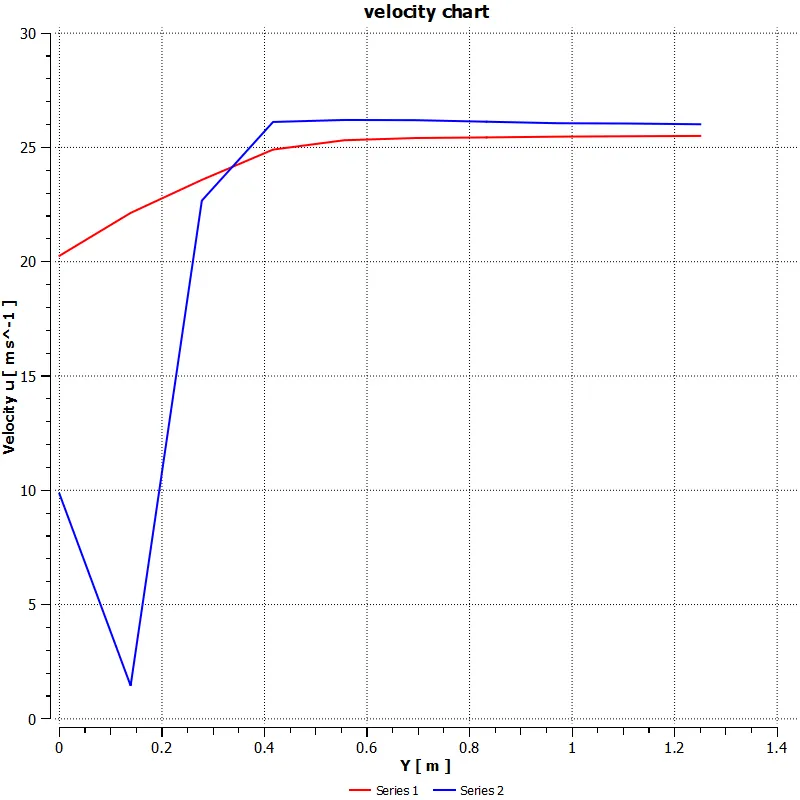
Velocity plot at line 1 and line 2:
Results:
- Coefficient of drag : 0.37012566
- Coefficient of lift : 0.19036117
Refined meshing condition 1:
Cell count: 176002
- Similar to above procedure we import the model to space claim
- We do an extra enclosure around the model to refine the meshing around the model.
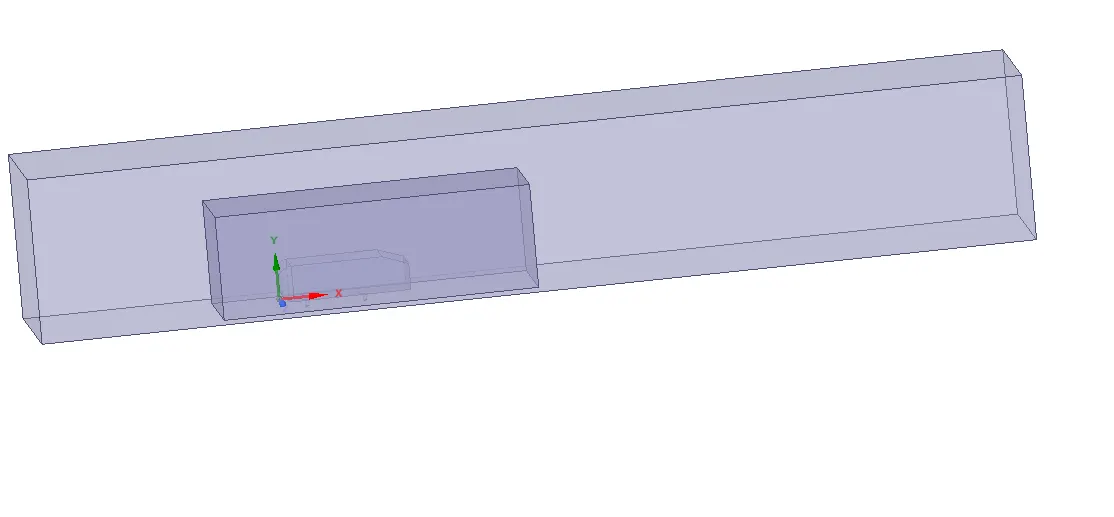
Meshing: 100mm
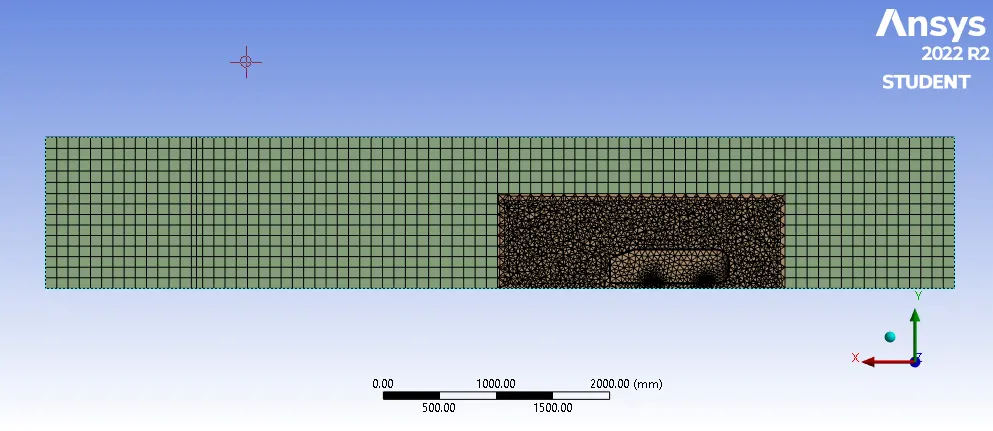
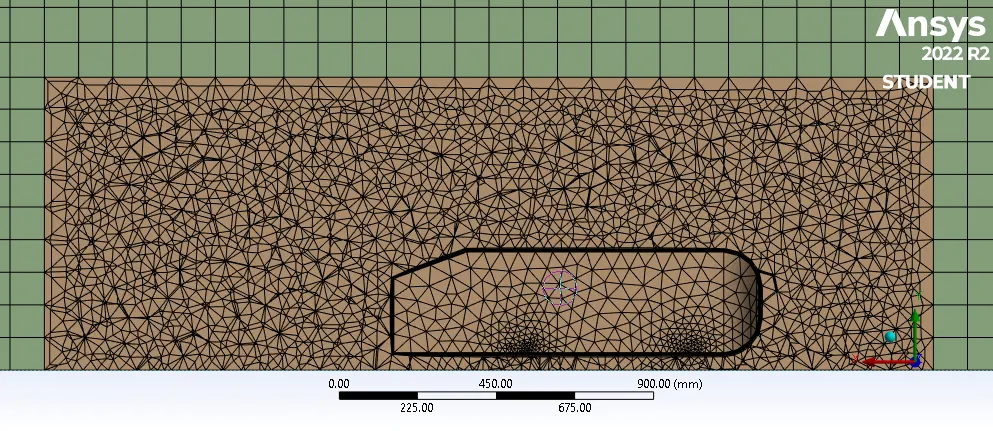
- After meshing we start solving.
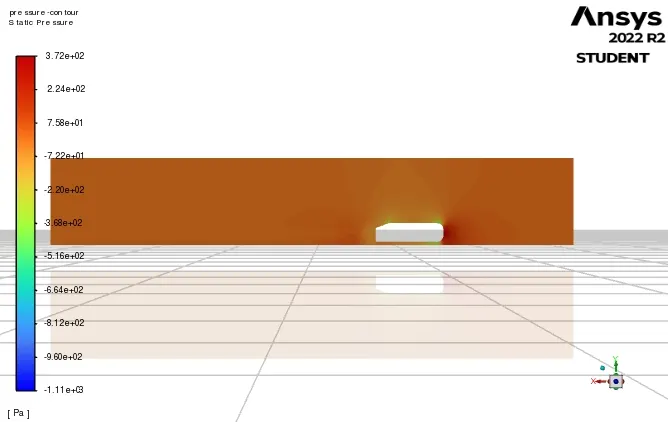
Pressure contour:
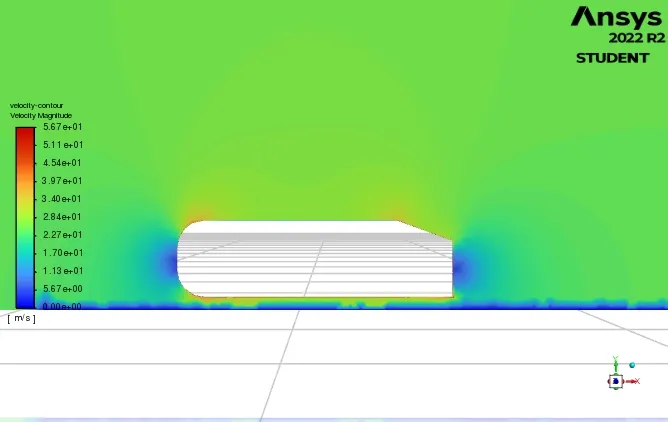
Velocity contour:
Scaled residual:
Drag plot:
Lift plot:
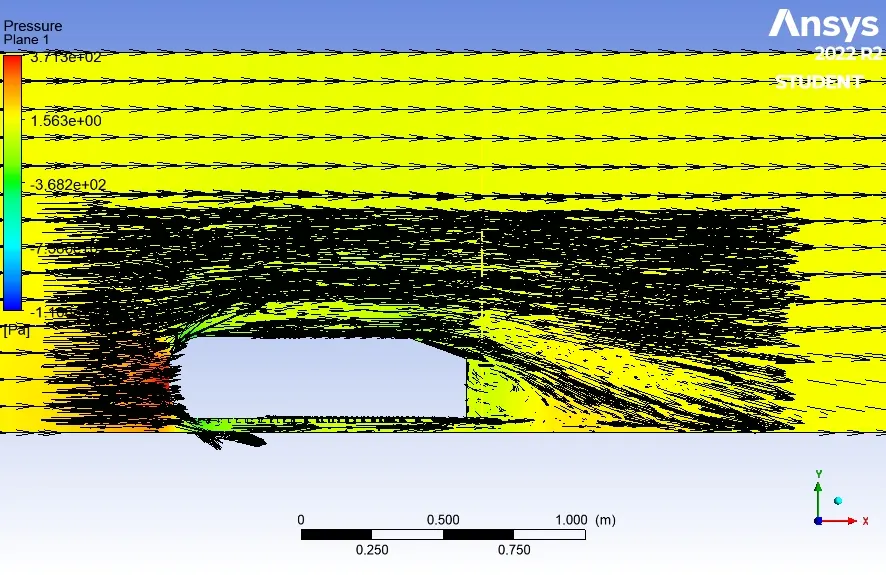
Vector plot:
 .
.
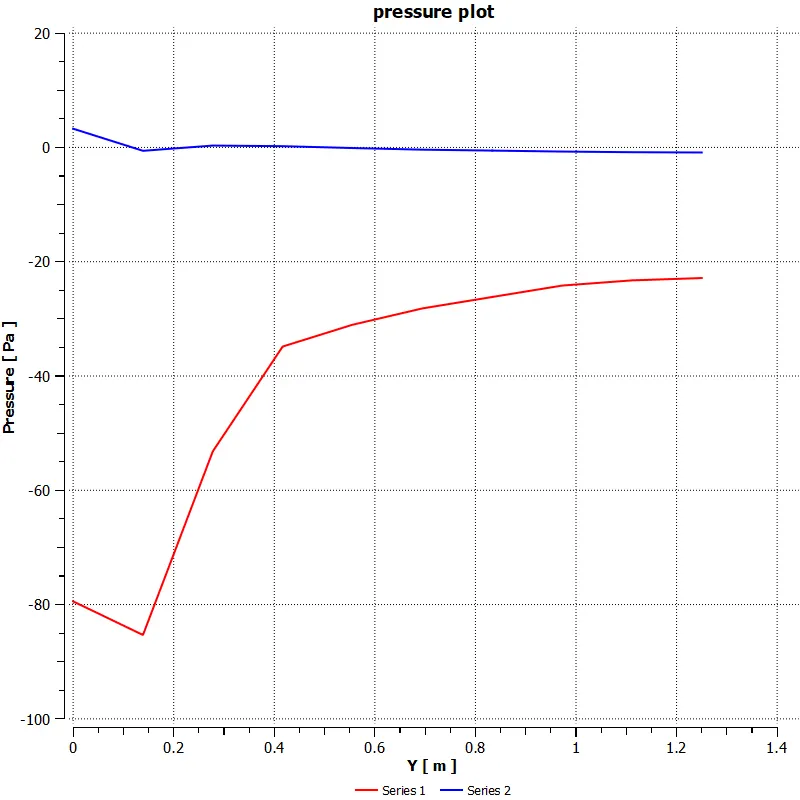
Pressure plot:
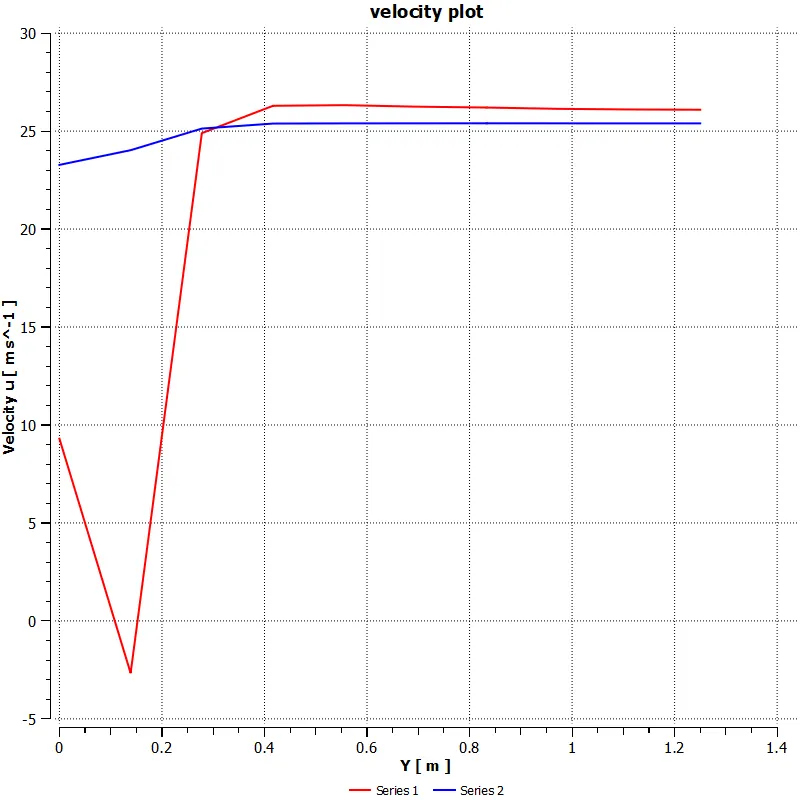
Velocity plot:
Results:
- Coefficient of drag : 0.36489657
- Coefficient of lift : 0.29101629
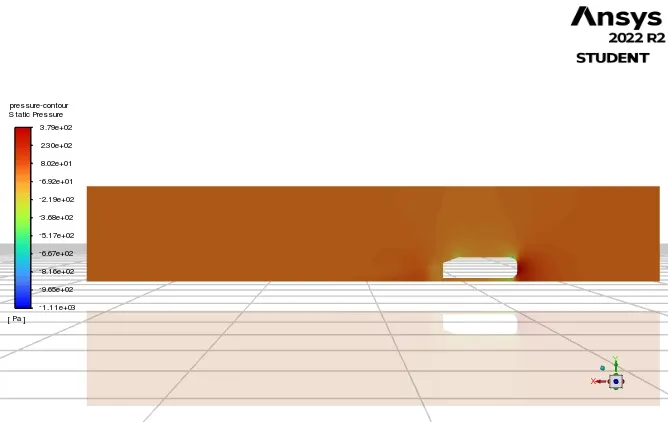
We can observe in above pressure plots that wake region has low pressure as compared with rest of area.
Refined meshing condition 2:
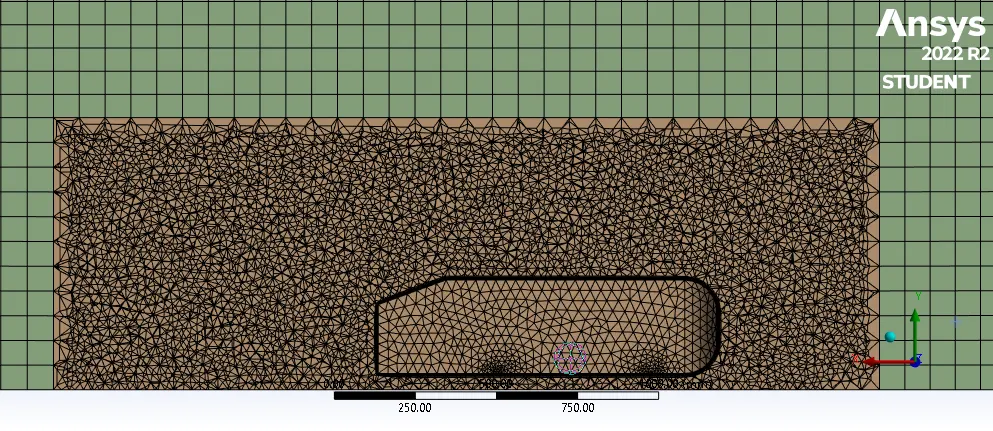
Cell count : 377563
- Following similar steps as of above solving method only refined the mesh around the car wall to get below results.
Meshing:
Pressure contour:
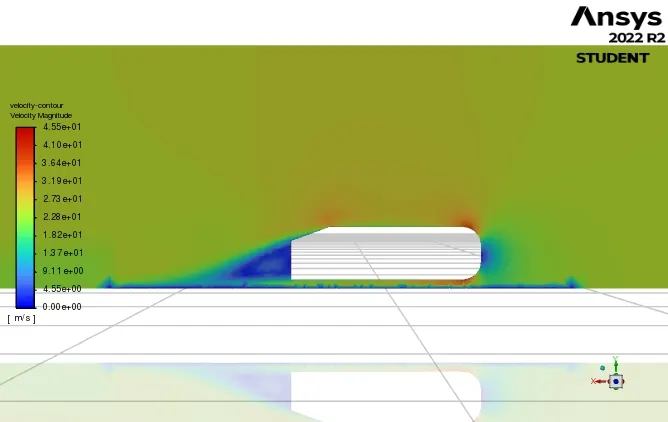
Velocity contour:
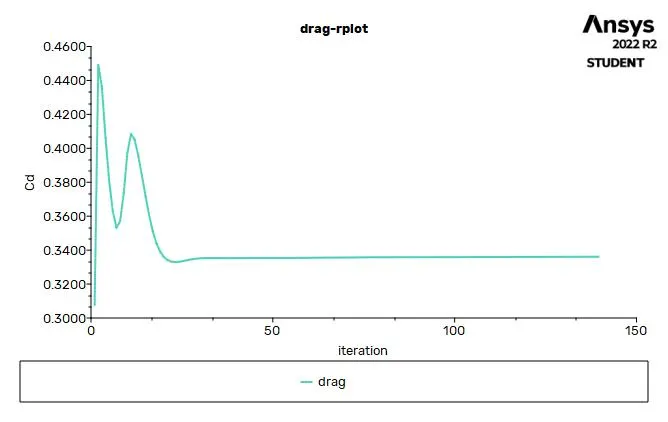
Drag plot:
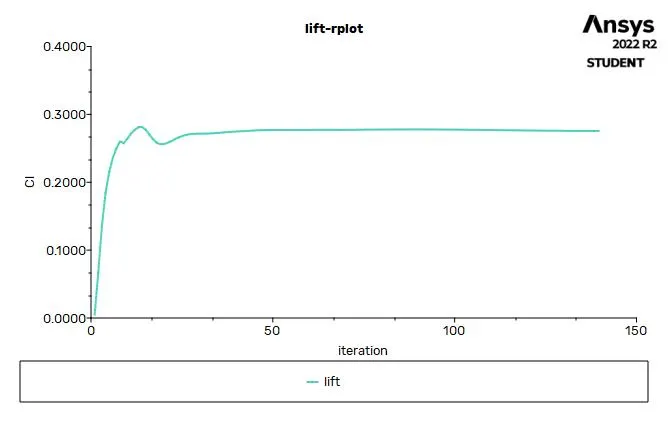
Lift plot:
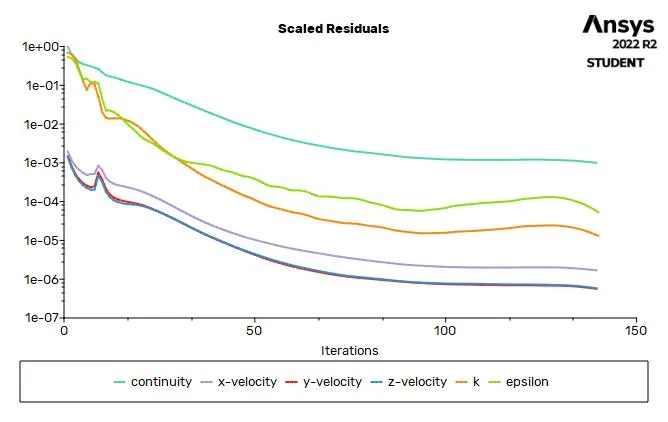
Scaled residuals:
Vector plot:
Pressure plot:
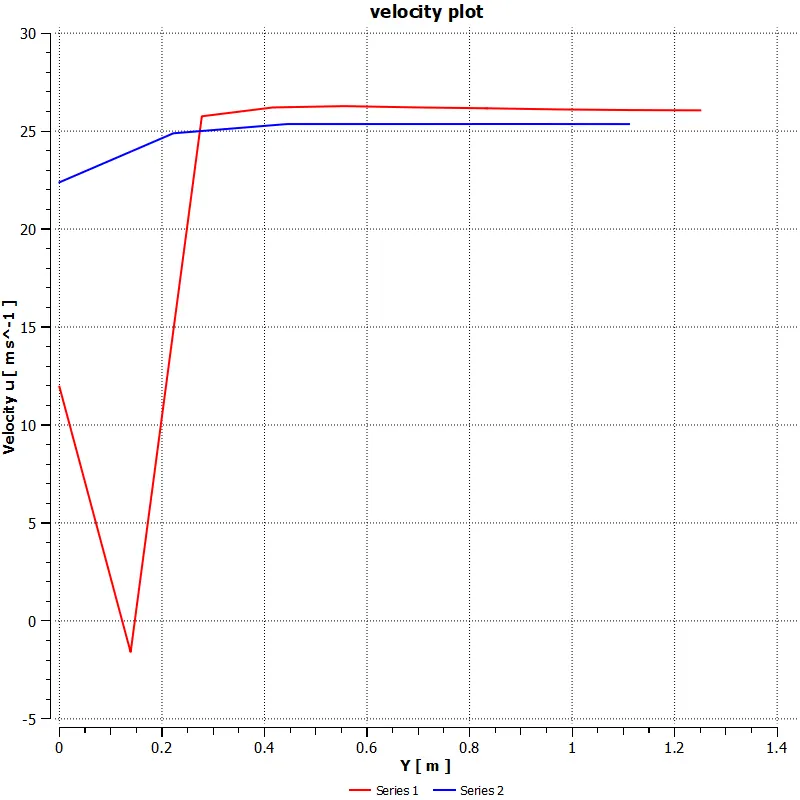
Velocity plot:
Results:
- Coefficient of drag : 0.27552134
- Coefficient of lift : 0.33610934
From above results we can understand that after refining the mesh we get less drag.
Overall Results:
By comparing all three trials taken, the one with higher mesh count and refined mesh gets good results.
Trial 1:
- Coefficient of drag : 0.37012566
- Coefficient of lift : 0.19036117
Trial 2:
- Coefficient of drag : 0.36489657
- Coefficient of lift : 0.29101629
Trial 3:
- Coefficient of drag : 0.27552134
- Coefficient of lift : 0.33610934
Conclusion:
By observing red series lines in above pressure plots. these lines represents the pressure in wake region. we observe that negative pressure decreases as we refine the mesh.
also there is drop in drag coefficient as mentioned in results.
Thanks and regards
Kaushik kumar.