Week 3 - External flow simulation over an Ahmed body.
Aim: Simulate the flow over the Ahmed body and use air as the working fluid with velocity of 25 m/s.
Introduction:
1. Describe Ahmed's body and its importance.
The Ahmed body represents a simplified, ground vehicle geometry of a bluff body type. Its shape is simple enough to allow for accurate flow simulation but retains some important practical features relevant to automobile bodies. This model describes how to calculate the turbulent flow field around a simple car-like geometry.
The airflow around the Ahmed body captures the essential flow features around an automobile and was first defined and characterized in the experimental work of Ahmed. Although it has a very simple shape, the Ahmed body allows us to capture characteristic features that are relevant to bodies in the automobile industry.
ANSYS is a general-purpose FEA and CFD simulation software. It gives a numerical prediction of the behaviour of a system. These numerical predictions need to be validated by experimental data.
This model is also used to describe the turbulent flow field around a car-like geometry. People working in vehicle aerodynamics use Ahmed body to validate their numerical model because the experimental data from wind tunnel testing is available for Ahmed body. Once the numerical model is validated, it is used to design new models of the car.
The Ahmed body was described originally by S. R. Ahmed in 1984. Three main features were seen in the wake:
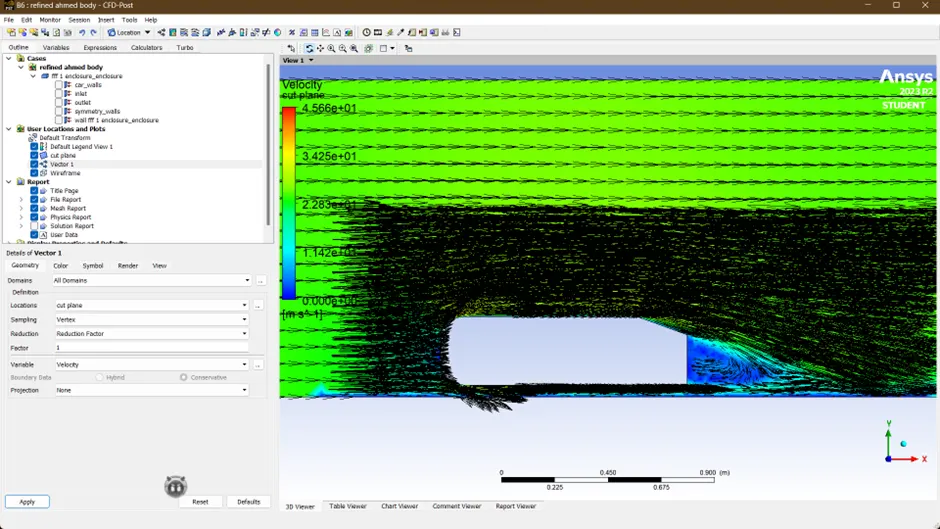
1. The A recirculation region that is formed as the flow separates at the top of the vertical back surface of the model
2. The B recirculation region that is formed due to the separation at the base of the model.
3. The c-pillar vortices that form as the vorticity in the side boundary layers roll up over the slant edges.
2. Explain the reason for the negative pressure in the wake region.
The negative pressure is due to the velocity difference applied at a certain Reynold number and the rear angle, which at a low Reynolds number when this difference in pressure happens the wake obtained increases the drag due to the pressure drop behind the Ahmed body, which at a high Reynolds number due to the vortices generated it produces small amounts of pressure thrusting the body.
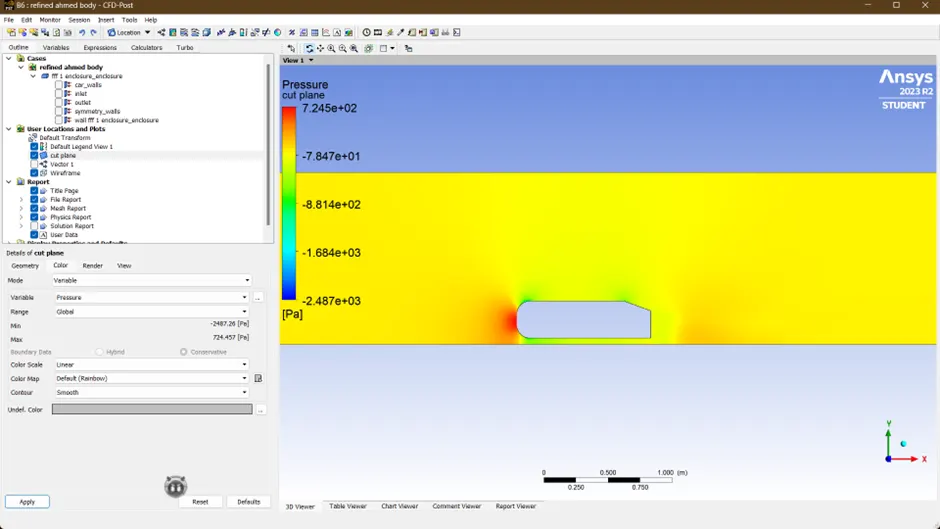
The air becomes almost stagnant as it strikes Ahmed body which results in air exerting very high pressure on the front face of Ahmed body. The airflow then gets divided between the upper and lower surface of the Ahmed body. The higher-pressure air on the front surface accelerates as it travels over the curved nose surface of Ahmed body, causing the pressure to drop. This lower pressure creates lifts over the roof surface as the air passes over it. As the air continues to flow and make its way to the rear, a notch is created by the rear slant owing to flow separation, leaving a vacuum or low-pressure space which the air is not able to fill properly. The resulting lower pressure creates lift and the drag that then acts upon the surface area of the rear slant.
3. The significance of the point of separation.
Flow separation or boundary layer separation is the detachment of a boundary layer from a surface into a wake. Separation occurs in flow that is slowing down, with pressure increasing, after passing the thickest part of a streamline body or passing through a widening passage.
The point of separation defined by the Ahmed body and the flow, the alpha angle depending on which value is at it causes a change in the flow direction, forces required, lift on the body, induced drag due to “tip vortex”, at a critical value flow in slant stalls and reduced lift-reducing as well drag, all depending on the value of alfa and the Reynolds number.
Procedure:
Geometry:
<!-- [if !supportLists]-->1. <!--[endif]-->First, we need to set up the geometry of Ahmed's Body for our simulation
<!-- [if !supportLists]-->2. <!--[endif]-->Creating the enclosures around the Ahmed Body for baseline mesh generation.
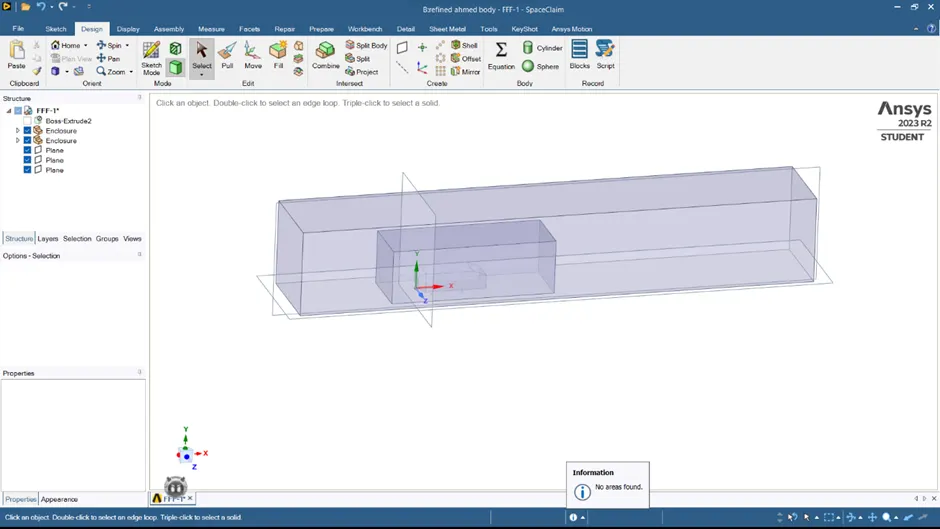
OUTER ENCLOSURE
- The outer enclosure is at a distance of 2m from the Front side of the Ahmed body in the X-axis.
- The outer enclosure is at a distance of 5m from the Rear side of the Ahmed body in the X-axis.
- From the top, it is at a distance of 1m in the Y-axis.
- At the bottom, it is merged means it is at zero distance.
- From the left and right side of the Ahmed body, it is 0.5m along Z-axis.
GEOMETRY 1:
<!--[endif]-->
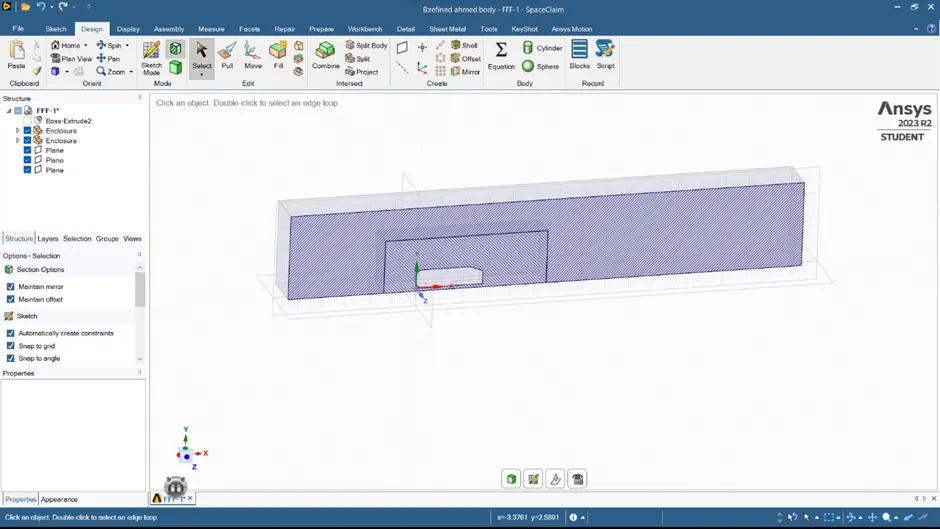
INNER ENCLOSURE
- The inner enclosure is at a distance of 0.5m from the Front side of the Ahmed body in the X-axis.
- The inner enclosure is at a distance of 1m from the Rear side of the Ahmed body in the X-axis.
- From the top, it is at a distance of 0.5m in the Y-axis.
- At the bottom, it is merged means it is at zero distance.
- From the left and right side of the Ahmed body, it is 0.26m along Z-axis.
GEOMETRY 2:
<!--[endif]-->
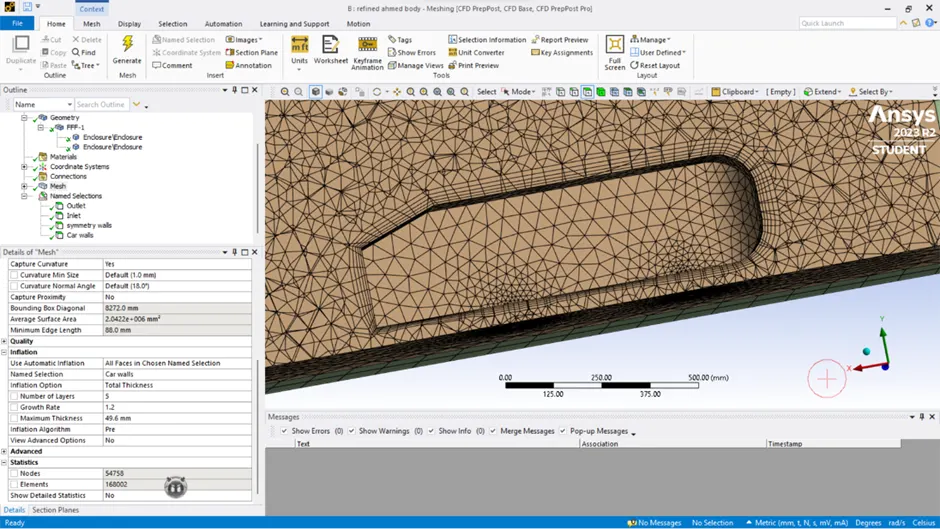
INFALTION LAYER:
<!--[endif]-->
MESHING:
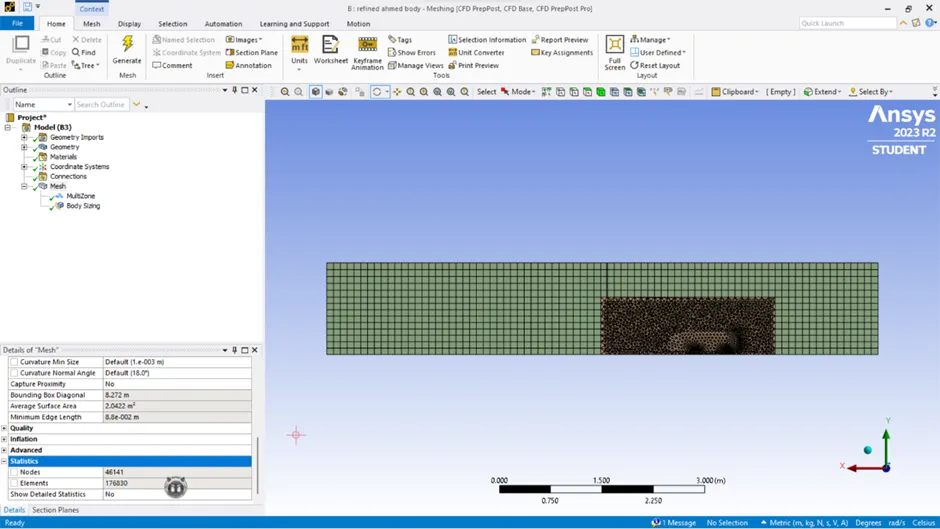
- Generating the mesh on the enclosures around Ahmed Body, the outer enclosure has Hexahedral grids to capture the flow structure and the inner enclosure has the Tetrahedral grids and inflation layers has created along the walls of the Ahmed body to capture the point of separation at the wake region clearly.
- By using the named selection command, we are assigning the boundaries that are front side of the Ahmed body as inlet, Rear side as outlet and the top, bottom, left and right sides as symmetry condition and Ahmed body as car-wall.
MESHED SURFACE:
<!--[endif]-->
SETUP:
In the setup, we are going to set up the conditions for the simulation.
- in the setup>physics>steady state and density-based solver.
- setup>physics>viscous model>k-epsilon>ok.
- setup>physics>material, select air as a flow material>ok
- setup>physics>boundaries>inlet -velocity as 25 m/s, outlet gauge pressure as 0, other conditions will be the default values we are considering>click on ok
- setup>solution>report>residuals, uncheck all the convergence criteria>ok
- setup>solution>report>definitions>new>force report>drag>drag coefficients>car-wall>select report file and report plot >save/display
- setup>solution>method>Hybrid>initialize
- Result>create>plane>point and normal>ok
- setup>solution>run calculation
The Boundary conditions.
<!-- [if !supportLists]-->· <!--[endif]-->The inlet velocity will be 25 m/s, the density of the fluid will be 1.225 kg/m^3, dynamic viscosity will be 1.7894x10^-5 kg/m-s.
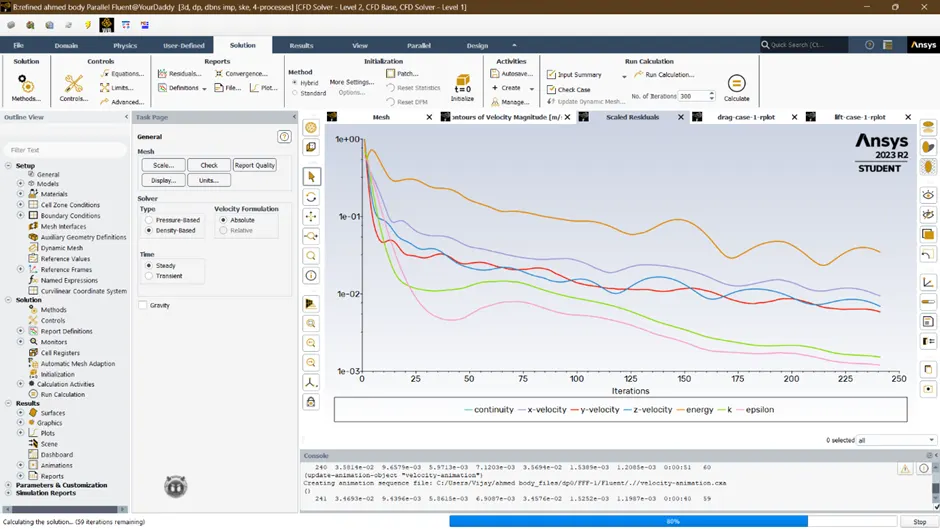
RESIDUAL PLOT:
<!--[endif]-->
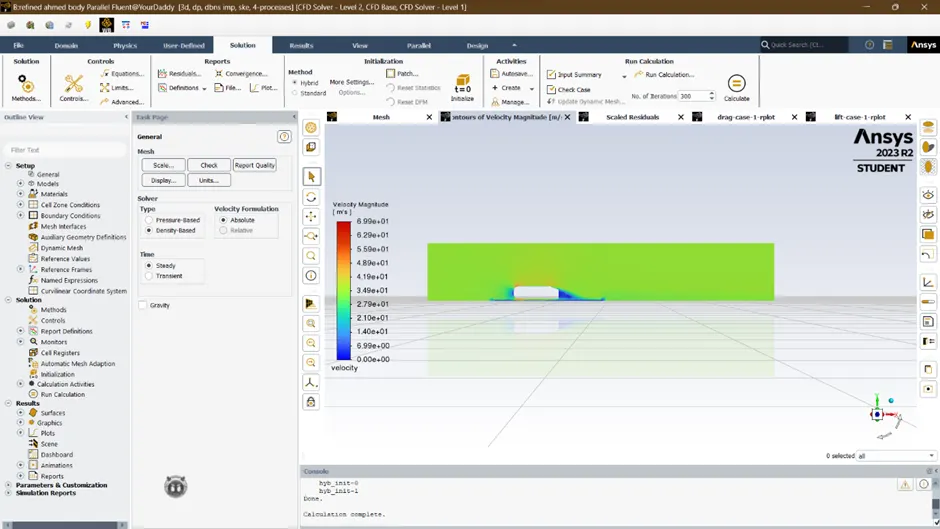
VELOCITY CONTOUR:
<!--[endif]-->
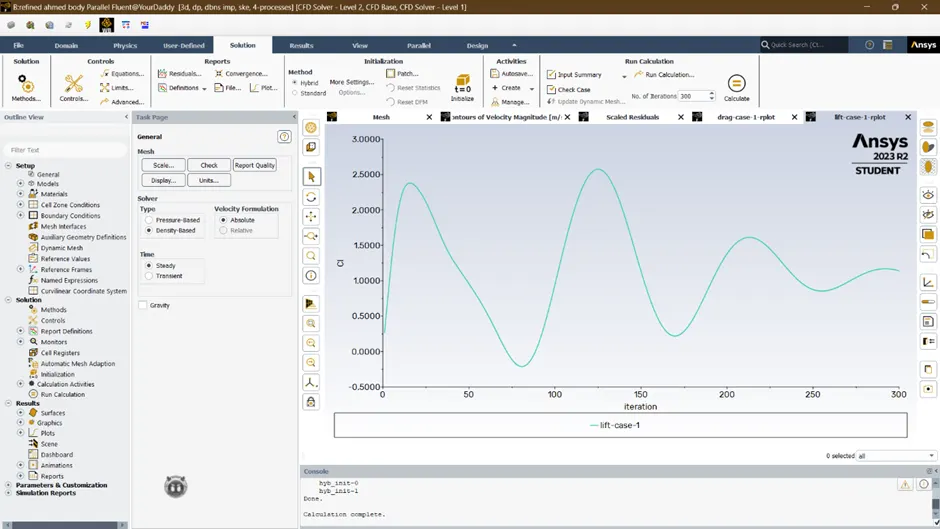
LIFT COEFFICIENT:
<!--[endif]-->
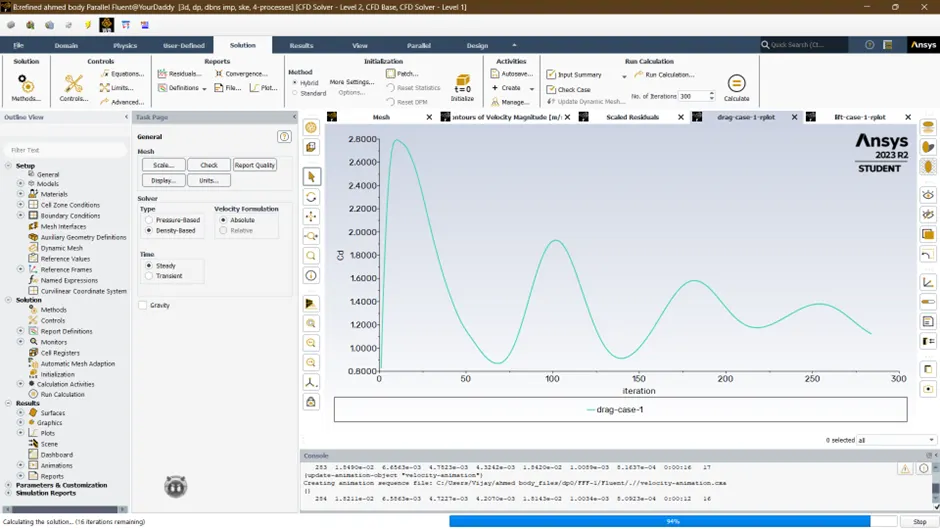
DRAG COEFFICIENT:
<!--[endif]-->
PRESSURE CONTOUR:
<!--[endif]-->
VECTOR PLOT:
<!--[endif]-->
Mesh independent study:
<!-- [if !supportLists]-->· <!--[endif]-->It is a method of investing, whether the simulation results are independent of the underlying mesh or not.
<!-- [if !supportLists]-->· <!--[endif]-->For that first of all we will start with the course mesh size and finding out the reasonably accurate results.
<!-- [if !supportLists]-->· <!--[endif]-->After that we are refining the mesh size i.e. decreasing the mesh size and run the problem for several times until achieving almost constant results such as drag, lift, temp, heat transfer coe.’s in case of fluids, heat analysis etc.
<!-- [if !supportLists]-->· <!--[endif]-->After finding out the results we will compare these results with previous solutions and then Find out the optimum grid/mesh size condition that has the smallest number of grids without generating a difference in the numerical results.
CASE 1:
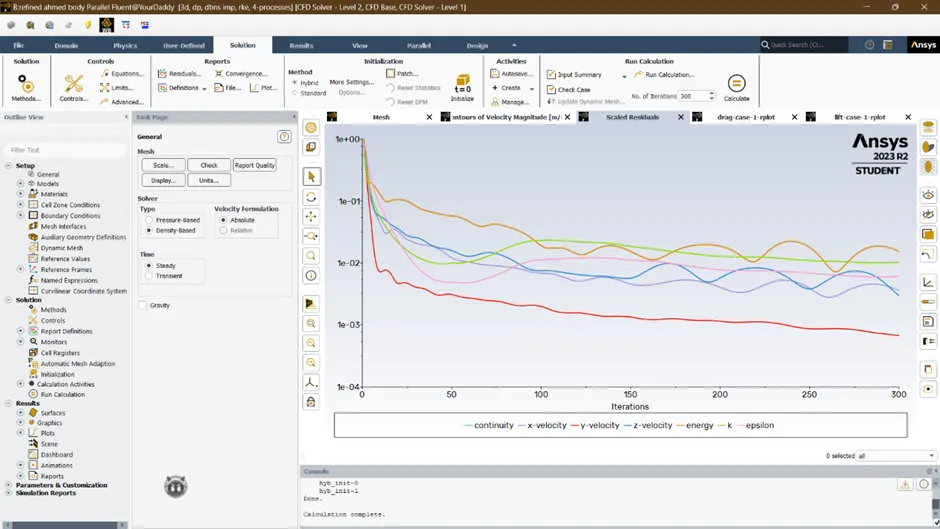
RESIDUAL PLOT:
<!--[endif]-->
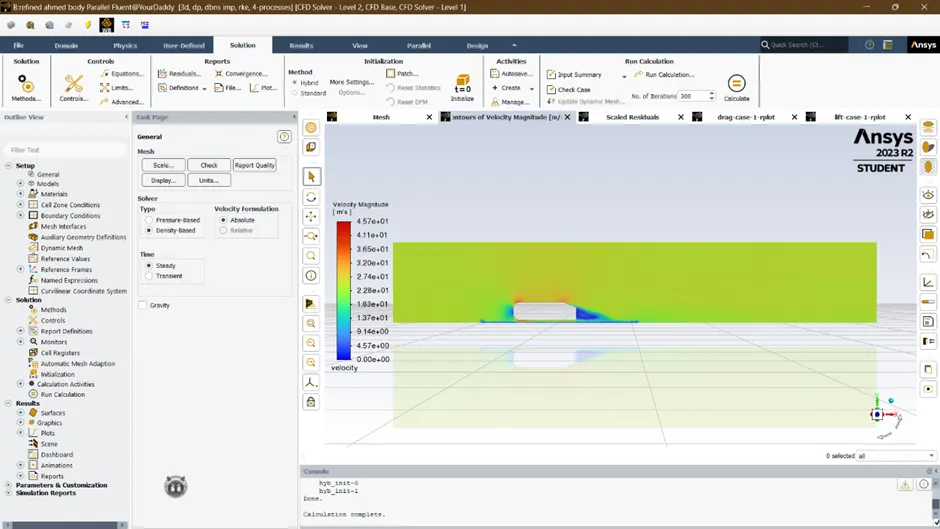
VELOCITY CONTOUR:
 <!--[endif]-->
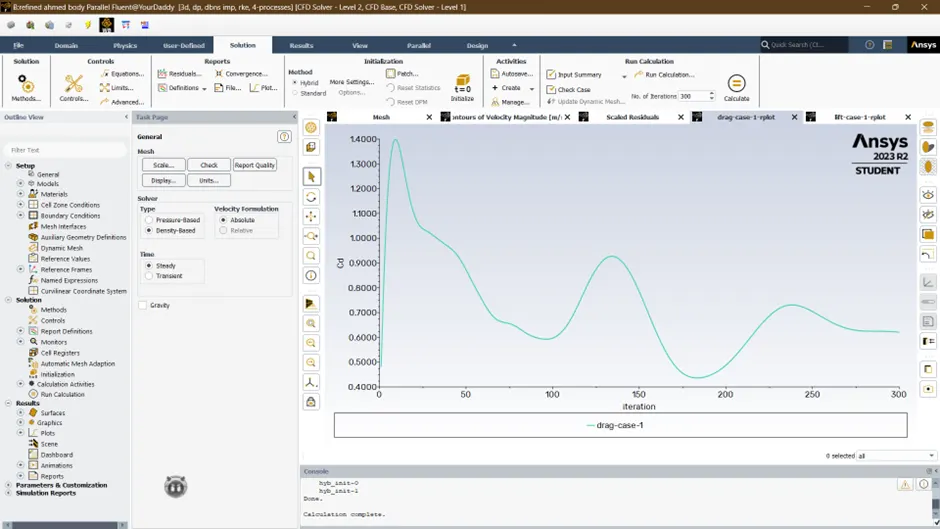
COEFFICIENT OF DRAG:
<!--[endif]-->
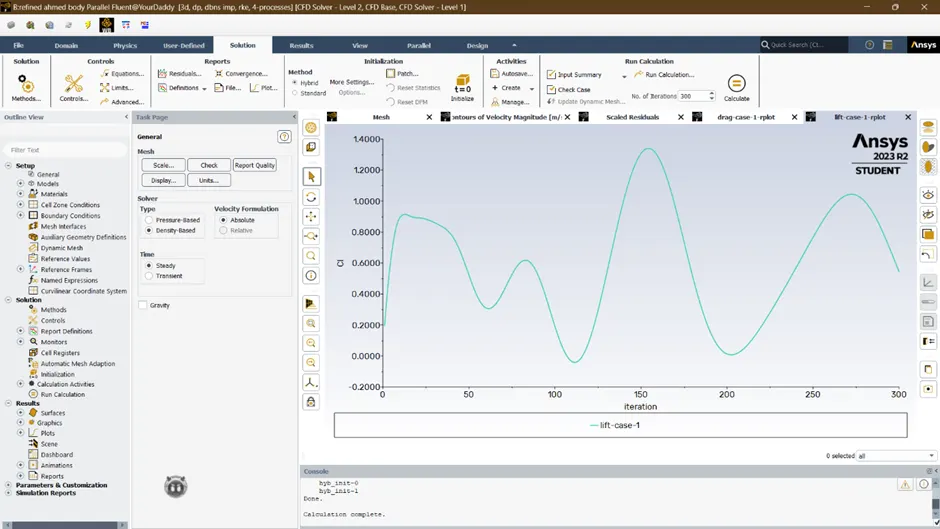
LIFT COEFFICIENT:
<!--[endif]-->
CASE 2:
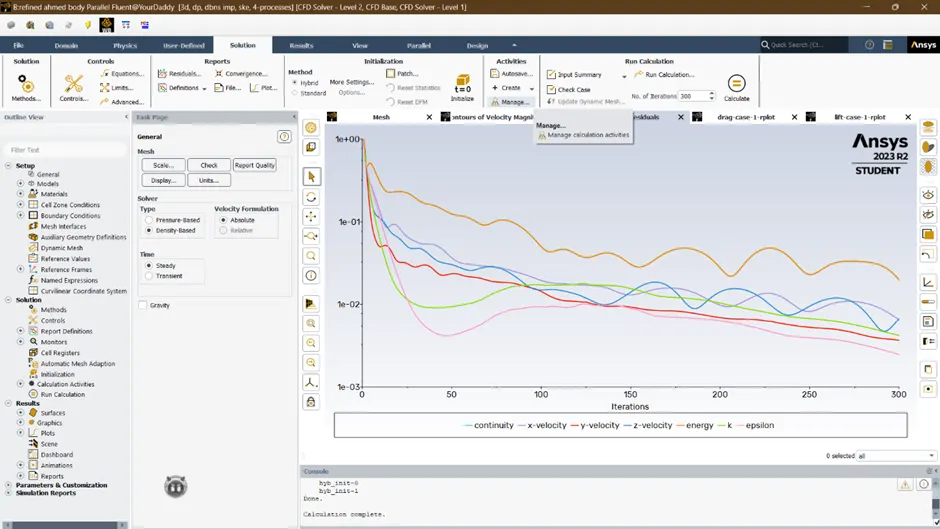
RESIDUAL PLOT:
<!--[endif]-->
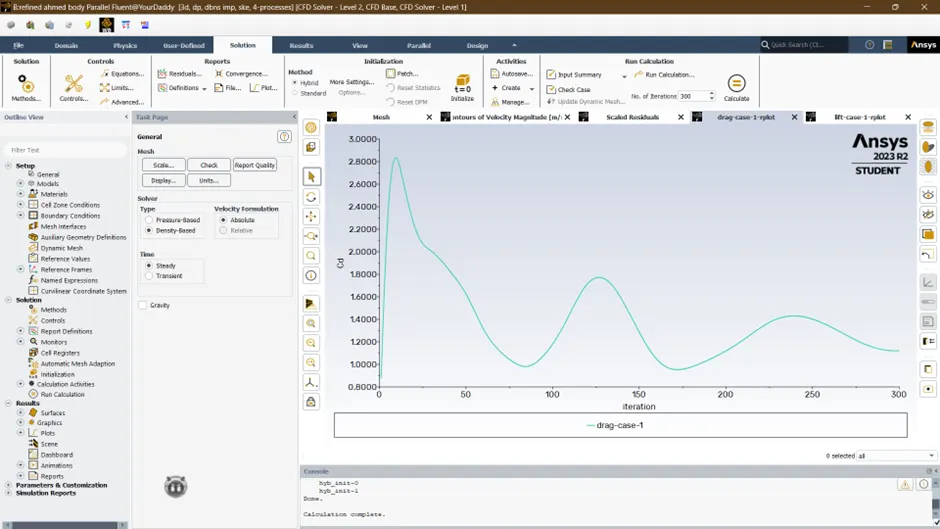
COEFFICIENT OF DRAG:
<!--[endif]-->
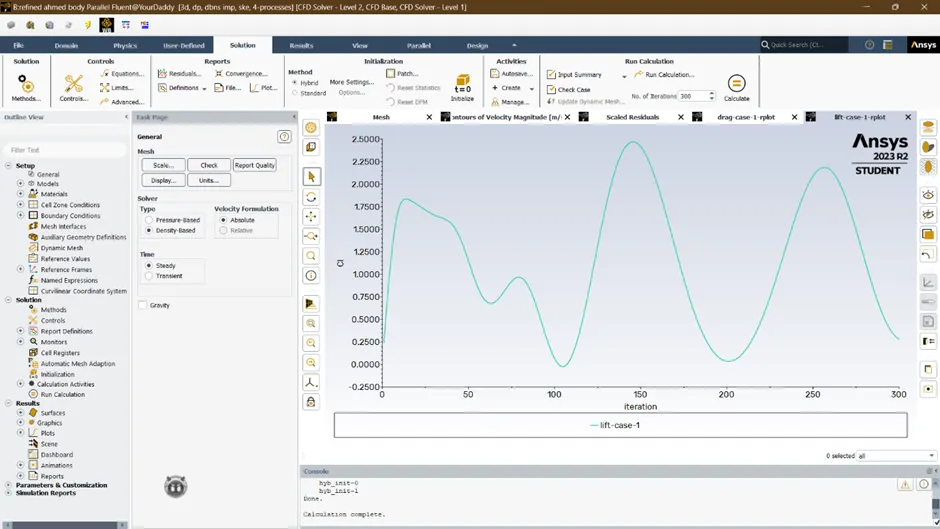
LIFT COEFFICIENT:
<!--[endif]-->
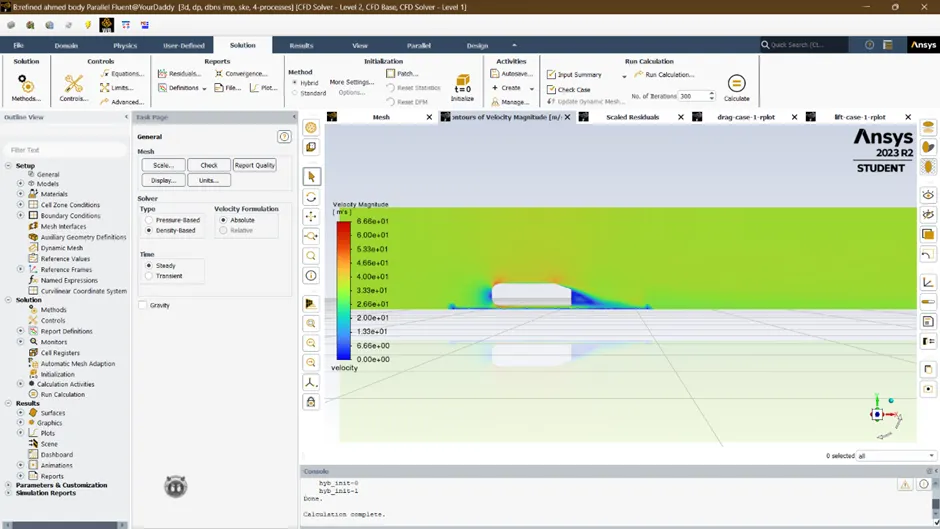
VELOCITY CONTOUR:
<!--[endif]-->
Conclusion:
<!-- [if !supportLists]-->1. <!--[endif]-->There is a variation of pressure across the Ahmed body. The pressure in front of the body is positive because that is the location where the flow first meets the body and comes to rest. At the corner, the flow accelerates, thereby decreasing the pressure.
<!-- [if !supportLists]-->2. <!--[endif]-->From mesh independent study we can say that, the drag coe. (Cd) =0.32 considered as there is student licence restriction, we can’t increase the total number of cell counts beyond 5,12,000. And by refining the mesh quality we can see the drag also drops but gets an avg value and by comparing this with actual results that gives drag around 0.33. so, we can say that our results are validates.
<!-- [if !supportLists]-->3. <!--[endif]-->By seeing drag plots, lift plots and residual plots we can conclude that, the solution has converged. Here the convergence means after the certain iteration done, we will get constant graph plots and gets constant values.