Week 3 - External flow simulation over an Ahmed body.
Aim: To perform external simulation over an ahmed body for the velocity of 25 m/s
Objectives:
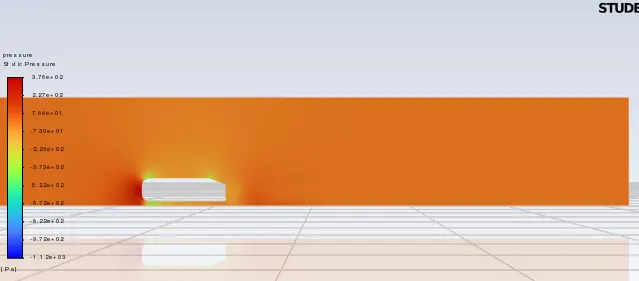
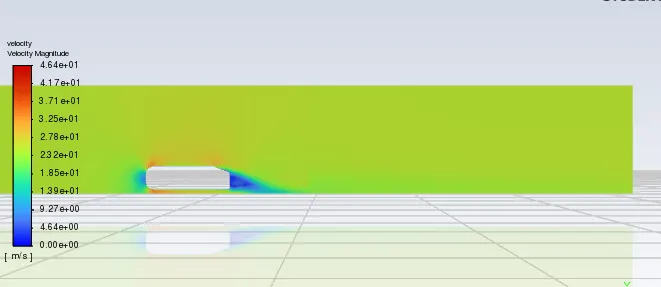
- Plot Velocity and Pressure contours
- Perform drag coefficient plot for refined case
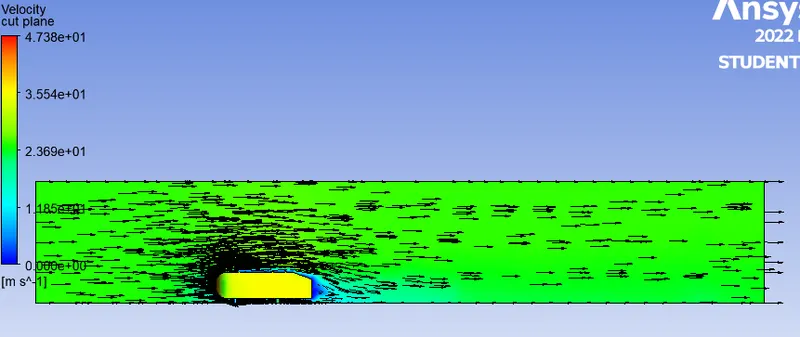
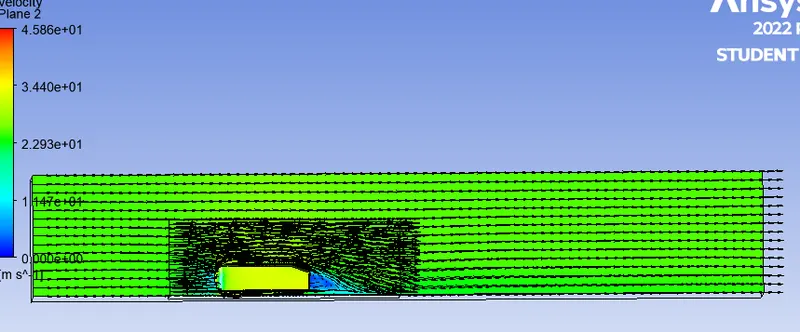
- show vector plot clearly showing the wake region
- Perform grid independency test and provide the values of drag and lift with each case.
Answer the following quetions
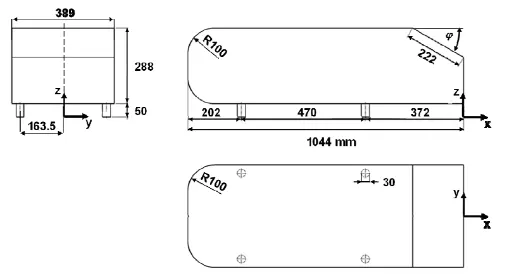
1. Describe Ahmed body
the Ahmed body was at first devoloped by Ahmed in 1984. It is a general car model which is used by the automotive industries to examine the wake forces and dynamics which is experienced in a variety of configurations. The ahmed body is designed to have smooth edged front end with a flat bottom section and an angled back slant which basically acts as the rear window of a car and ending with a vertical base. The back slant angle which is commonly designated to very critical to the flow patterns which are fashioned at the near wake region and subsequently has an impact on the on the aerodynamic forces act on the body.
its importance
The airflow around the ahmed body captures the essential flow features around an automobile and was first defined and characterized in the experimental work of Ahmed. Ahmed body allows us to capture characterictic featues that are relevant to bodies in the automobile industry. this model also used to describe the turbulent flow field around a car loke geometry. Once numerical mpdel is validetes, it is used to design new models of the car. it is used to design new models of the car. it can be used for researching properties like turbulance, drag coeeficient, lift coefficient, drag force, lift force, velocity, flow rate etc.. and its helps devolop new car model
2. Explain the reason for the negative pressure in the wake region.
When the air moving over the vehicle is separated at the rear end, it leaves a large low pressure turbulent region behind the vehicle known as wake region. The pressure behind the wake region remains low as the flow separates ans net pressure force is produced. in other words due to production of pressure drag being produced from flow separation. The pressure in the wake region is low, This causing the vaccum. you are in that the correct wake particles push the vehicle forward, This effect minimized on the lead vehicle due to the drag it is producing, howevef it is beneficial for any cars following closely behind with drafting the lead car creates aenvelope less of air behind the it, Reducing the friction drag for the cars behind it, As lead car moves it creates low pressure region, that partial vaccum behind the it which essentially sucks in the car behind it and reduces pressure drag.
3. Explain the significance of the point of separation.
The position at which the boundary layer leaves the surface of solid body, it may occur with laminal flow or when the boundary layer is turbulent. Separation is some times followed of the flow.
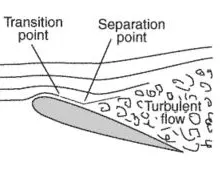
Seperation occurs in the flow that is slowing down, with pressure increasing, after passing the thickest part of steam line body or passing through a widening passge. a wake region devoloped after the flow separation, in this region pressure will be negative pressure which increases the the drag on the body.
Steps in this simulation setup.
Case 1:Baseline mesh
Geometry
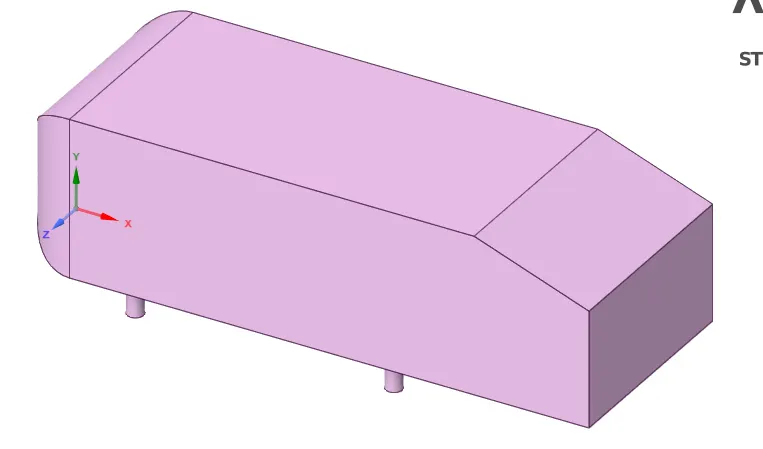
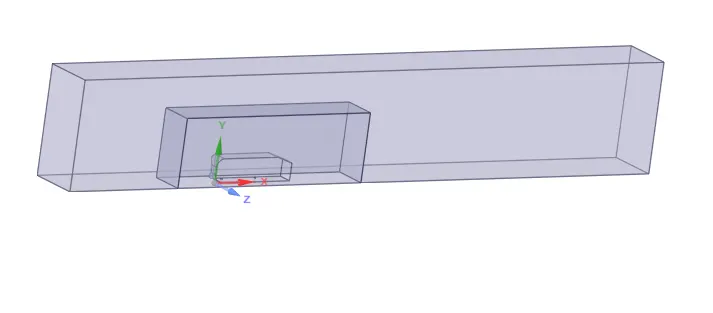
import ahmed geometry model into the space claim.
Enclouser creation
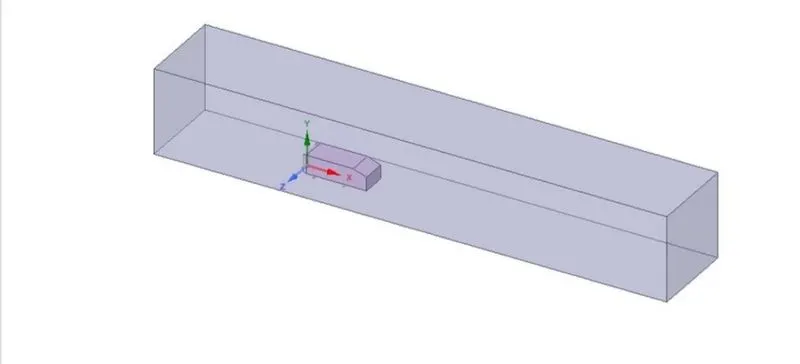
we create enclouser 2m from front end of the ahmed body, 5m from back end of ahemed body, 1m from top end ahmed body, 0.5m from side end of the ahmed body, 0m for bottom end`
Split body
Using this we can select half body and we can run simulation run simulation consider half body it helps to reduce element number and give faster results`
Meshing
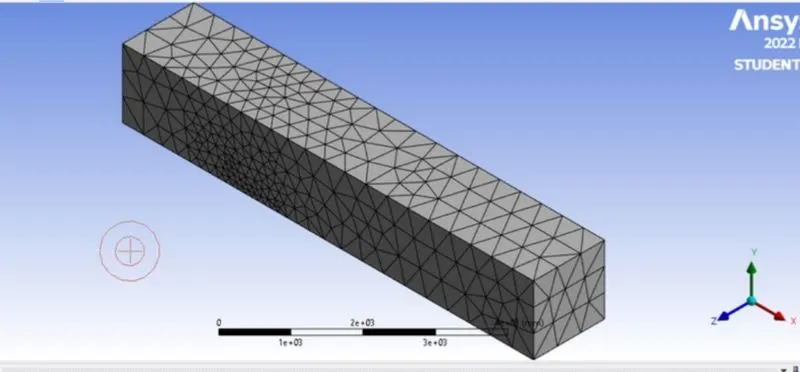
For this case we are using default element size for mesh
Setup
Setting of physics
Solver-steady time-Pressure based type-Absulute velocity
Viscous model type- k epsilon (2eqn)
Material-Air is fluid type-default air properties
Boundary condition- inlet- velocity 25m/s
outlet- 0 pressure and remainings are default
solution
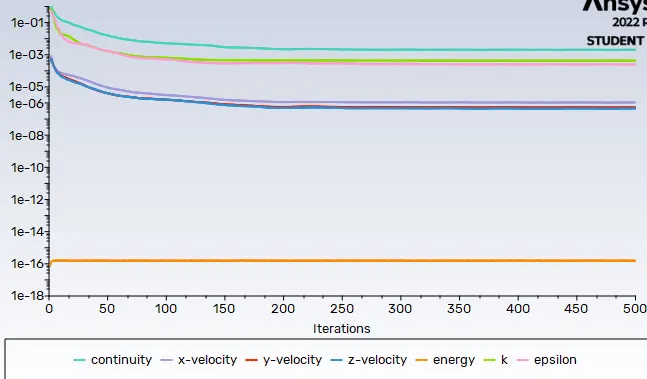
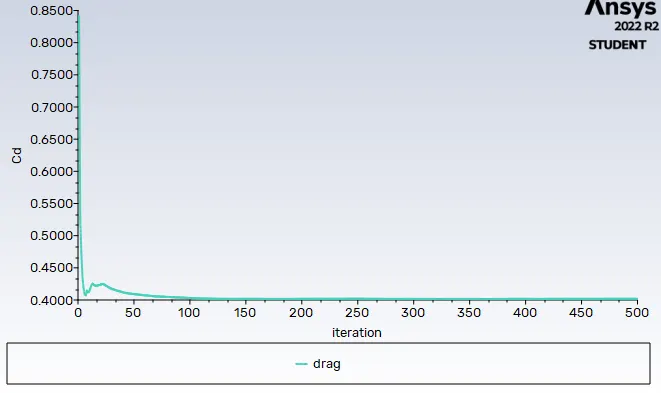
Define the plots what are we need like, drag coeffient, lift coefficient, then select Hybrid method, initialize the solution, Run calculation with 500 iterations
Residuals
Drag coefficient
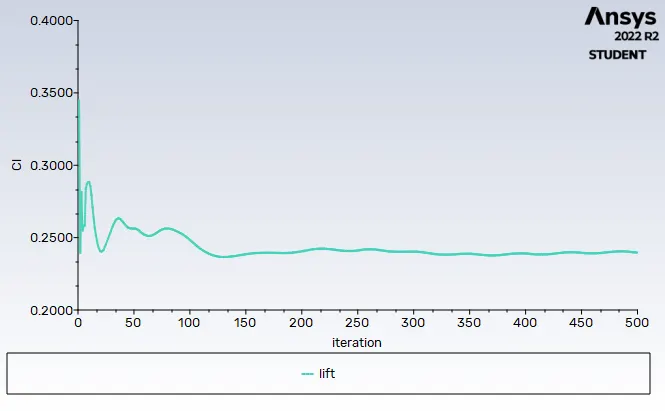
Lift coefficient
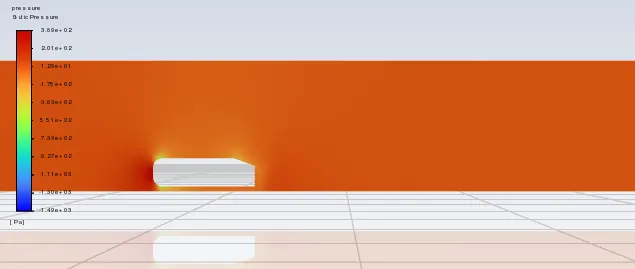
Pressure contour
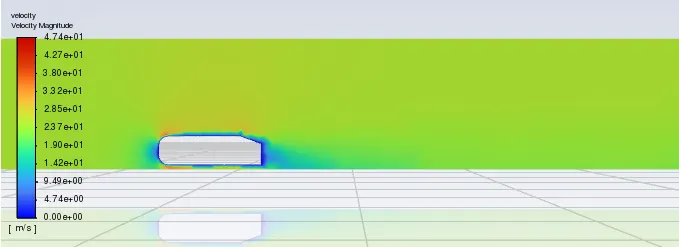
Velocity Contour
Vector plot
Case 2 : With smaller enclouser (medium coarse mesh)
Meshing
Element size for
Big enclouser: 100mm
Small enclouser: 50mm
Bottom leg: 5mm
Inflation layer
No of layer- 5
Growth rate - 1.2
Inflation option - Total thickness
Max Thickness - 10.5mm
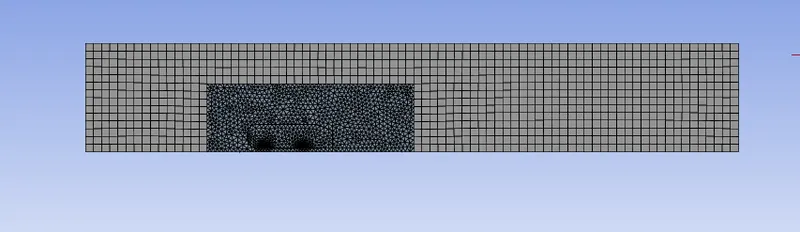
Setup values are same as Case 1 values
Residuals
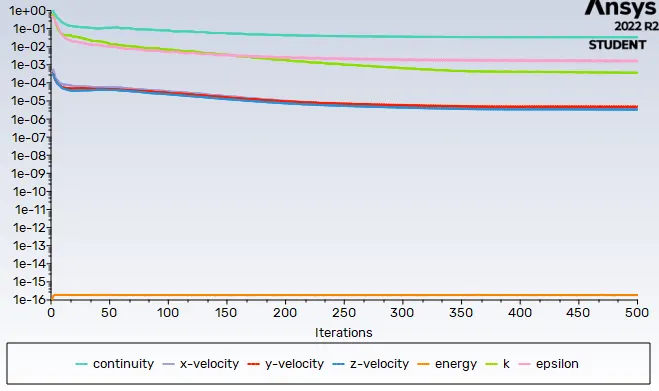
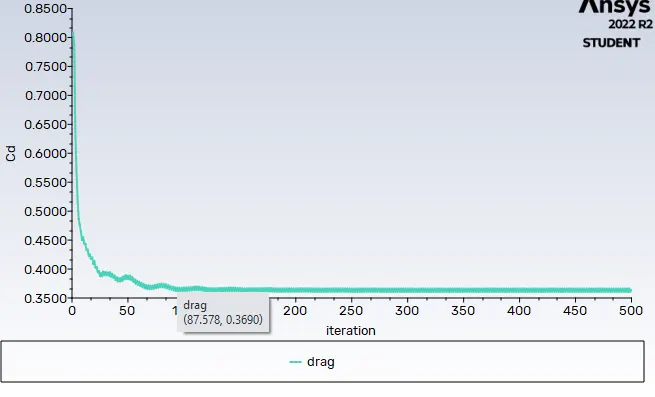
Drag coefficient
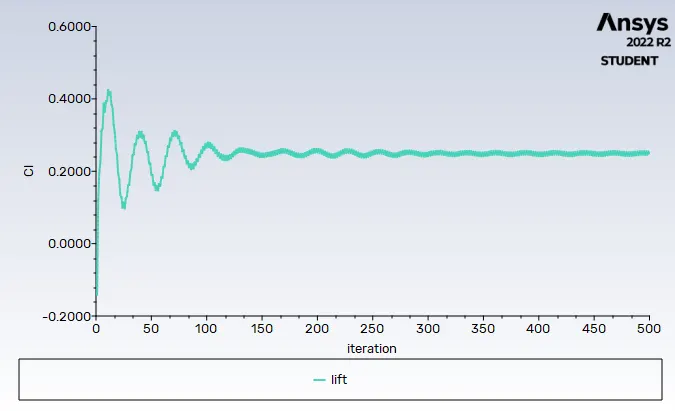
Lift coefficient
Presure contour
Velocity contour
Vector Plot
Case 3
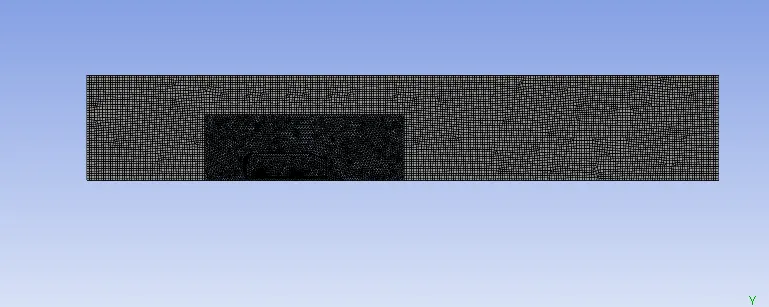
Meshing
Element size for
Big enclouser: 60mm
Small enclouser: 30mm
Bottom leg: 3mm
Inflation layer
No of layer- 12
Growth rate - 1.2
Inflation option - Total thickness
Max Thickness - 12.6mm
Residuals
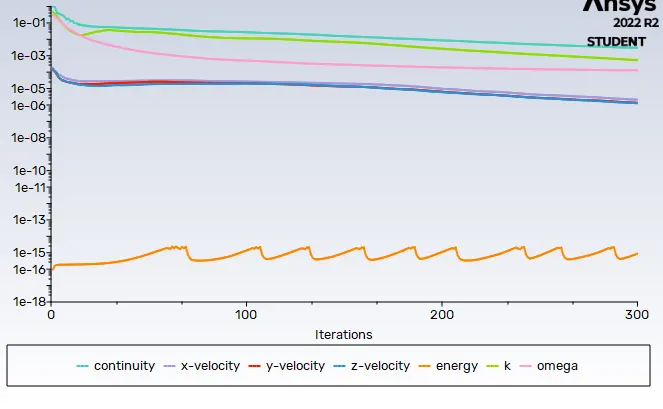
Drag coefficient
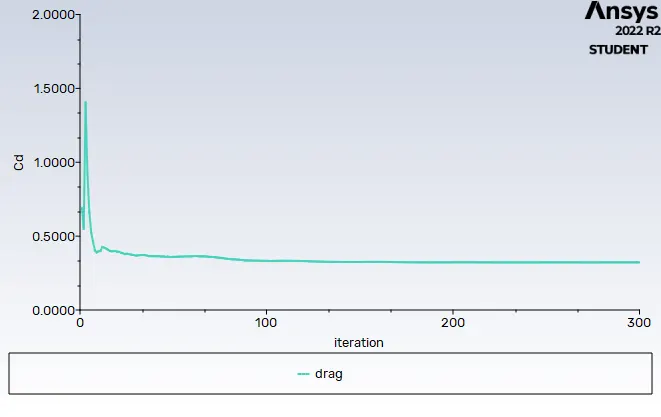
Lift coefficient
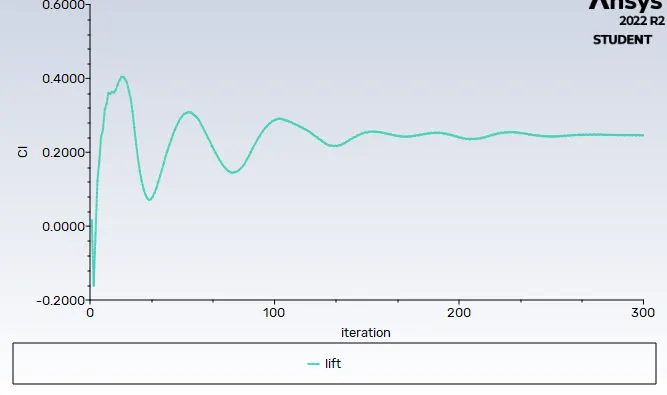
Presure contour
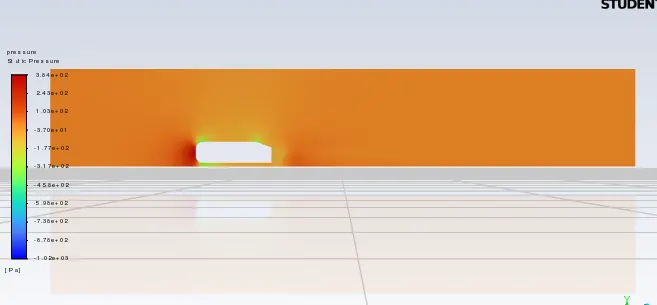
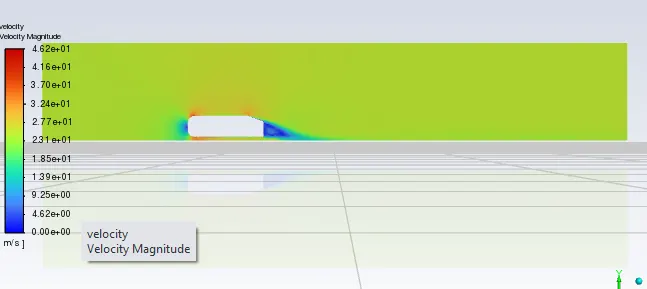
Velocity contour
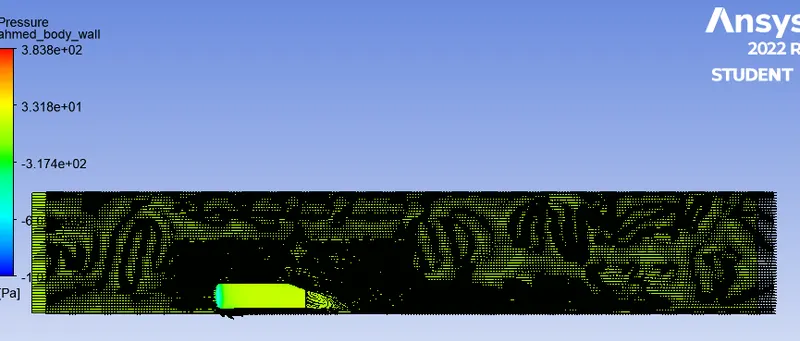
Vector Plot
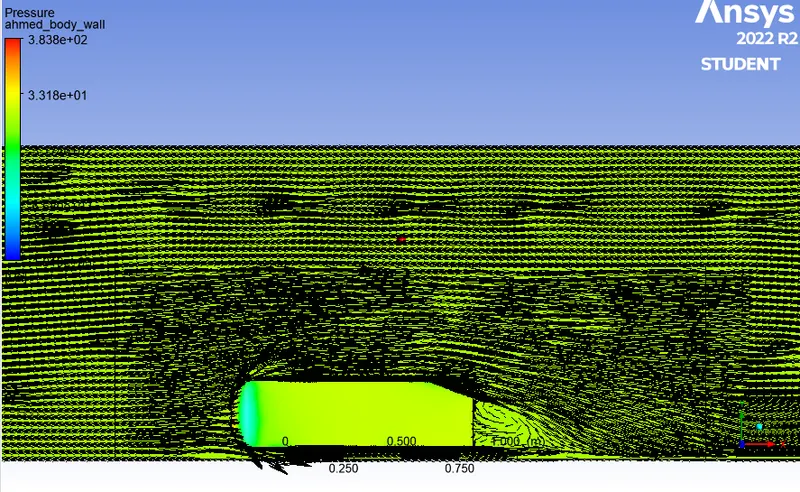
Zoomed view vector plot
Results
GRID DEPENDENCE TEST
| CASES | MESH ELEMENT SIZE | DRAG COEFFICIENT | LIFT COEFFICIENT |
| Base meshing | Defualt mesh | 0.401 | 0.239 |
|
Medium Coarse meshing |
Big enclouser: 100mm Small enclouser: 50mm |
0.363 | 0.248 |
| Refined meshing |
Big enclouser: 60mm Small enclouser: 30mm |
0.322 | 0.245 |
Conclusion
- In this challenge when we going refining meshing in every case results are different.
- We can observe drag coefficient are different in these 3 cases`
- We can observe vector plot in every case when we refine the mesh it best vector plots.
- Succesfully performed external flow over simulation an ahmed body and results are tabulated