Week 3 - External flow simulation over an Ahmed body.
Ahmed's body and its importance -
The Ahmed body is a generic car body (a simplified vehicle model). The airflow around Ahmed's body captured the essential flow features around an automobile and was first defined and characterized in their experimental work of Ahmed. Ahmed's body is made of a round front part, a moveable z-slant plane in the rear of the body to study the detachment phenomena at different angles, and a rectangular box which links the front part and the rear slant plane.
- The principal objective to study such a simplified car body is to tackle the flow processes involved in drag production.
- Besides the analyses of the velocity field, the Ahmed Body is also used for drag force and lift force analyses and rolling, pitching and yawing moments.
- The slant angle on the back allows studying the separation region and its influence on the velocity profile and forces.
- Through perceiving the mechanisms involved in creating drag one can be able to design a car to minimize drag and therefore reduce fuel consumption and maximize vehicle performance.
- Despite neglecting several features of a real car (rotating wheels, rough underside, surface projections, etc.) the Ahmed body generates the essential features of flow around a car, namely: flow impingement and displacement around the nose, relatively uniform flow around the middle and flow separation and wake generation at the rear.
The geometry of Ahmed's body is shown in the figure below. The Ahmed body, with a length of 1044 mm, height of 288 mm, and width of 389 mm, was placed at 50 mm from the ground.
Negative pressure in the wake region -
It is necessary to understand that the terminology negative pressure doesn't mean that the pressure is negative. The lowest pressure that can be achieved is the vacuum. Negative pressure in a region would mean that it has lower pressure than the surrounding region. The point where the flow leaves the surface is called the separation point. In scientific terms, it is the point where there is no more influence of the wall i.e., there is no zero wall shear stress. This flow with it would carry the air particles which were there behind the car when the car was at rest. So, the number of molecules behind the car has now considerably gone down, which implies the pressure has reduced. This is the negative pressure region that is developed behind the car. Now since the pressure has gone down, naturally air from the high-pressure region should flow in and fill the void, ideally, this process starts and the flow tries to reverse in towards the car's moving direction. The flow behind an object separates from the surface and creates a highly turbulent region behind the object, called the wake. The pressure inside the wake region remains low as the flow separates and a net pressure force (pressure drag) is produced. In other words, due to the production of pressure drag being produced from flow separation, the pressure in the wake region is low.
Significance of the point of separation -
In aerodynamics, flow separation results in reduced lift and increased pressure drag, caused by the pressure differential between the front and rear surfaces of the object. The fluid exerts a constant pressure on the surface once it has separated instead of a continually increasing pressure if still attached.
The flow becomes detached from the surface and instead takes the forms of eddies and vortices. Vortices shed from the bluff downstream surface of a structure at a frequency depending on the speed of the flow. Vortex shedding produces an alternating force which can lead to vibrations in the structure. If the shedding frequency coincides with a resonance frequency of the structure, it can cause structural failure. These vibrations could be established and reflected at different frequencies based on their origin in adjacent solid or fluid bodies and could either dampen or amplify the resonance.
Simulation -
CASE 1: Default Mesh
Pre-processing: Geometry-
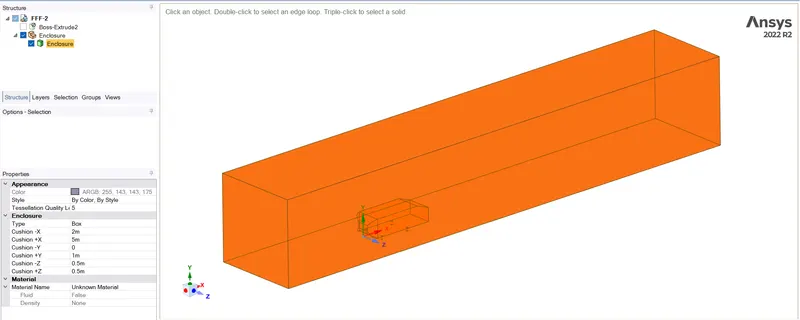
In SpaceClaim, we made an enclosure around Ahmed's body with dimensions shown on the left side properties pane along X, Y and Z directions from Ahmed body and then we need to suppress Ahmed body.
Pre-processing: Meshing-
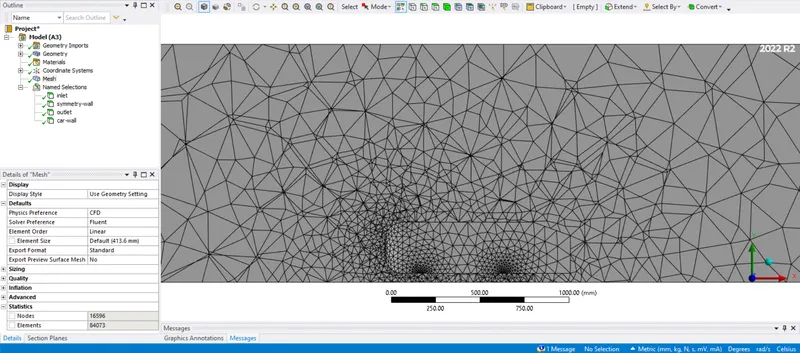
We have created a default mesh which will be coarse. Also, the named selections have been done, showing the inlet, outlet, symmetry wall and car wall.
Solving: Setup -
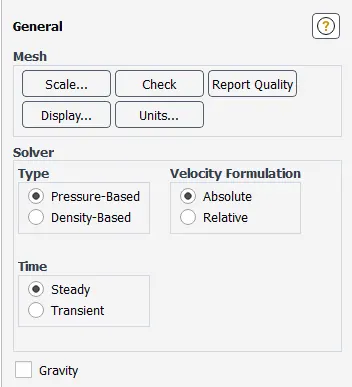
Solver
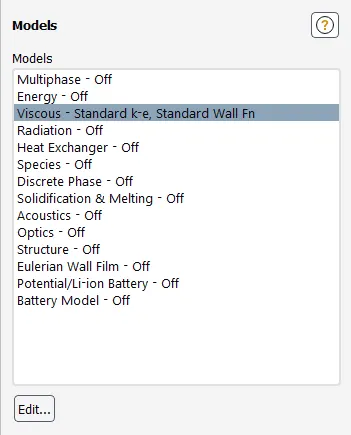
Model
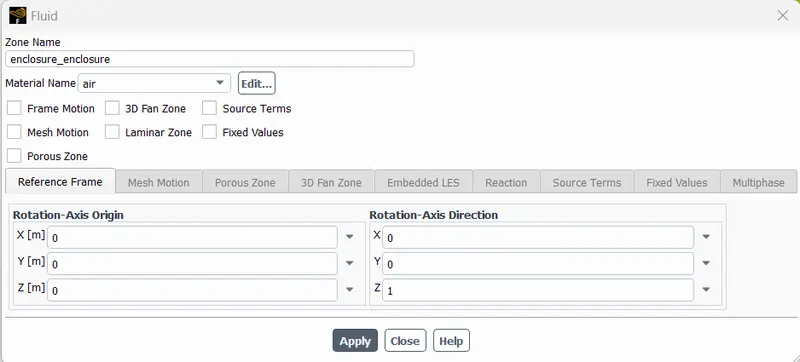
Cell Zone Condition
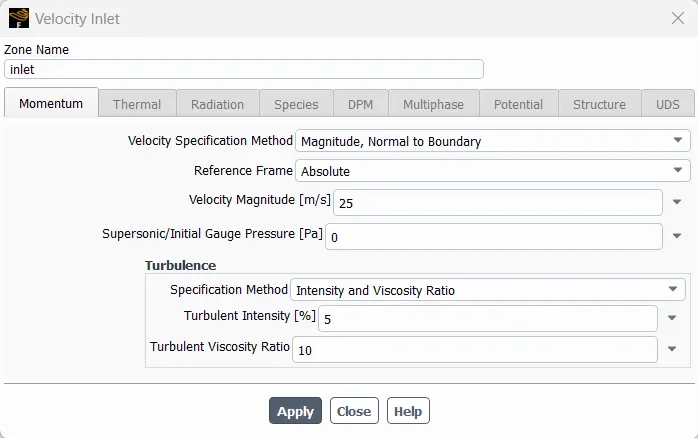
Boundary Condition Velocity Inlet
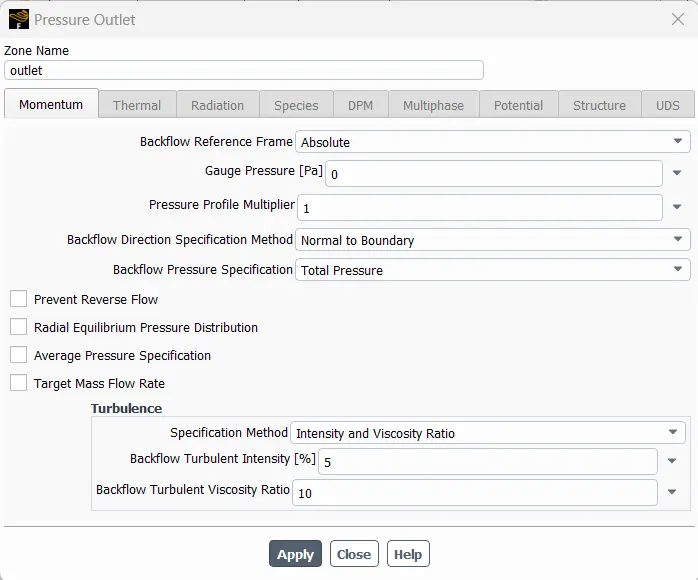
Pressure Outlet
Reference values
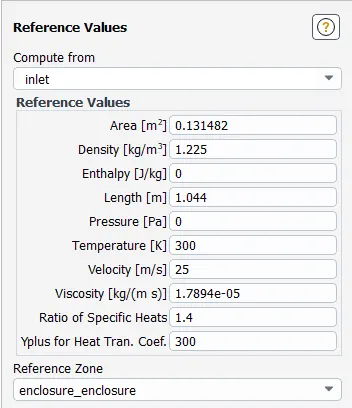
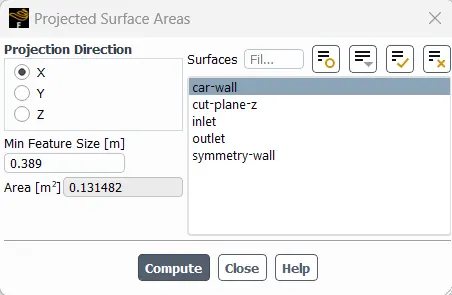
The area is obtained using Projected Areas under Reports in the x direction and giving input of total Ahmed body width.
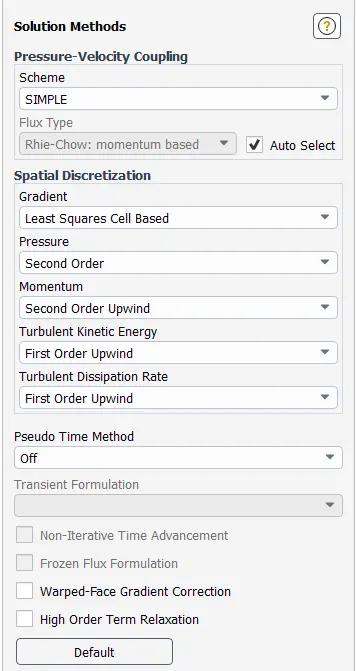
Solution methods
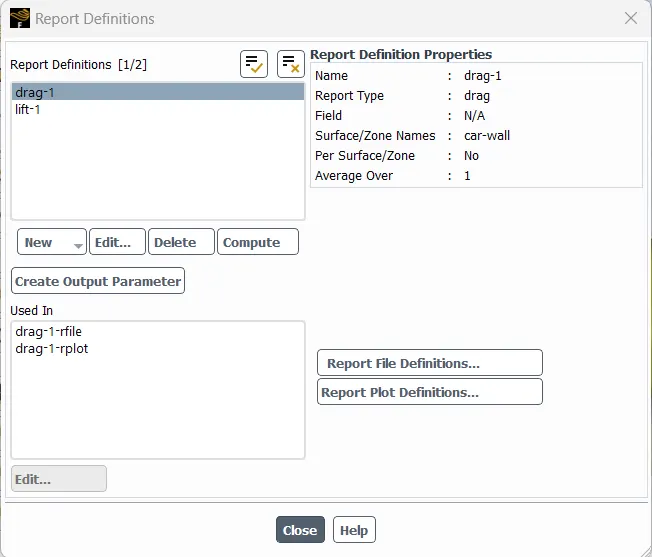
Report Definitions
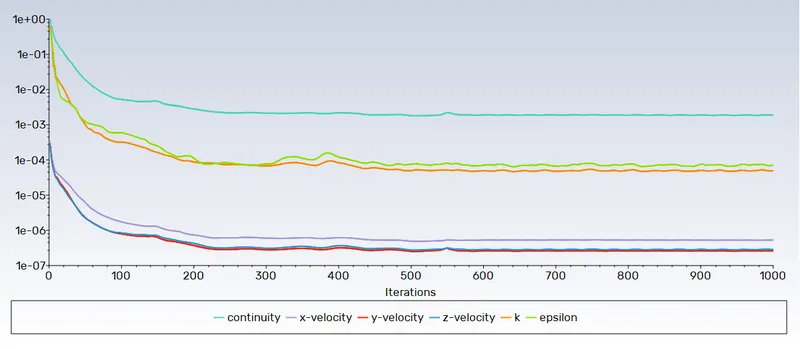
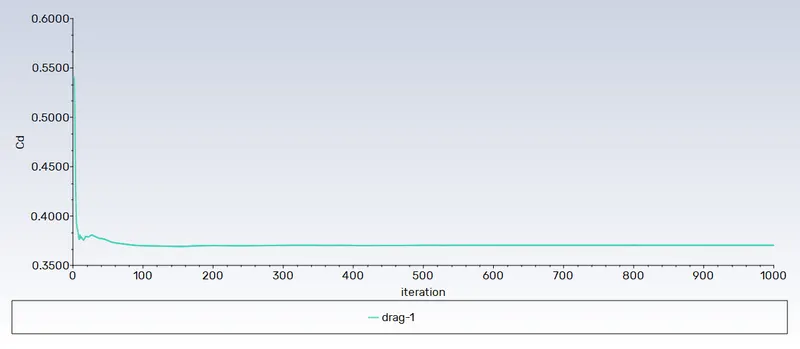
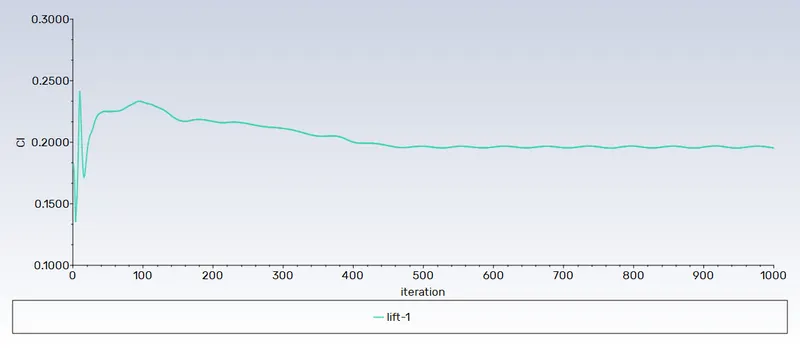
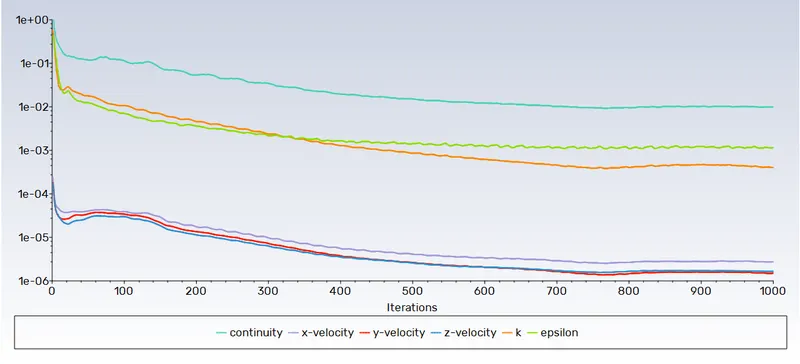
After solving for 1000 iterations, these are the results
Residuals
Drag
Lift
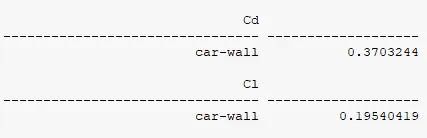
Cd and Cl
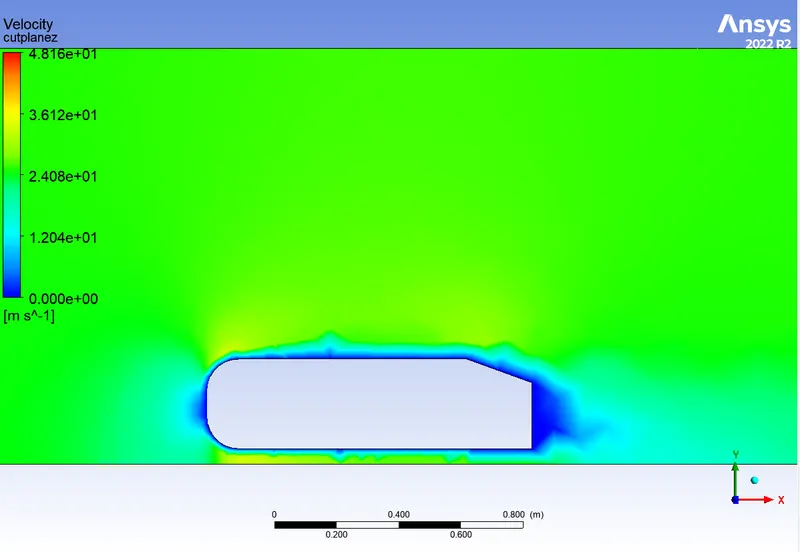
Post-processing: Velocity contour
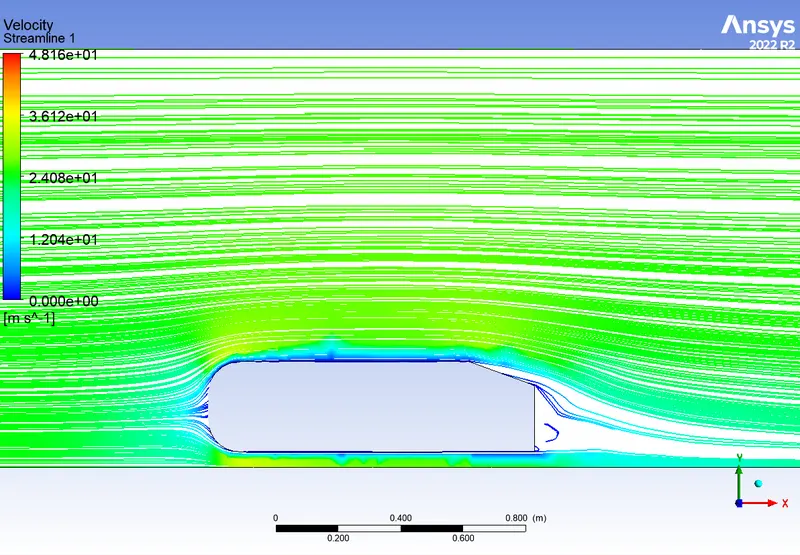
Streamline
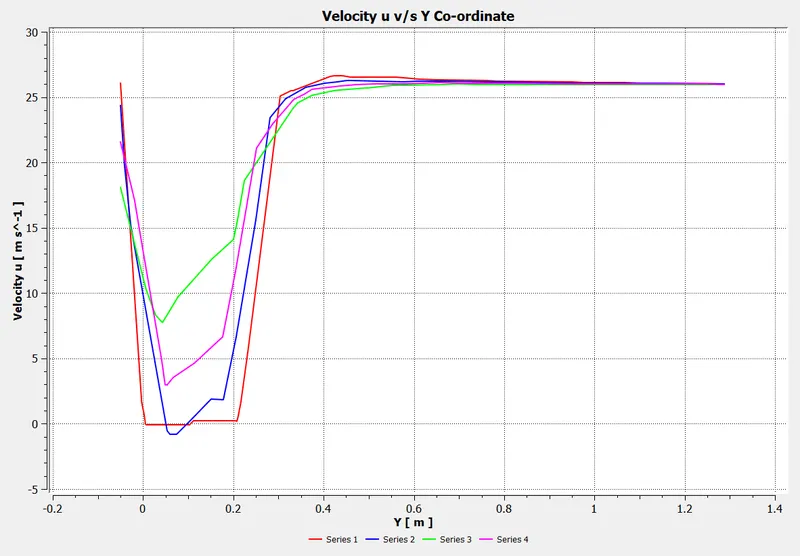
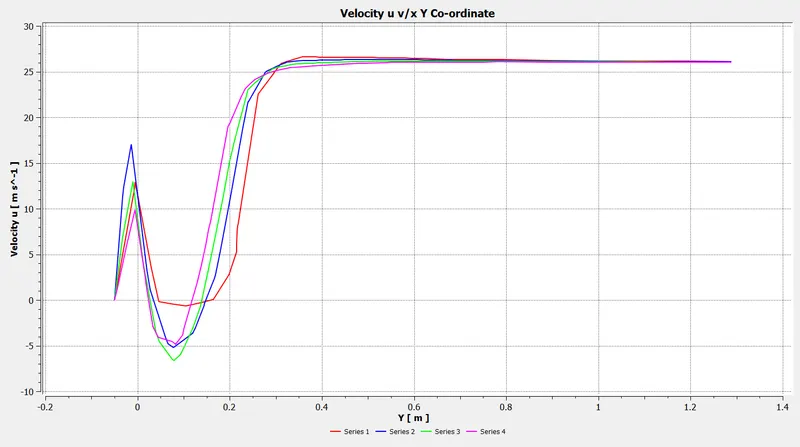
Velocity u v/s Y coordinate
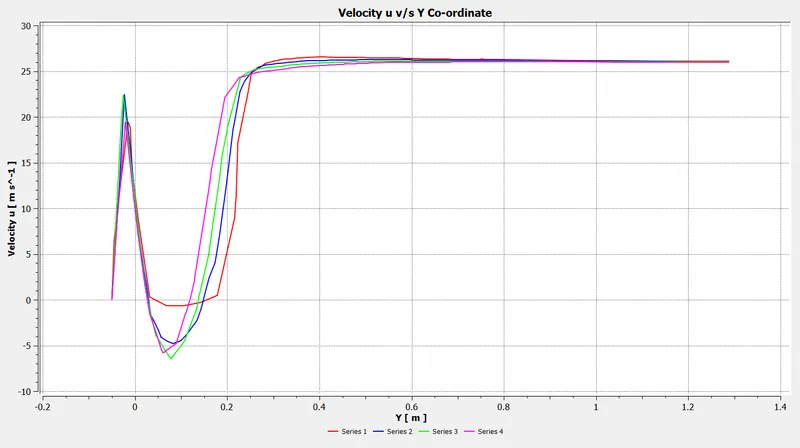
Created lines at distances of 1.05m, 1.10m, 1.15m and 1.2m
CASE 2: Refined Mesh 1
Pre-processing: Geometry-
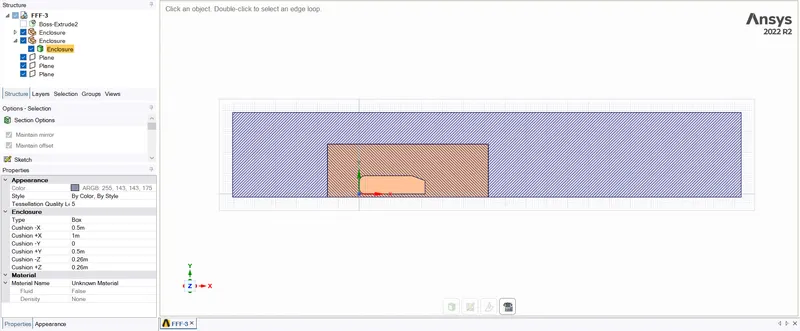
In SpaceClaim, we made an inner enclosure around Ahmed's body with dimensions shown on the left side properties pane along X, Y and Z directions from Ahmed body.
Pre-processing: Meshing-
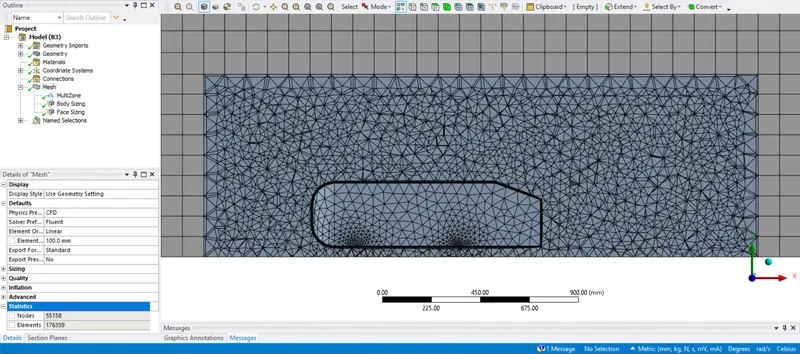
The multiZone method was applied for the outer enclosure along with 100mm sizing and body sizing of 50mm to the inner enclosure. Face sizing of 5mm for pillars.
Solving: Setup - All setup is the same as case 1
Solving: Results
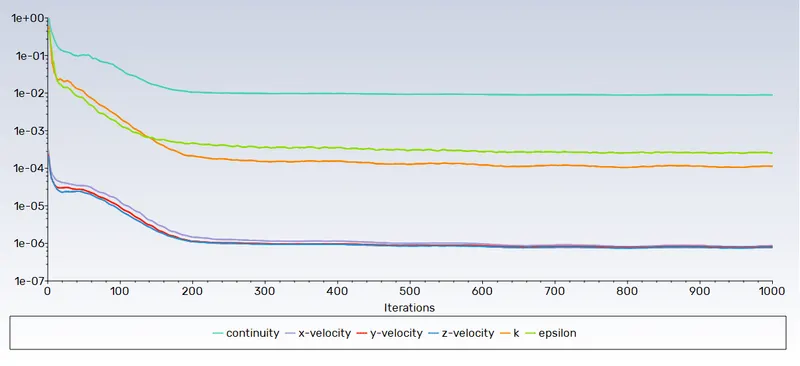
Residuals
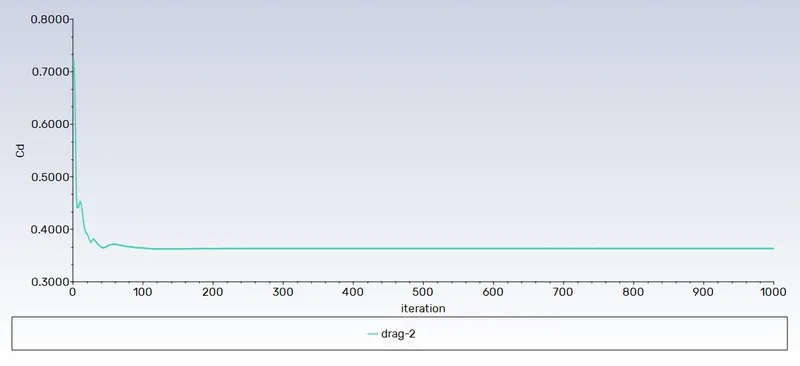
Drag
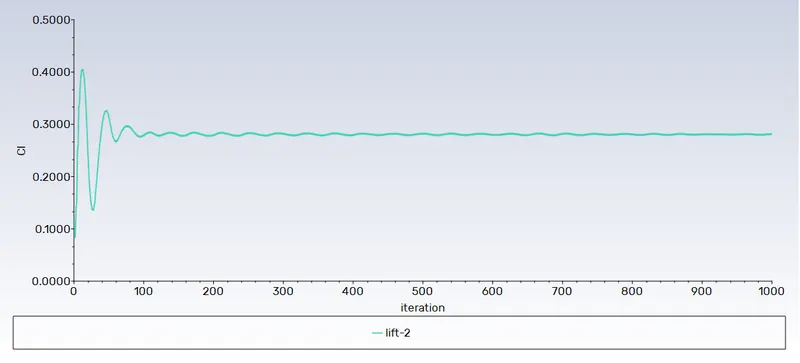
Lift
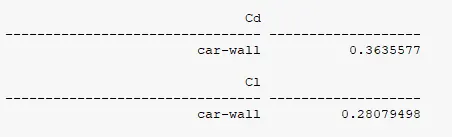
Cd and Cl
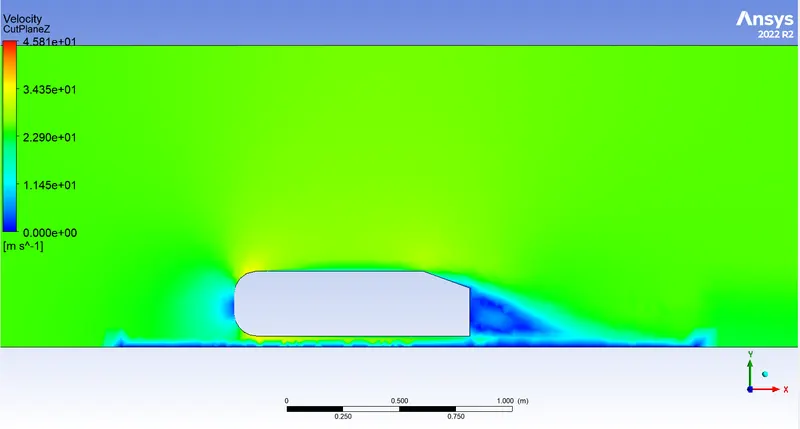
Post-processing: Velocity contour
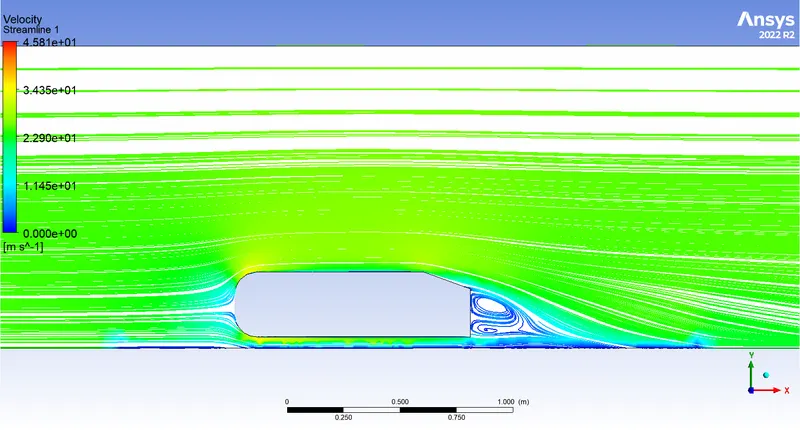
Streamline
Velocity u v/s Y coordinate
CASE 3: Refined Mesh 2
Pre-processing: Geometry- It is the same as used in Refined Mesh 1
Pre-processing: Meshing-
The multiZone method was applied for the outer enclosure along with 90mm sizing and body sizing of 35mm to the inner enclosure. Face sizing of 3mm for pillars. The inflation layer was calculated for y+=200 (Generally when you build a grid for the RANS model of k-epsilon the target value of y+ should be between 30 and 300) and the result was given input as first layer thickness for 5 layers and a growth rate of 1.2.
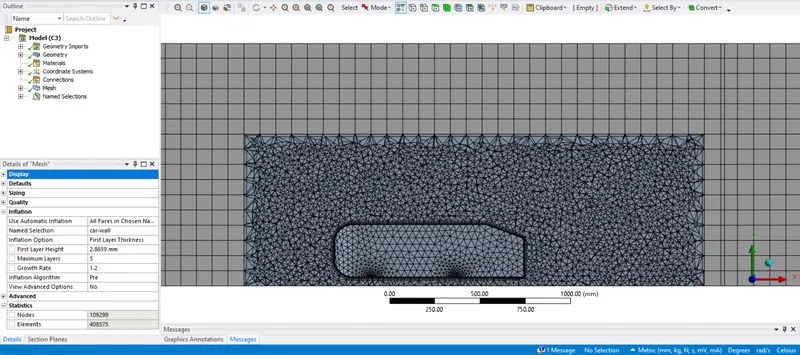
Solving: Setup - All setup is the same as case 1
Solving: Results
Residuals
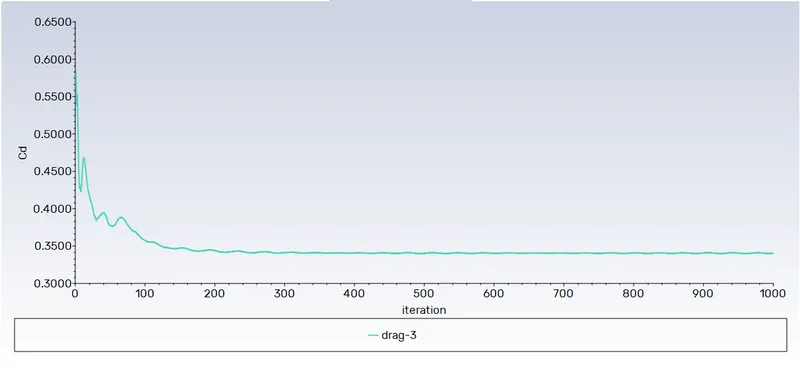
Drag
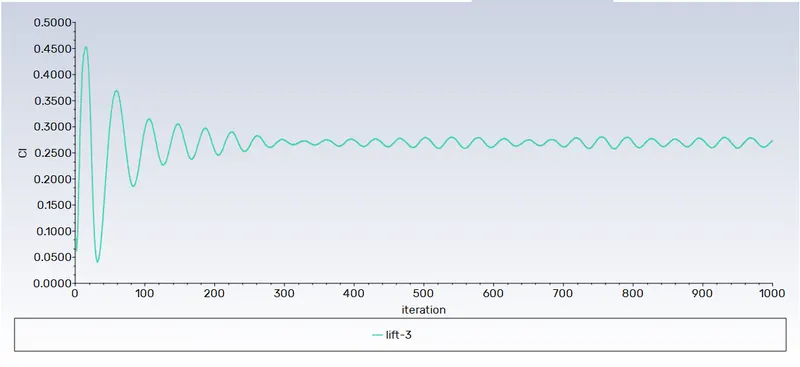
Lift
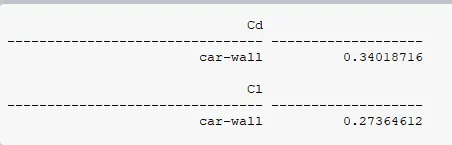
Cd and Cl
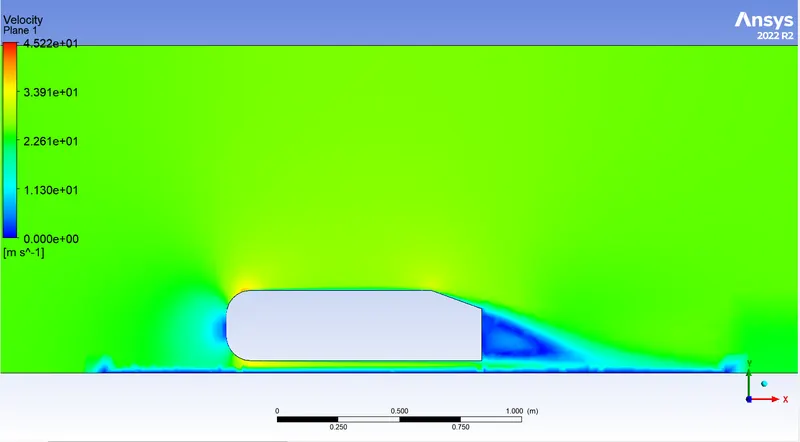
Post-processing: Velocity contour
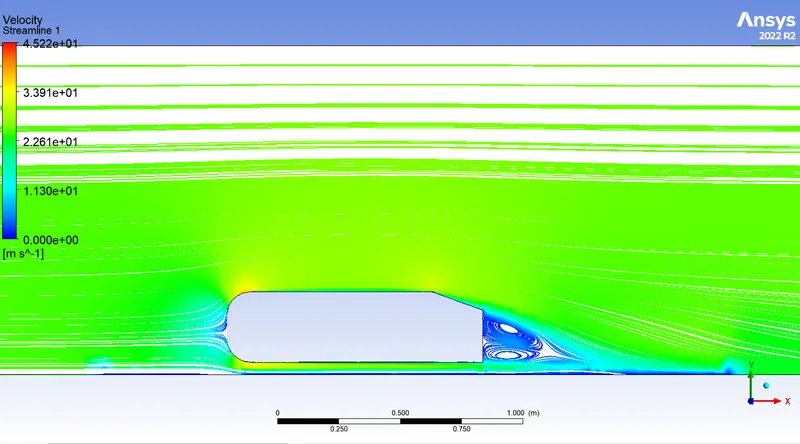
Streamline
Velocity u v/s Y coordinate
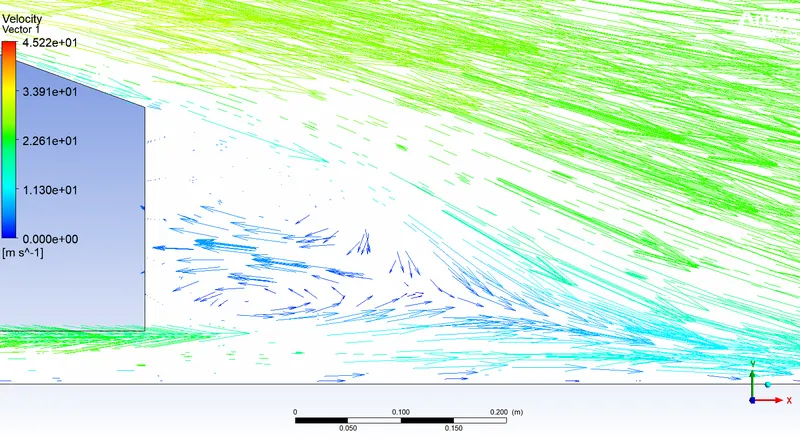
Wake formation
Grid dependence test-
| Mesh Description | No of Elements | Coeff of lift | Coeff of drag | Coeff of drag (experimental) | % difference |
| Default Mesh | 84073 | 0.1954 | 0.3703 | 0.33 | 12.21 |
| Refined Mesh 1 | 176359 | 0.2807 | 0.3636 | 0.33 | 10.18 |
| Refined Mesh 2 | 408575 | 0.2736 | 0.3401 | 0.33 | 3.06 |
Conclusion-
- The grid independency test shows the best results close to the experimental data. By refining the mesh size with the y+ factor, the error is significantly reduced.
- The y+ is chosen in between a stable range of 30 to 300 to give a correct prediction of velocity and pressure contour plots.
- As seen in baseline meshing no wake formation is captured properly, on refining the mesh, the flow is captured properly.
- The vectors and the streamlines clearly indicate that there is flow reversal due to low pressure behind the body.