Week 3 - External flow simulation over an Ahmed body.
REPORT ON EXTERNAL FLOW SIMULATION OVER AN AHMED BODY
AIM
External flow simulation over an Ahmed body and to run the simulation by considering the only half body
Also Describe Ahmed's body and its importance.
Explain the reason for the negative pressure in the wake region and
Explain the significance of the point of separation
Expected Results:
1. Velocity and pressure contours.
2. The drag coefficient plot for a refined case. ( For velocity of 25m/sec, the drag coefficient should be around 0.33).
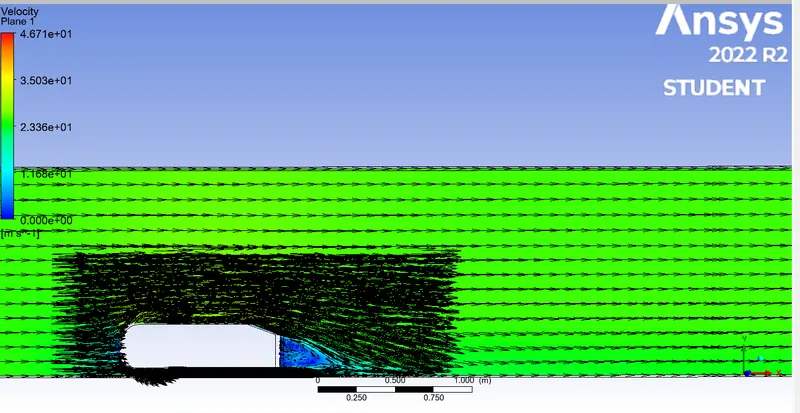
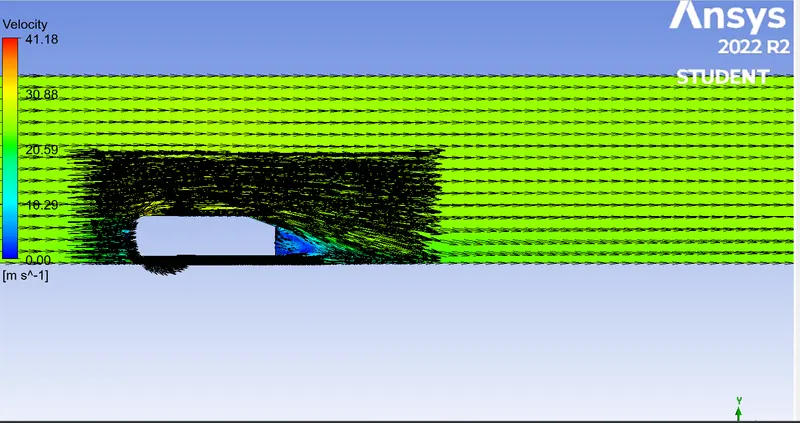
3. The vector plot clearly showing the wake region.
4. Perform the grid independency test and provide the values of drag and lift with each case.
THEORY
Ahmed Body
An Ahmed Body is a model of an automobile used to test ,develop, refine, and validate the latest generation of turbulence models for selected examples encountered in vehicle aerodynamics. Its shape is simple enough to allow for accurate flow simulation but retains some important practical features relevant to automobile bodies. This model describes how to calculate the turbulent flow field around a simple car-like geometry using the Turbulent Flow, k-epsilon and k-omega interface. Later, either experimentally or computationally it can be recreated all the same but with a desired geometry, new to come up to the market or a research.
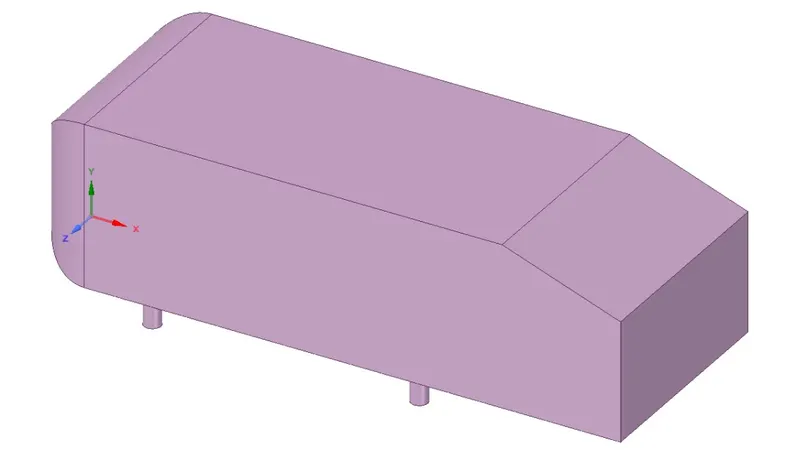
Two different rear body slant angles (25° and 35°) were considered, which happen to bracket the critical angle of 30° at which separated flow occurs within the wake of the slant.
Importance of Ahmed Body
The principal objective to study such a simplified car body is to tackle the flow processes involved in drag production. Through perceiving the mechanisms involved in creating drag one can be able to design a car to minimize drag and therefore reducing fuel consumption and maximize vehicle performance. The flow region which presents the major contribution to a car’s drag, and which poses severe problems to numerical predictions and experimental studies as well, is the wake flow behind the car. The location at which the flow separates determines the size of the separation zone, and consequently the drag force. Clearly, a more exact simulation of the wake flow and of the separation process are essential for the correctness of drag predictions. However, a real-life automobile is a very complex shape to model or to study experimentally which resulted in the creation of Ahmed Body.
Negative Pressure in the wake region
When the air moving over the vehicle is separated at the rear end, it leaves a large low pressure turbulent region behind the vehicle known as the wake. This wake contributes to the formation of pressure drag, which is eventually reduces the vehicle performance.
The wake is the region of disturbed flow (often turbulent) downstream of a solid body moving through a fluid, caused by the flow of the fluid around the body. Negative pressure is caused by seperation of flow and net pressure force is produced.
Significance of the point of separation
The point on the body at which the boundary layer is on the verge of separation from the surface is called point of separation or the separation point is the point where the air stops "sticking" to an object that is moving through the air. When an object is moving through the air, the air molecules push back on it and resist the object's movement - this resistance is called pressure drag. Due to the presence of point of seperation negative pressure is present and by increasing the slant angle helps in reducing the point of seperation and improve the performance of the vehicle.
Separation occurs in flow that is slowing down, with pressure increasing, after passing the thickest part of a streamline body or passing through a widening passage, for example. Flowing against an increasing pressure is known as flowing in an adverse pressure gradient.
The boundary layer separates when it has travelled far enough in an adverse pressure gradient that the speed of the boundary layer relative to the surface has stopped and reversed direction.
Flow separation is the detachment of a boundary layer from a surface into a wake. In aerodynamics, flow separation results in reduced lift and increased pressure drag, caused by the pressure differential between the front and rear surfaces of the object.
PROCEDURE
Geometry of Ahmed body
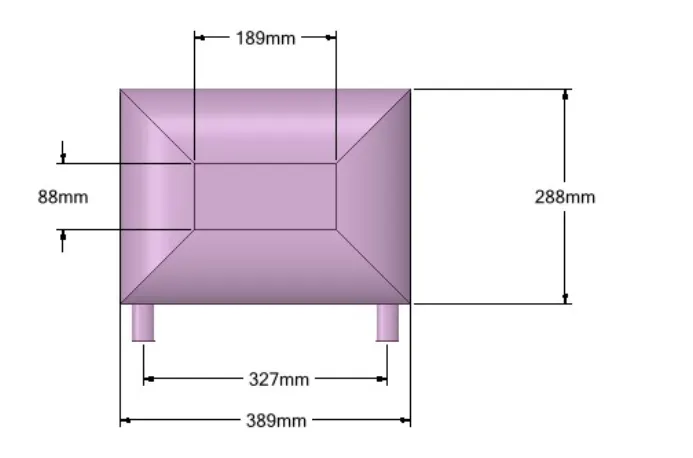
Ahmed body front view
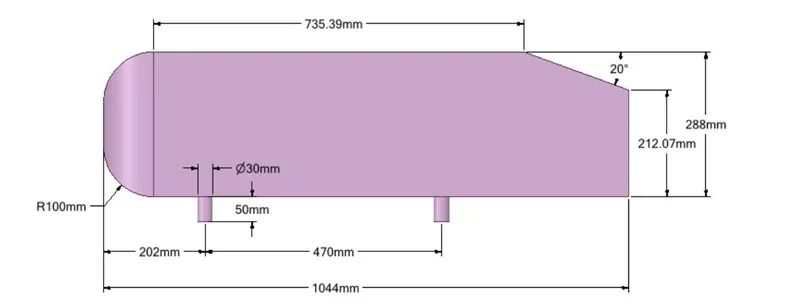
Ahmed body side view
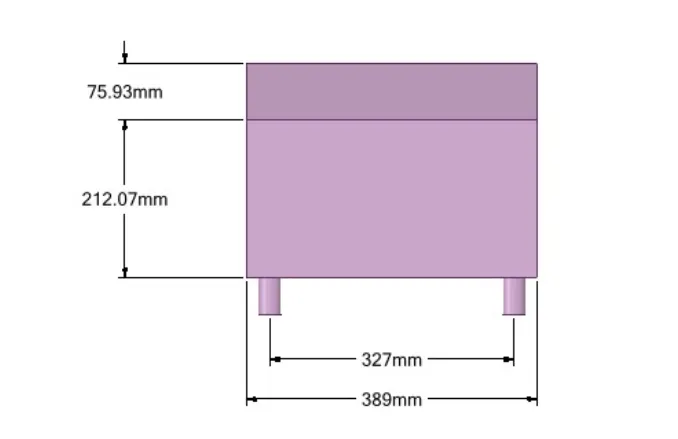
Ahmed body rear view
At first we create the geometry by enclosing the Ahmed Body inside a box of 5m length towards the trailing edge, 2m towards the left side and 2m in height and we again create an enclosure inside the encosure for getting more accurate values with more refinement.

The steps required to complete the enclosure is shown below
Form a bigger computational domain using the Enclosure option in Spaceclaim as per the below dimension.
The bigger enclosure is shown below:
Form a smaller computational domain using the Enclosure option in Spaceclaim as per the below dimension.
The second enclosure is shown below:
Our geometry of Ahmed body is perfectly symmetric so using Split Body option in Spaceclaim allows us to reduce nos. of cells and brings out an accurate result using lesser nos. of cells at a lower computational time. Here, we are simulating only half of complete domain.
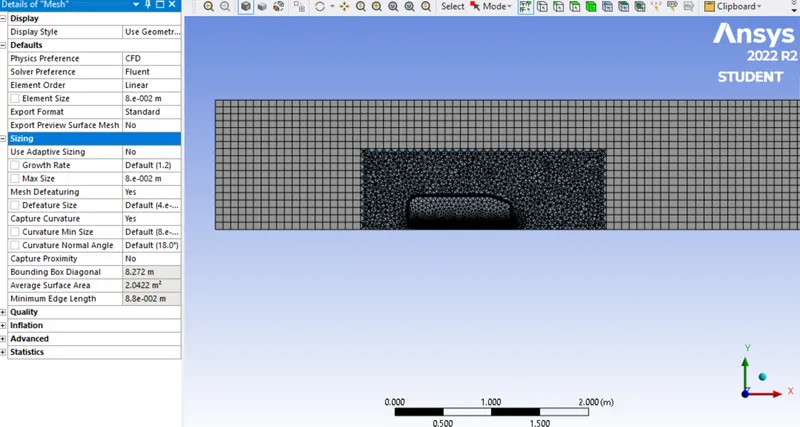
Initially there was a huge interference between the Outer and Inner encloser so that the mesh gets overlapped which gets not acceptable so to avoid this we made share topology and get deleted the Interference region that by using the interference command after this we get a good interaction between the Inner and Outer enclosures so that we can get the mesh properly and also share the boundaries for the fluid flow.Here shows the image below.
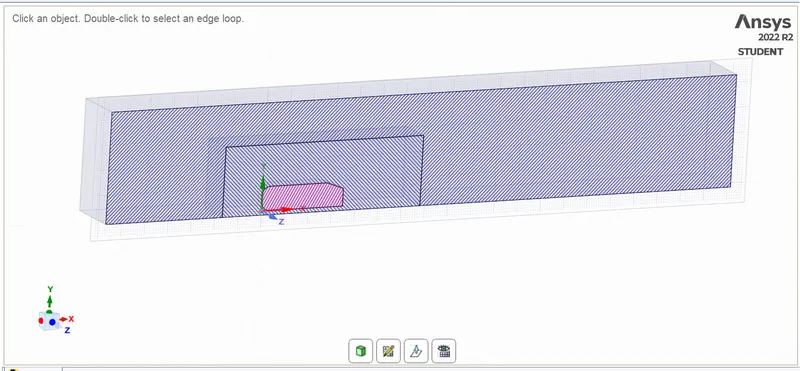
Then we remove the interference and then start the meshing process.
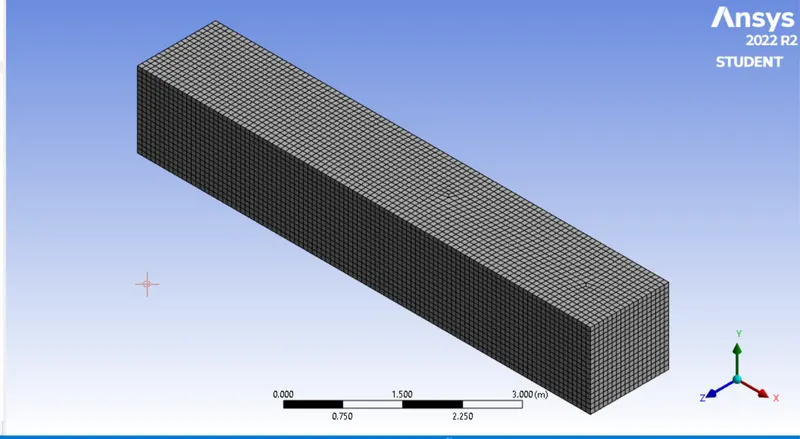
Then we proceed into meshing at first baseline meshing is done and the output values are noted .
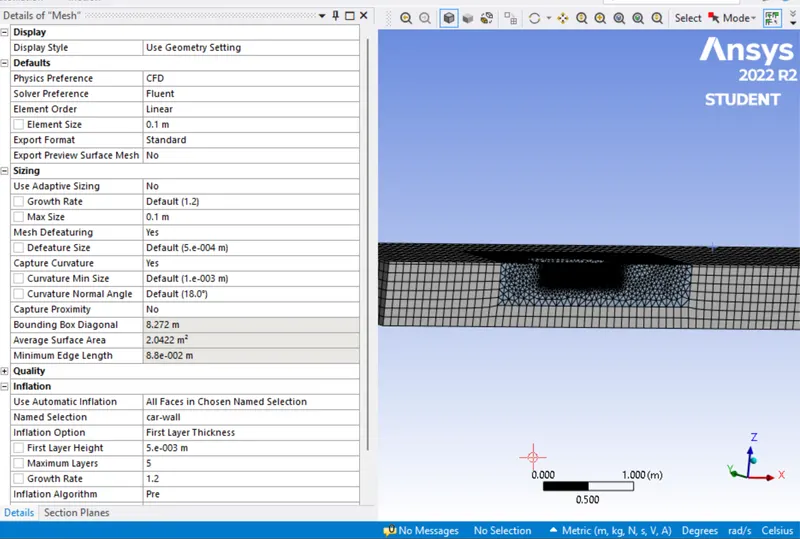
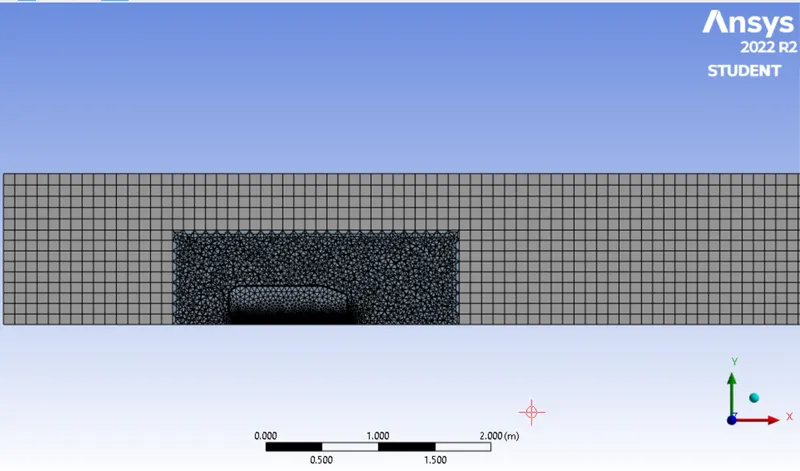
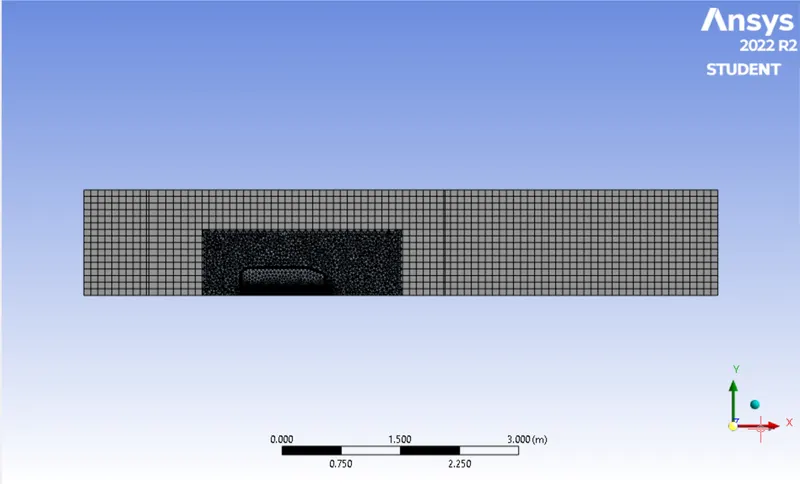
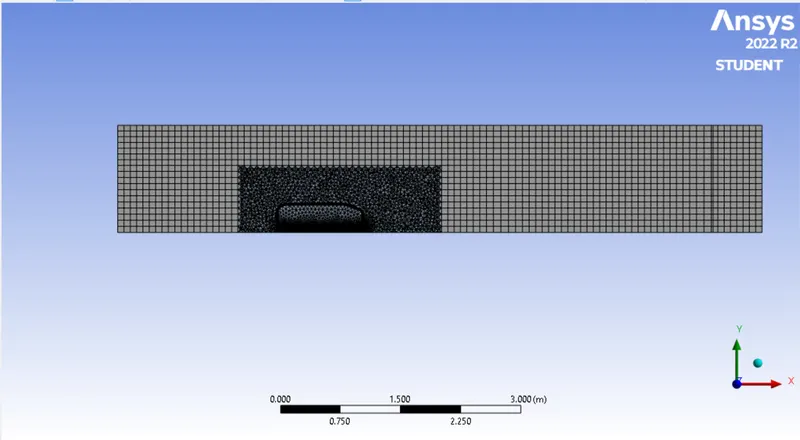
As the values generated as output are not refined then the meshing is carried out using the hexahedral for the outer box and tetrahedral grid and inflation layers are also provided for getting refined value.
We also need to name the sections as inlet, outlet, car-wall, and symmetry.
Then we start the set up by first checking the mesh and then we set up the solver where we use steady state pressure based solver and we use the K-epsilon viscous model
We can use K-omega model also it gives the details near the surface wall which will be more accurate than K-epsilon model as it gives the velocity and pressure profile away from the wall.
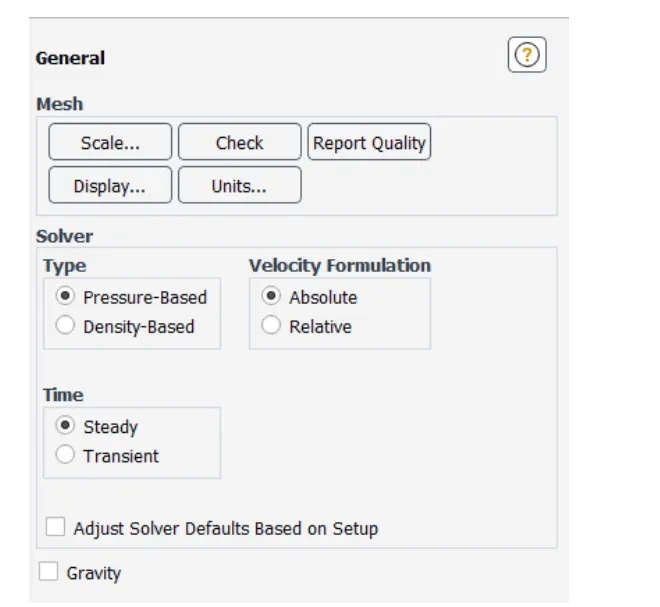
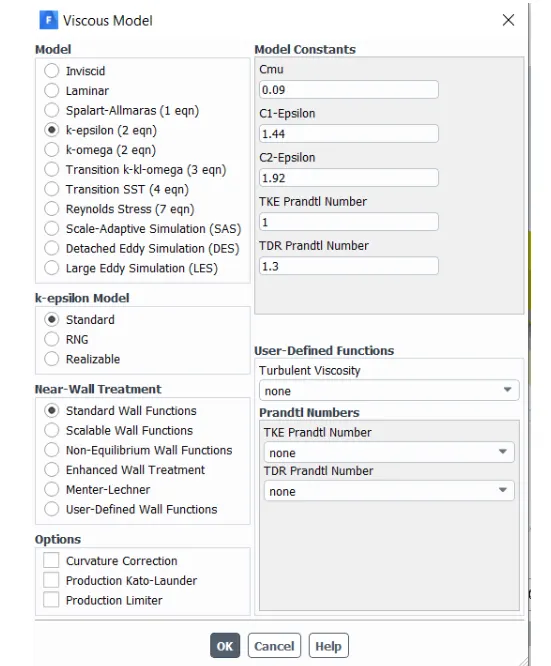
Here we use the pressure-based solver because the mach number is less than 0.3
Then we give the inlet boundary condition as 25 m/s as the inlet velocity profile and the outlet boundary condition as the 0 pa
Then we give the referance values like temperature, velocity, area,length etc. to get the desired output
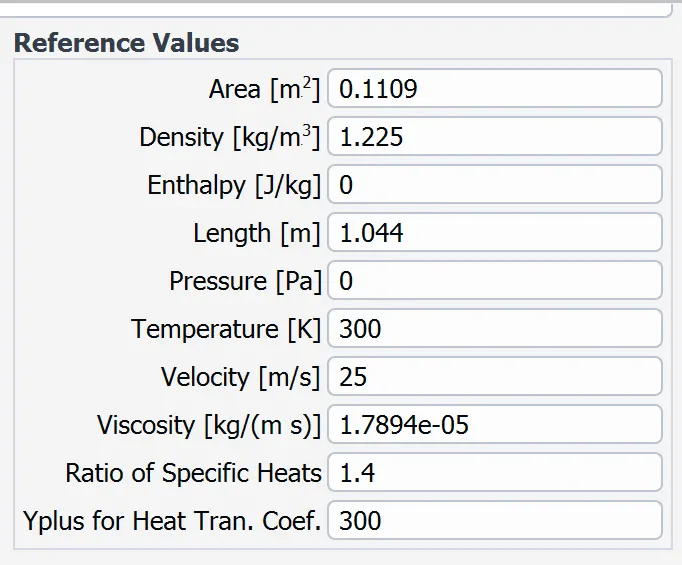
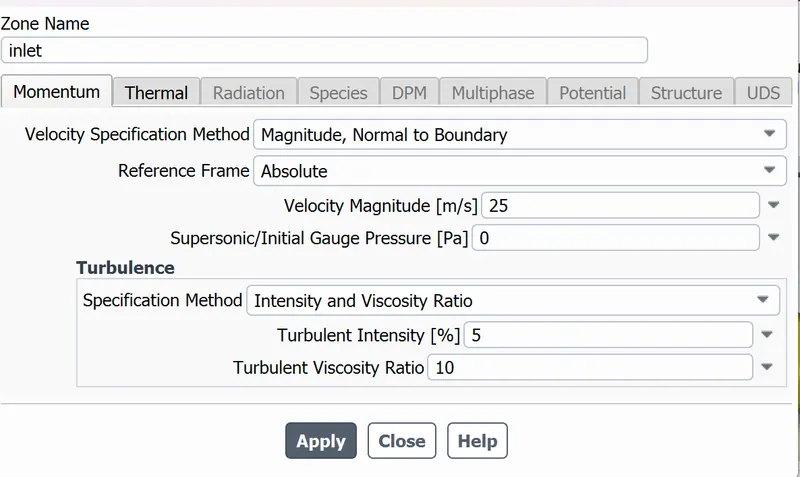
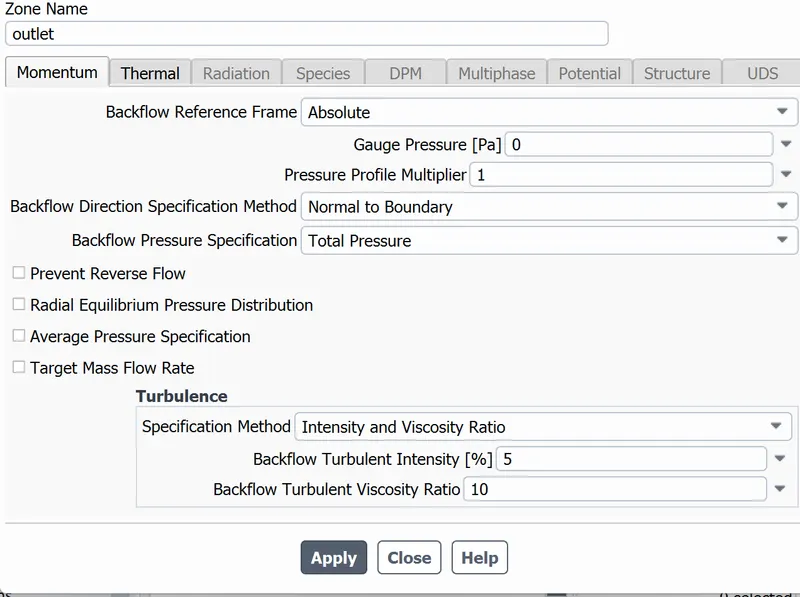
After selecting the lift and drag plot we initialize the solution and create a baseline velocity and pressure contour plot for the same
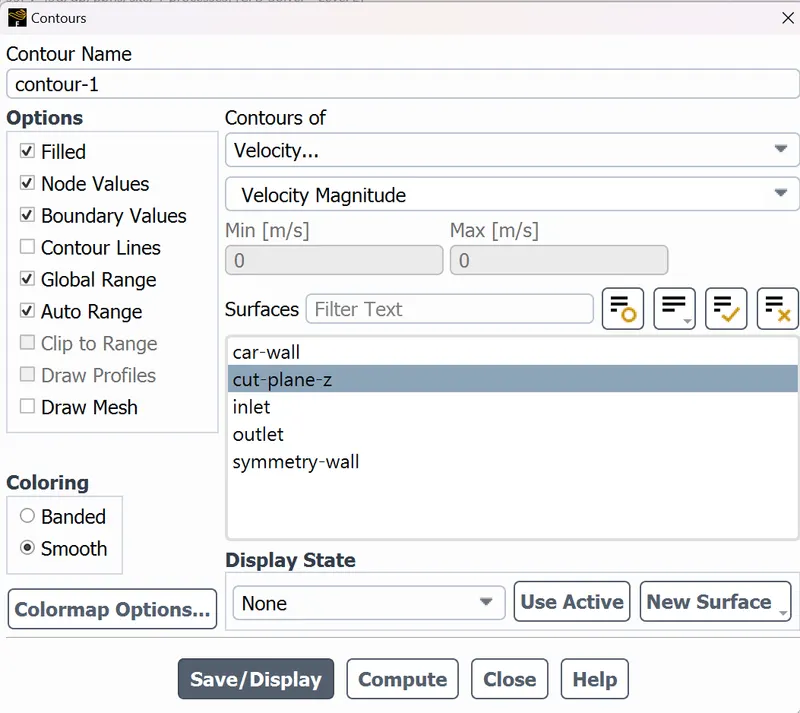
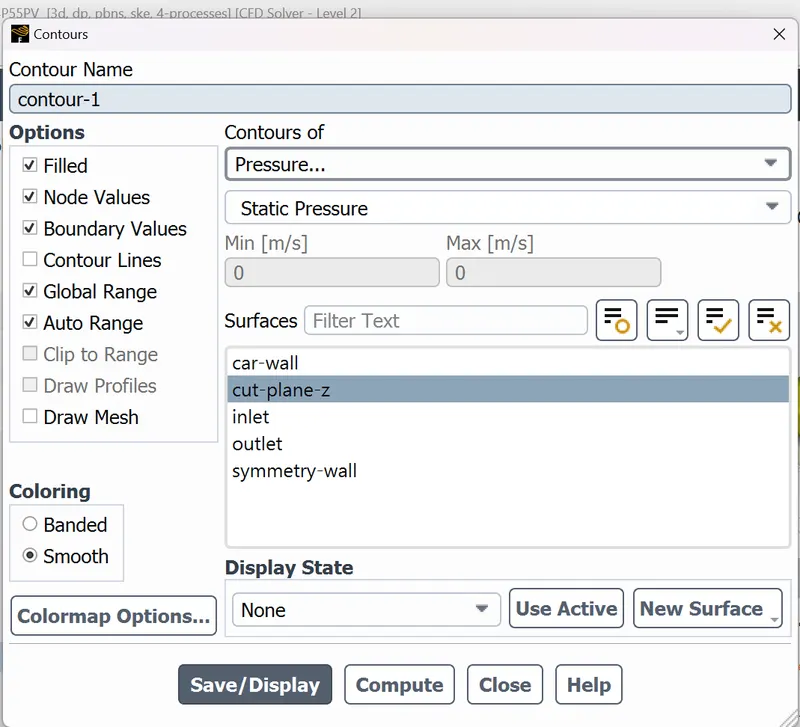
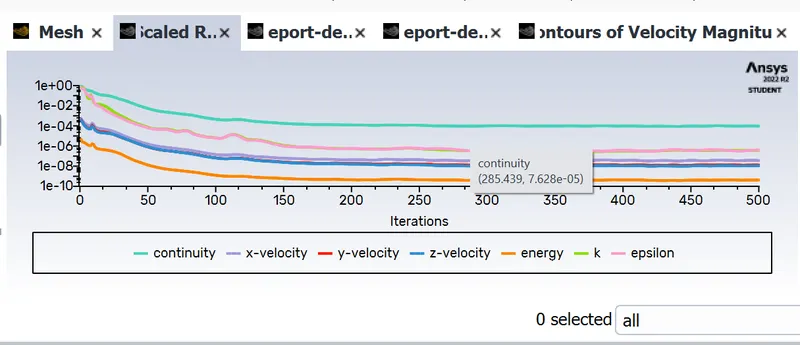
Then we create the animations using the solution animation command in the activities and then we run the solution for 500 iterations
We also create the chart using the line command in the post processing section
RESULTS
Case 1: At base line set up, size of cells as 0.1 m, body size of 0.05m , face sizing of 0.005 and with the inflation layer using first layer thickness at first layer height of 0.005
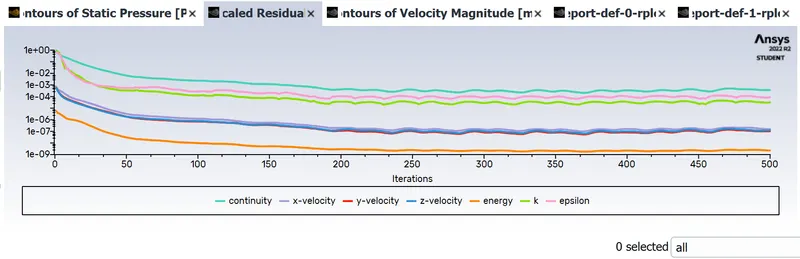
Residuals
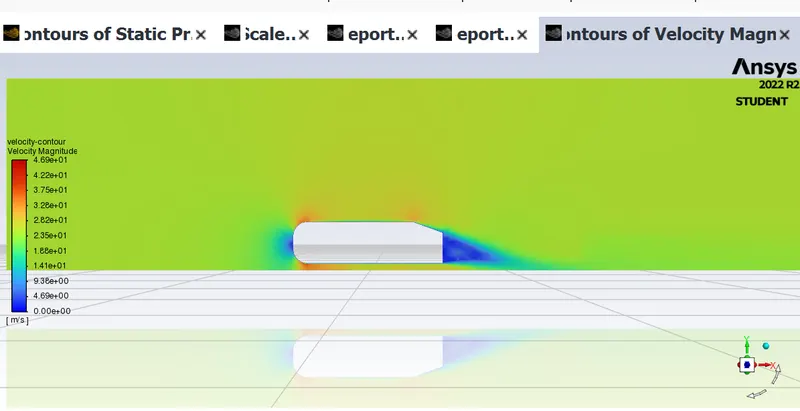
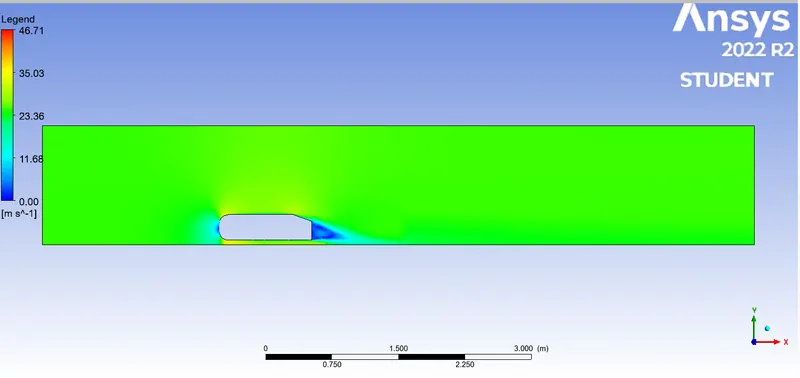
Velocity contour plot
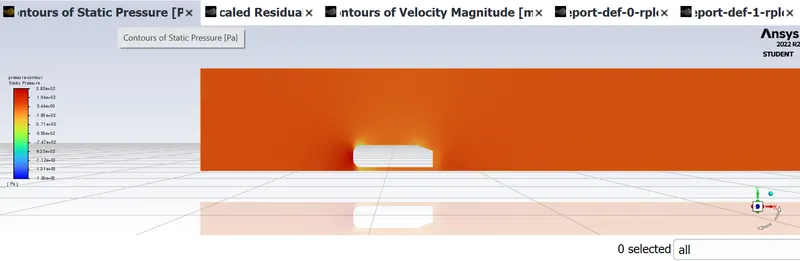
Pressure contour plot
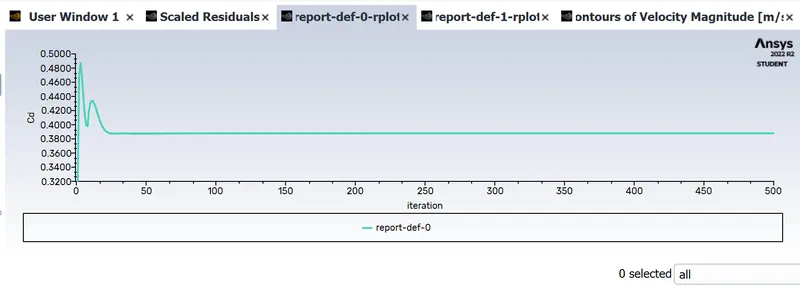
Coefficient of Drag
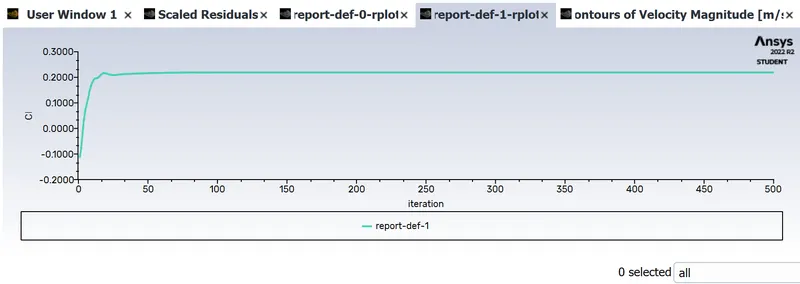
Coefficient of Lift
Vector plot
Case 2:
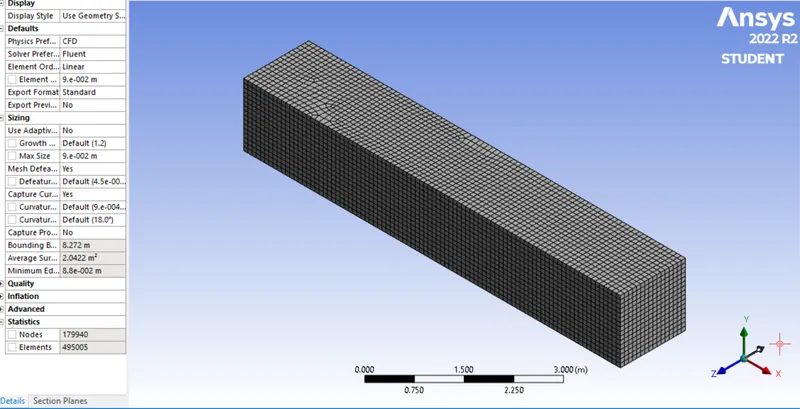
The size of cells at hexahedral meshing is 0.09 m, body size of 0.05m , face sizing of 0.005 and with the inflation layer using first layer thickness at first layer height of 0.005
Residuals
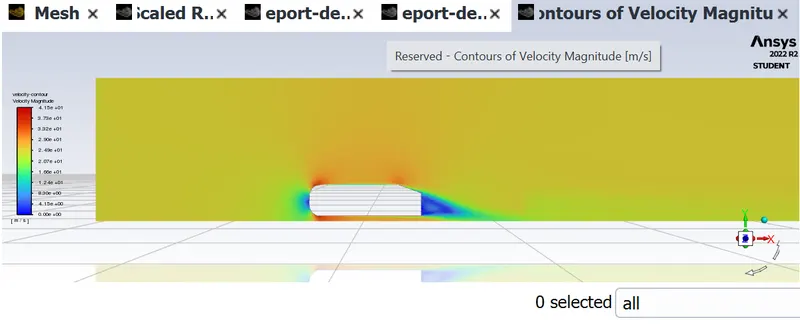
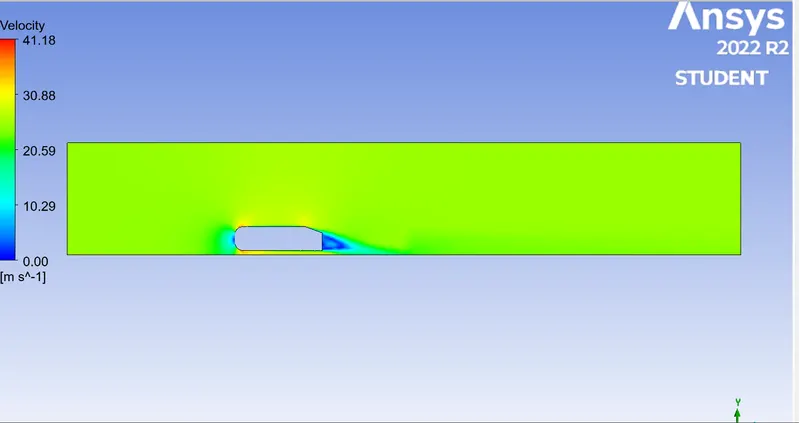
Velocity contour plot
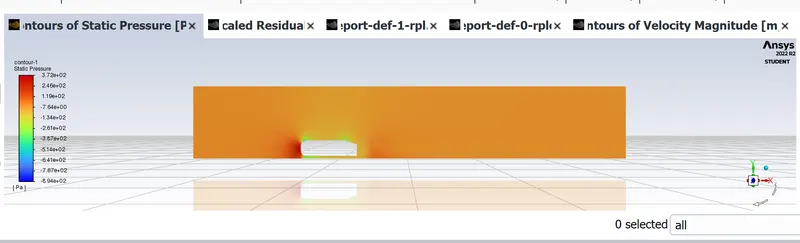
Pressure contour plot
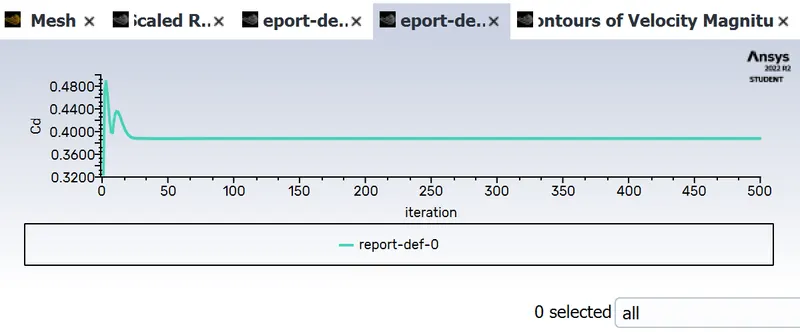
Coefficient of Drag
Coefficient of Lift
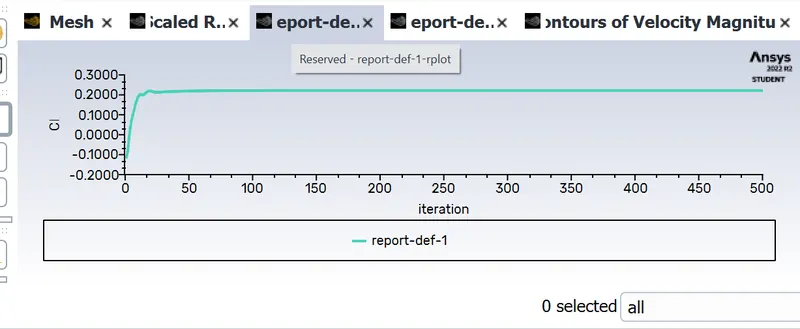
Vector plot
Case 3 :
The size of cells at hexahedral meshing as 0.08 m, body size of 0.05m , face sizing of 0.005 and with the inflation layer using first layer thickness at first layer height of 0.005
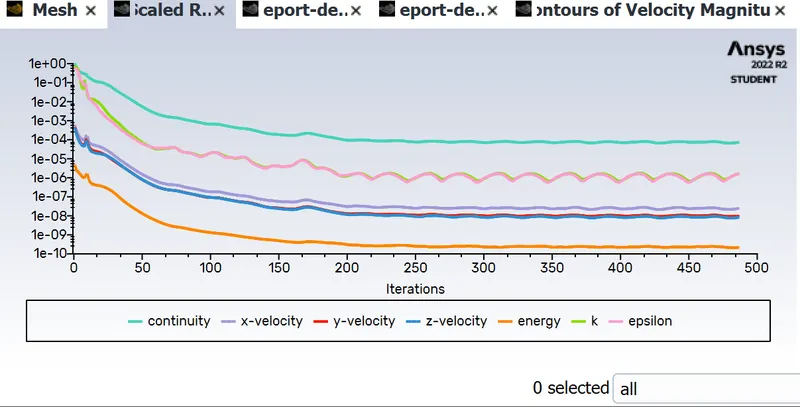
Residuals
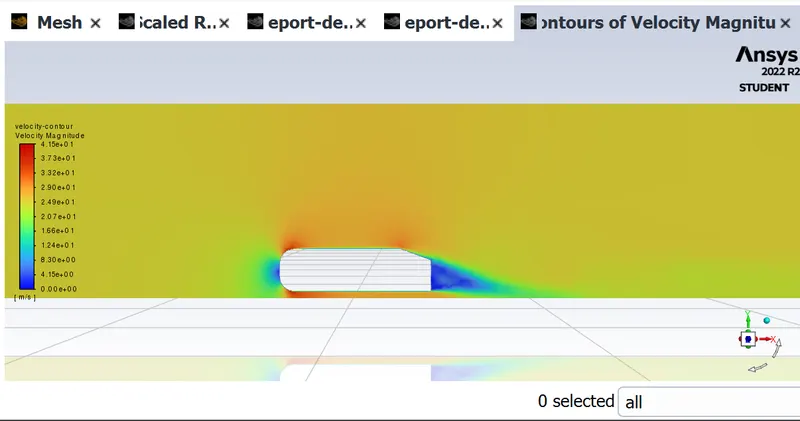
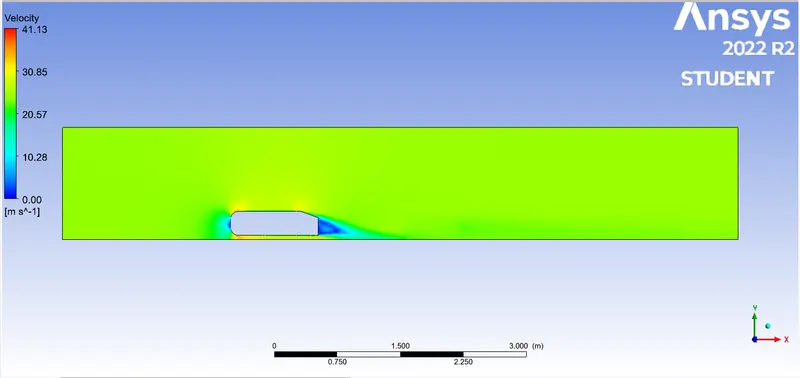
Velocity contour plot
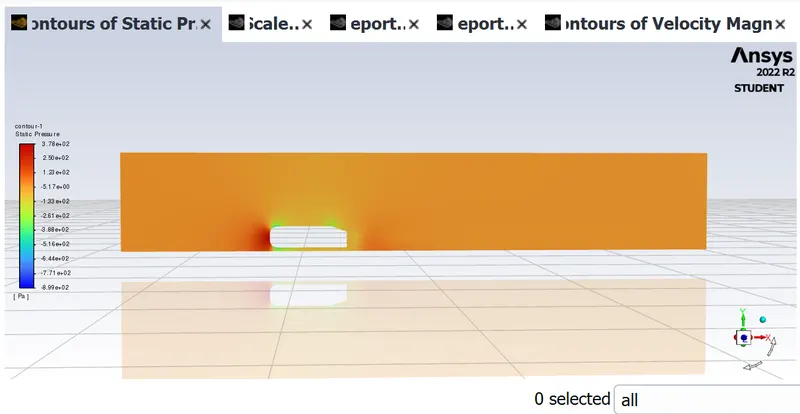
Pressure contour plot
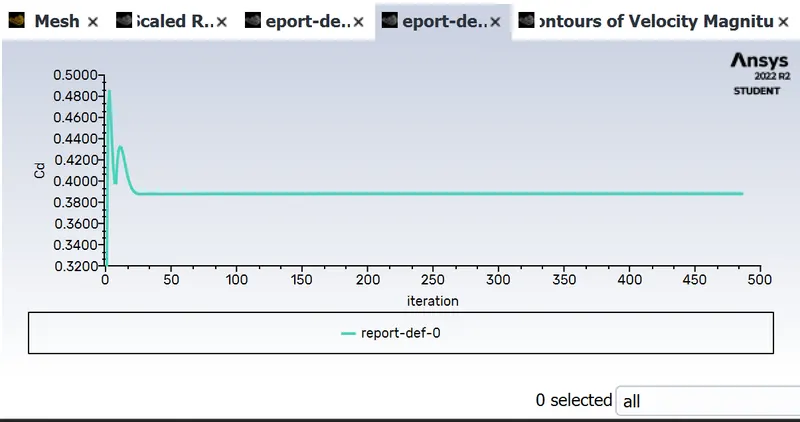
Coefficient of Drag
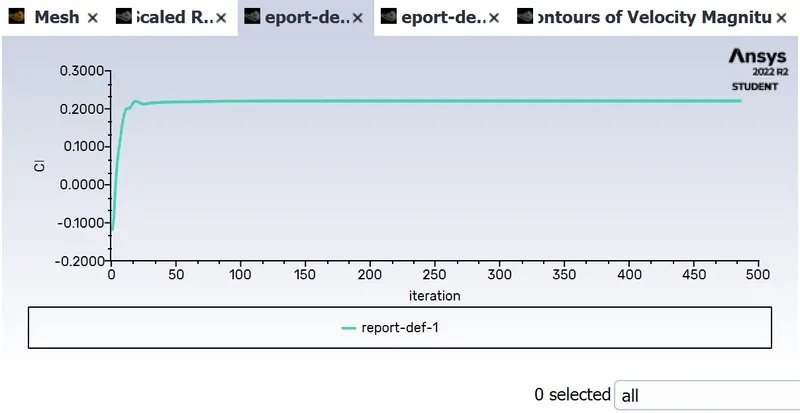
Coefficient of Lift
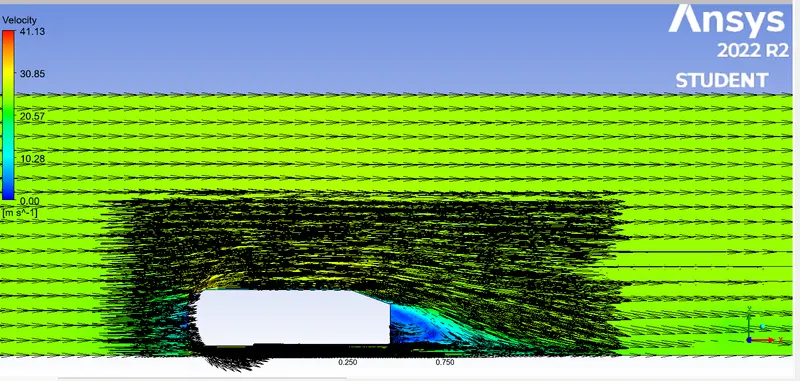
Vector plot
Grid independence test:
Number of elements Number of Nodes drag co-efficient(Cd) Lift co-efficient(Cl)
478547 170854 0.3981 0.2387
495005 179940 0.3876 0.2236
491508 189804 0.3760 0.2249
CONCLUSION
After completing the simulation from the output generated we can conclude that the experimental value of coefficient of drag is 0.33 for 25 m/s and we get a value of 0.37 which is almost accurate, also we know that the experimental value of cd ranges from 0.25 t0 0.45 thus makes our result well within the range.
The first mesh with element size 0.1 gave a poor result, it wasn't able to capture the flow around the Ahmed body and the wake structure, due to coarse mesh.
The refined mesh gave better results. The plots show the wake formation accurately and the flow around the Ahmed body was also captured pretty well.
There is a variation of pressure across the Ahmed body. The pressure in front of the body is positive because that's the location where the flow first comes in contact with the body and comes to rest. At the corner, the flow accelerates, thereby decreasing the pressure.
The reason behind negative pressure in the wake region is due to flow separation, recirculating flow. It's a phenomenon that generally happens as the air moving past the body isn't able to pass through the immediate backside of the body creating a region, where there is no movement of air and thereby creating a pressure gradient.
As the wake flow is the main contributor to the drag force(pressure drag), the point of separation is an important aspect of the flow. The more attached the flow is to the body the recirculation zone will be smaller and hence reduce the adverse effect of pressure drag, improving the fuel efficiency of the body.
REFERENCE
Flow and Turbulence Structures in the Wake of a Simplified Car Model
Experiments and numerical simulations on the aerodynamics of the Ahmed body