Week 3 - External flow simulation over an Ahmed body.
TITLE
Flow Over Ahmed body
OBJECTIVES
Describe what is Ahmed body
Simulate flow over ahmed body
Indicate various aspects being measured and why
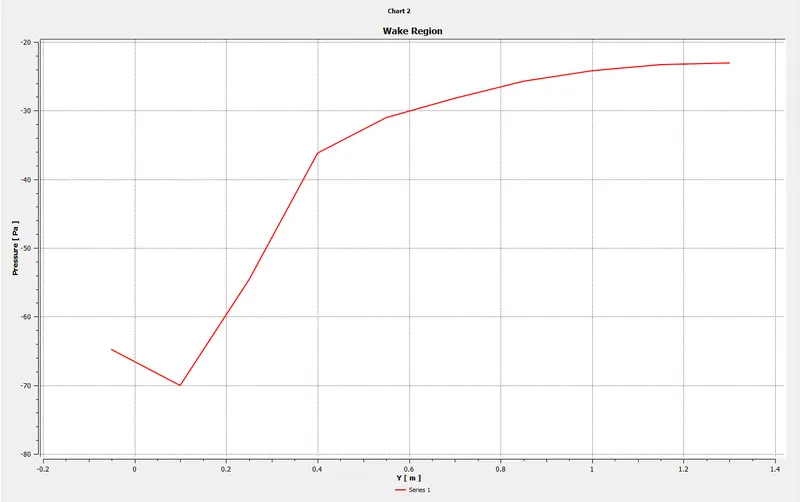
Explain the reason for the negative pressure in the wake region.
Explain the significance of the point of separation.
------------------------------------------------------------------------------------------------------------------------------------------------
AHMED BODY
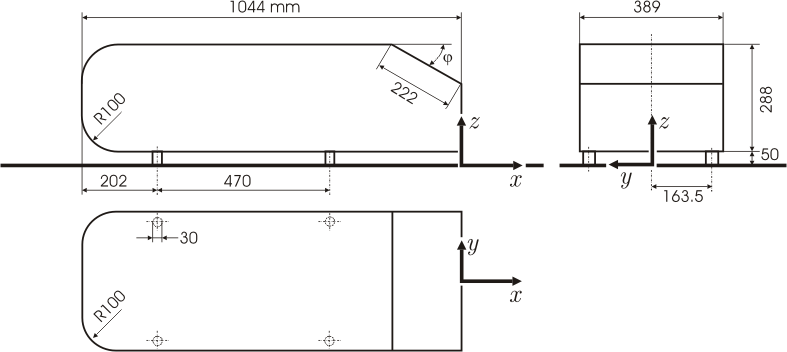
The Ahmed body is a generic car body (a simplified vehicle model). The airflow around the Ahmed body captures the essential flow features around an automobile and was first defined and characterized in the experimental work of Ahmed . Although it has a very simple shape, Ahmed body allows us to capture characteristic features that are relevant to bodies in the automobile industry.
This model is also used to describe the turbulent flow field around a car-like geometry. Once the numerical model in validated, it is used to design new models of the car.
GEOMETRY:
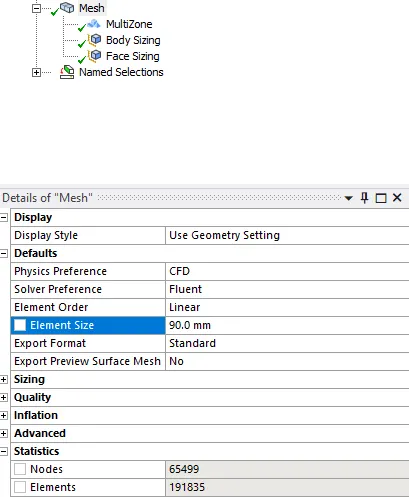
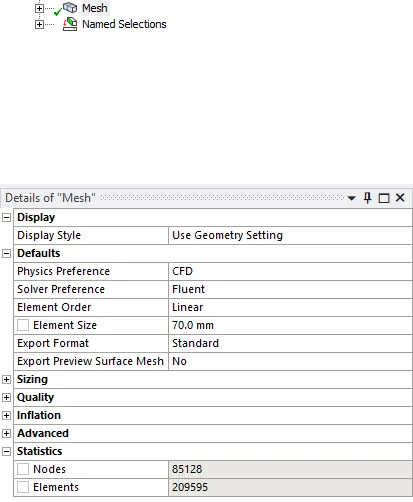
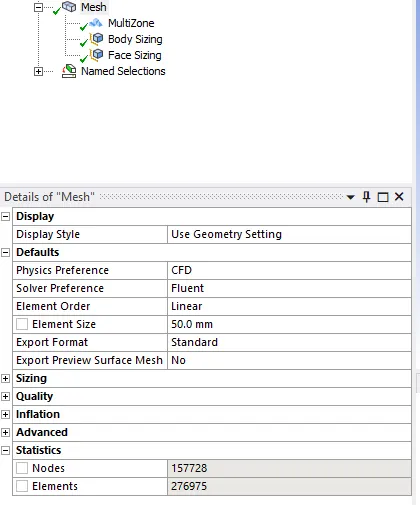
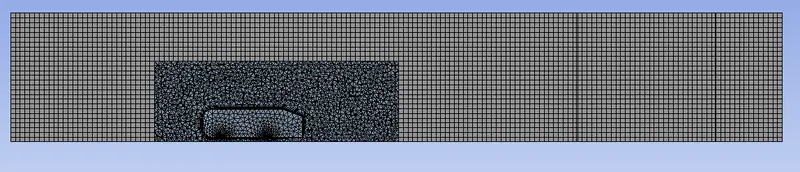
MESH DETAILS
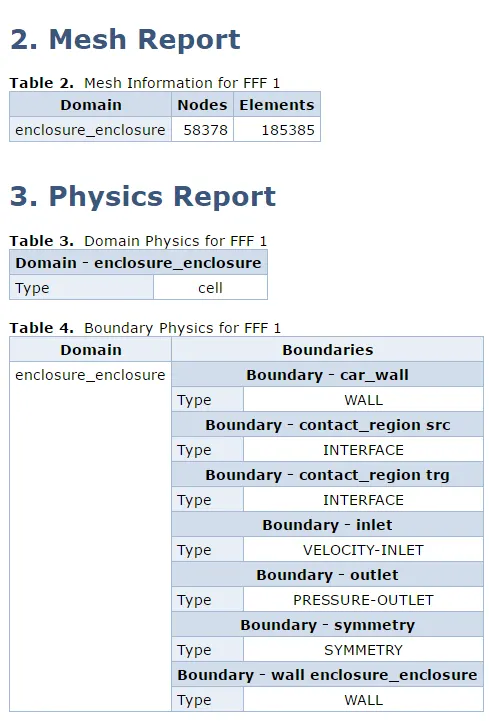
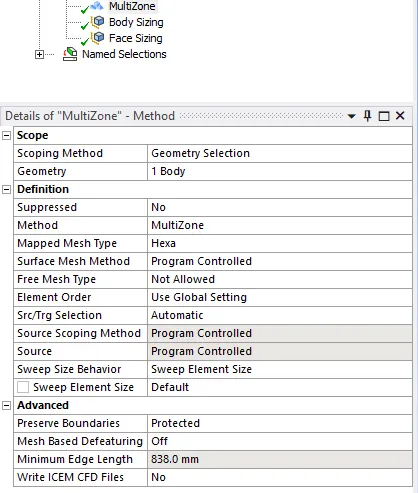
Multizone
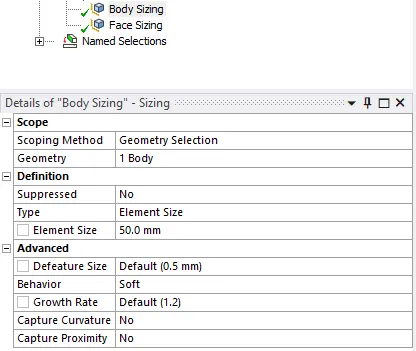
Body Sizing
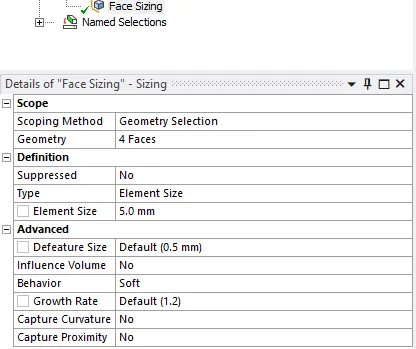
Face sizing
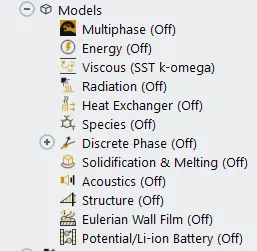
MATERIALS USED
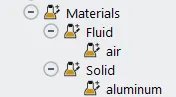
BOUNDARY CONDITIONS
Velocity at inlet is 25m/s
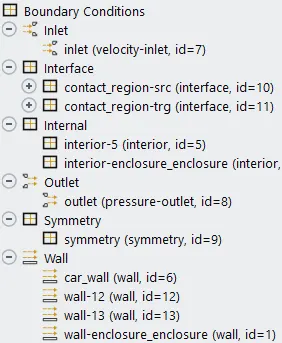
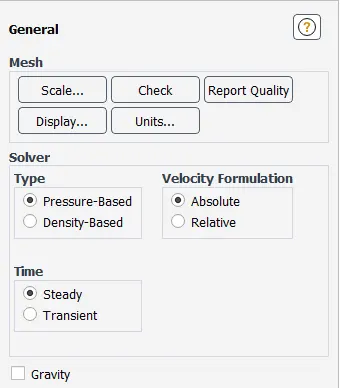
Solution Details
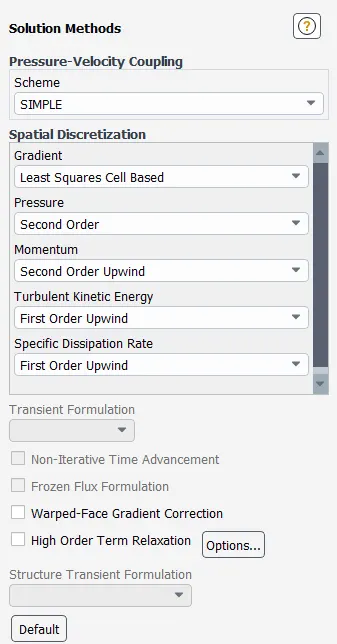
------------------------------------------------------------------------------------------------------------------------------------------------
------------------------------------------------------------------------------------------------------------------------------------------------
RESULTS
So after running the simulation we got the following results. Ive divided the simulation into 6 cases with Element size being the only change among the cases for the grid independancy test.
Case 1
Element size 100mm
Each case will have a chart plotting the pressure and velocity along the y-axis with a line probe placed before and after the wake region, a velocity and pressure contour plot along different axes. And a final tabulation of the results
highlighting the grid independancy test.
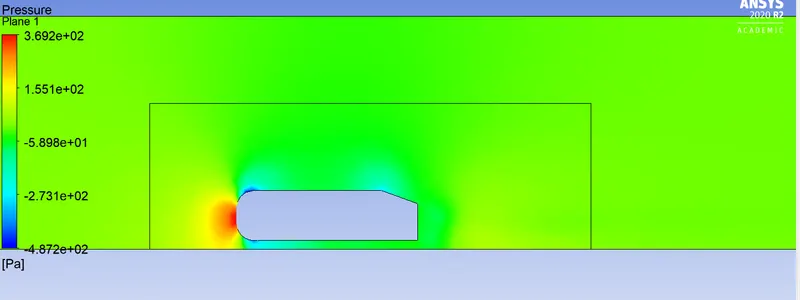
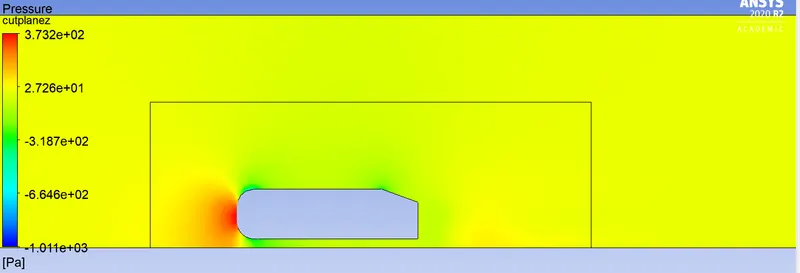
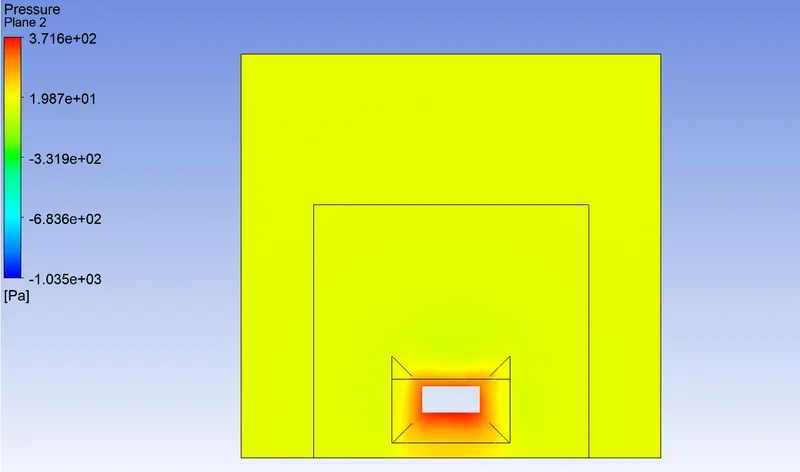
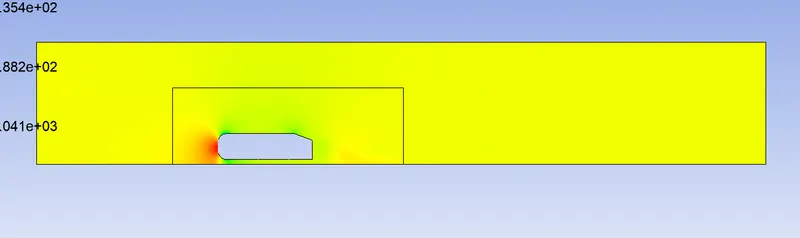
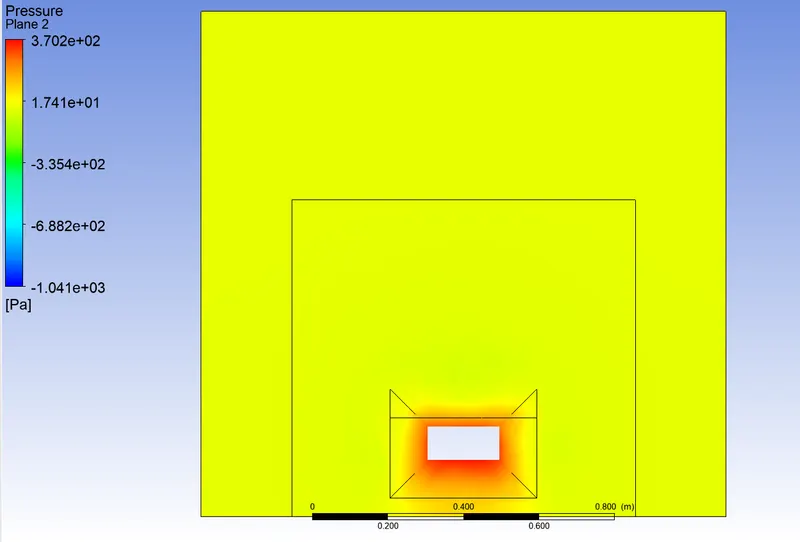
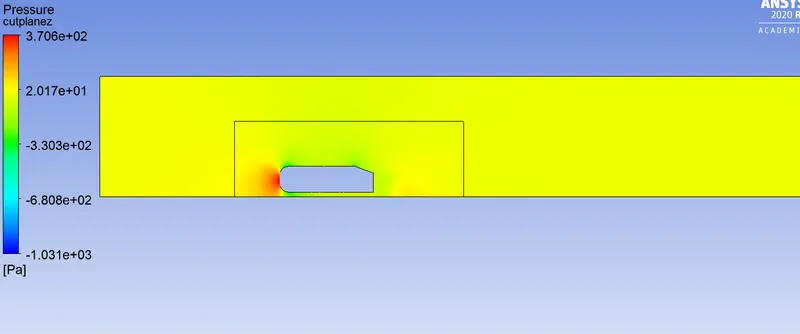
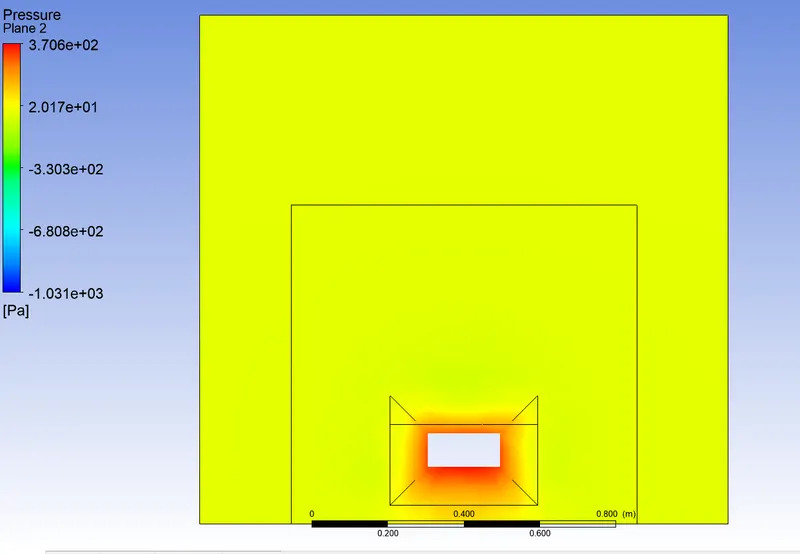
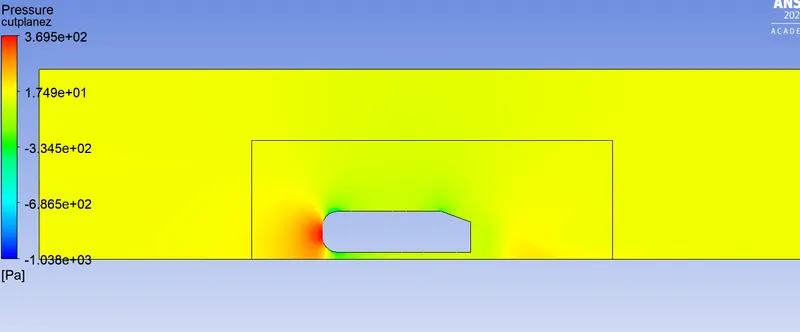
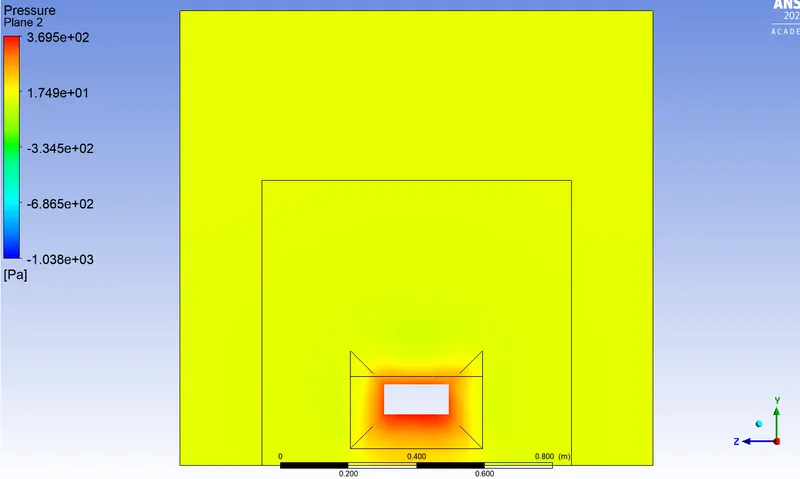
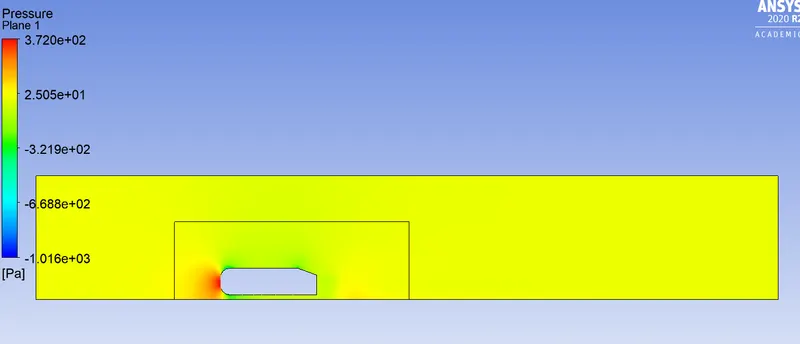
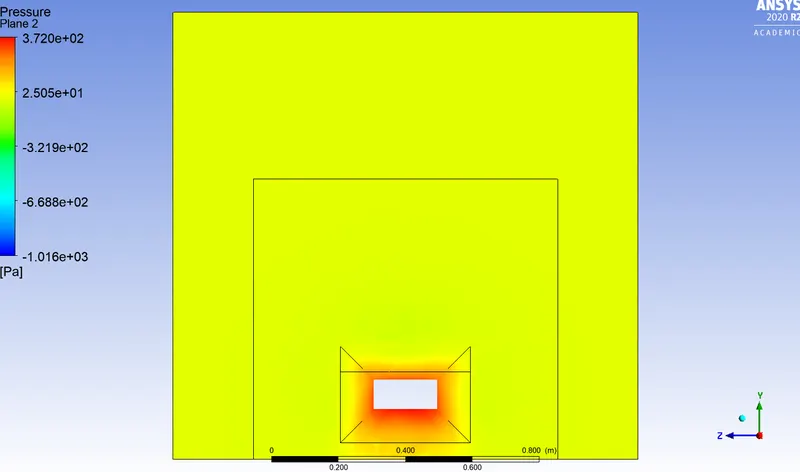
This is the final pressure contour plot we got after the calculation. This contour focuses on how the pressure is distributed globally. Below you can find the same with local pressure distribution. Here we can see
that the pressure shows change on the surfaces coming in contact with the ahmed body. This shows the physics is right.
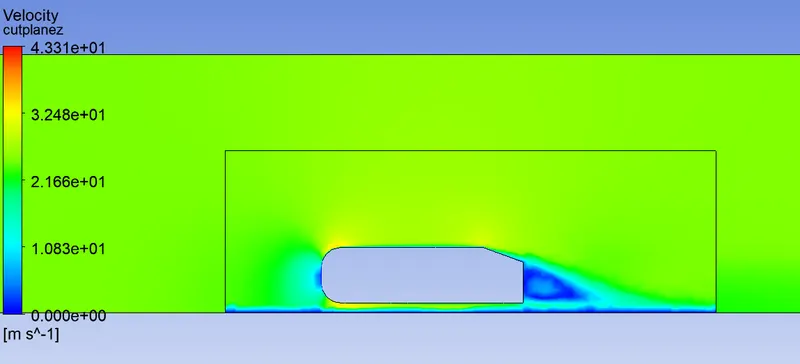
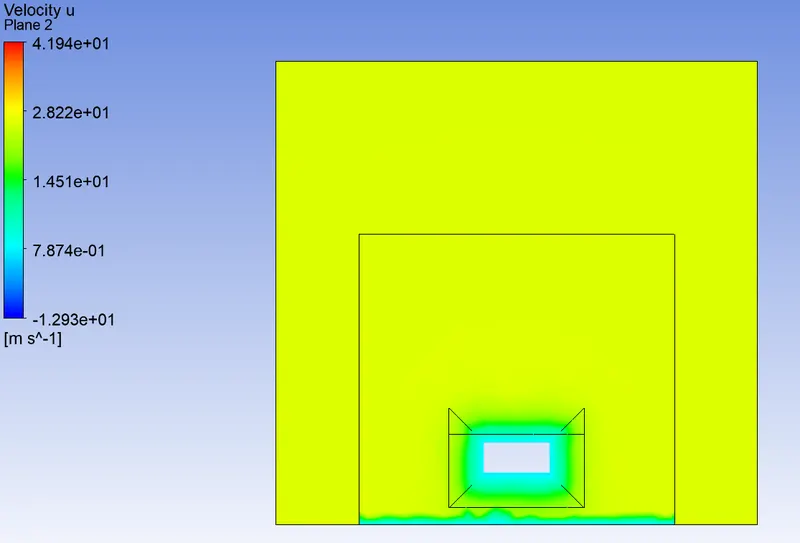
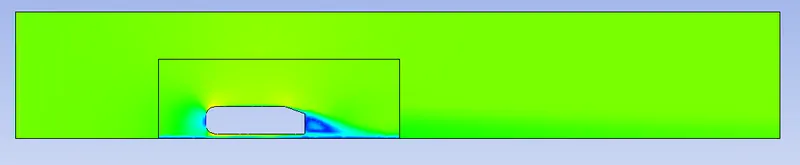
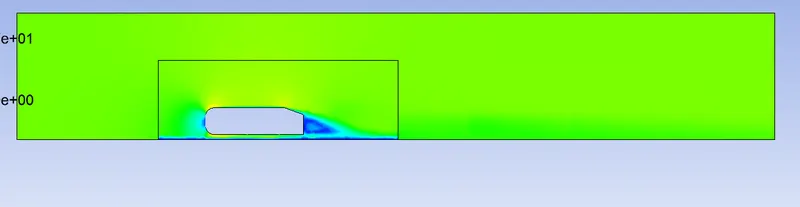
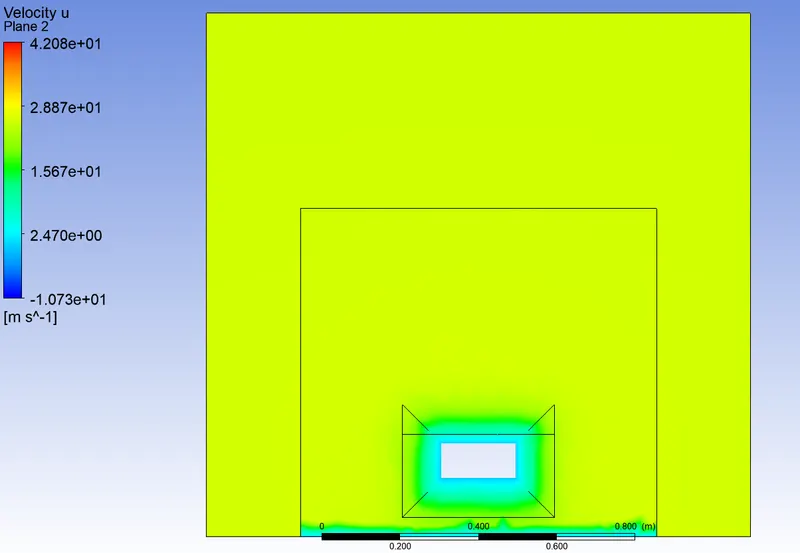
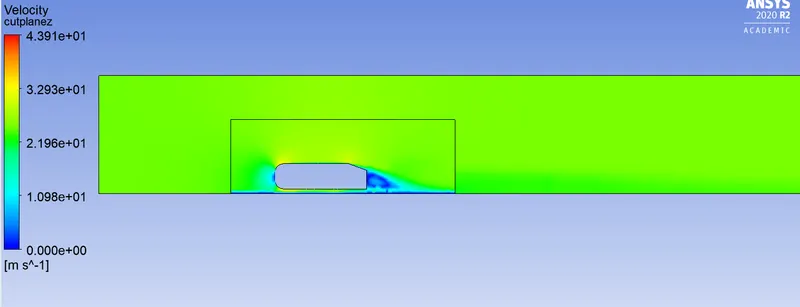
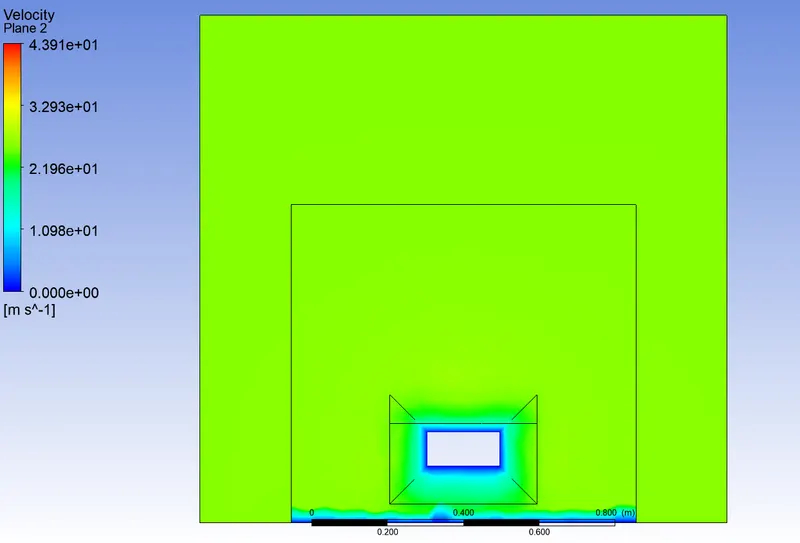
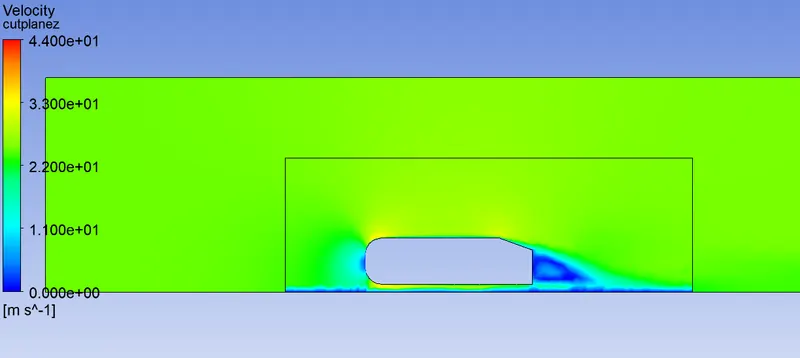
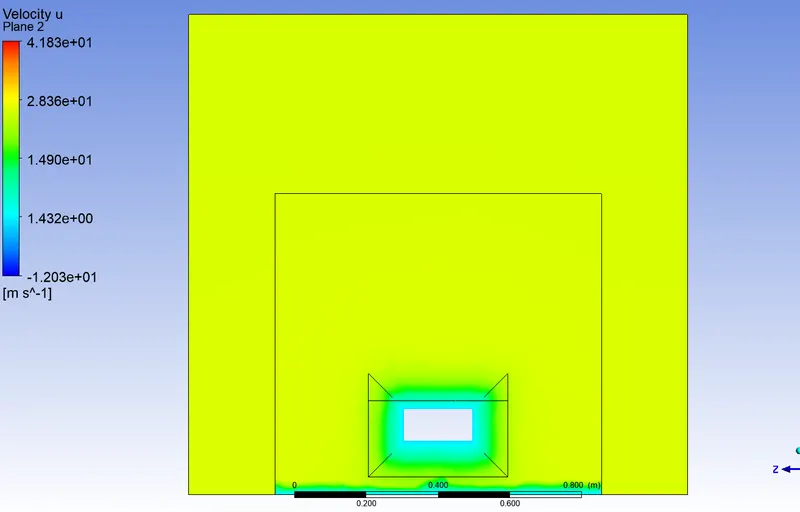
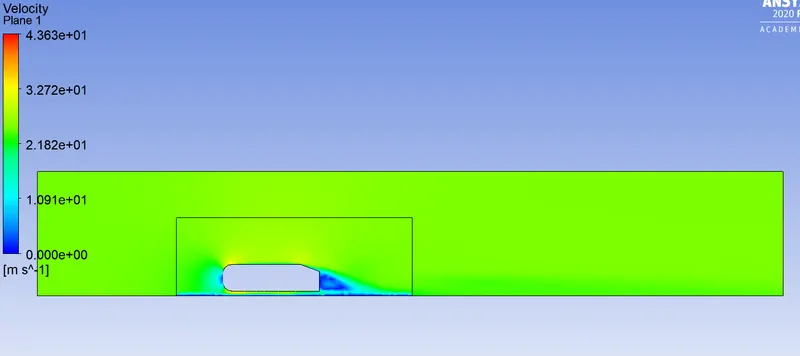
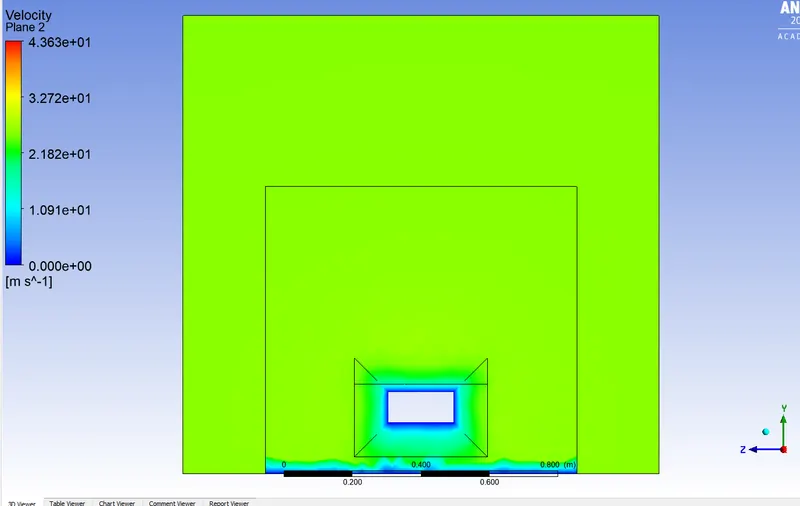
Below you can see the velocity contour on the plane placed on the z axis. This shows us how the velocity is affected. As you can see there is a blue shade in the wake region. And with the reference scale we can say that
the velocity in the wake and just after the wake region will be less than what it was before interacting with the ahmed body. We can almost say velocity is zero in the wake region.(with graphical data)
------------------------------------------------------------------------------------------------------------------------------------------------
Drag
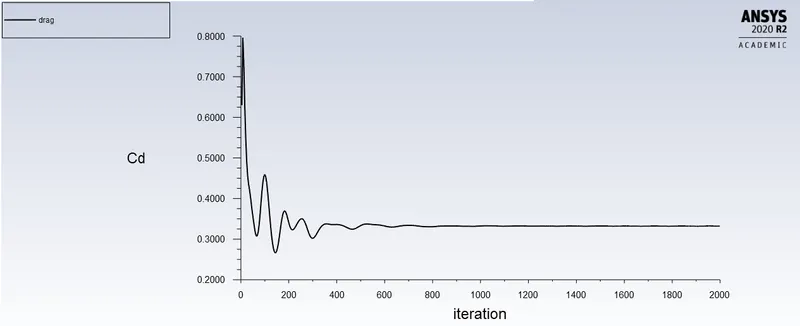
Drag coefficient = 0.34
------------------------------------------------------------------------------------------------------------------------------------------------
Lift
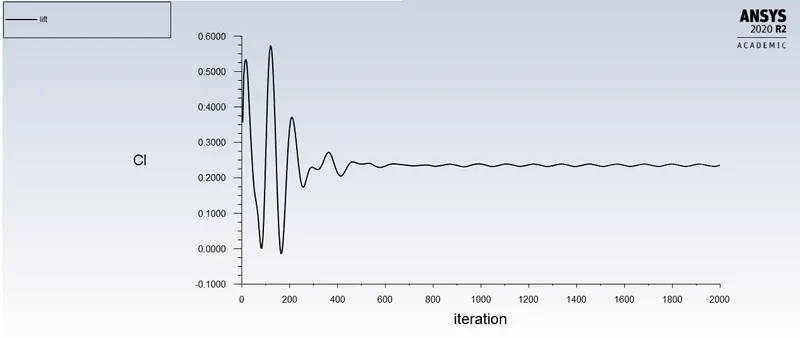
Lift coeff = 0.277
------------------------------------------------------------------------------------------------------------------------------------------------
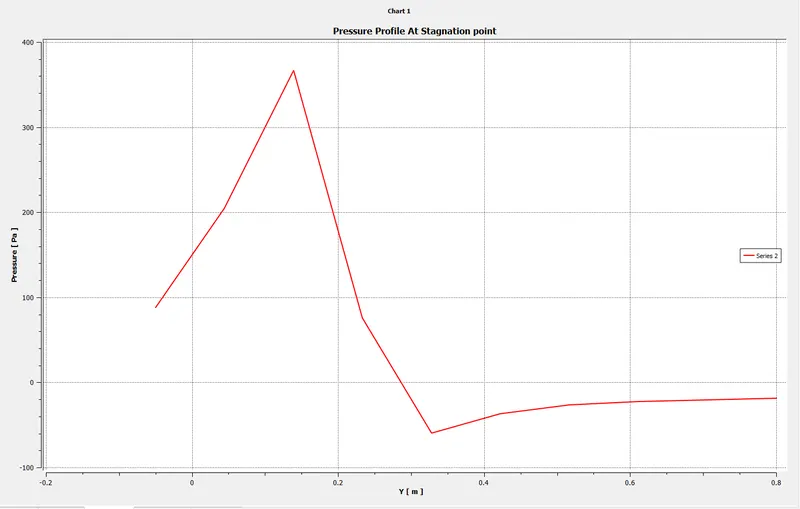
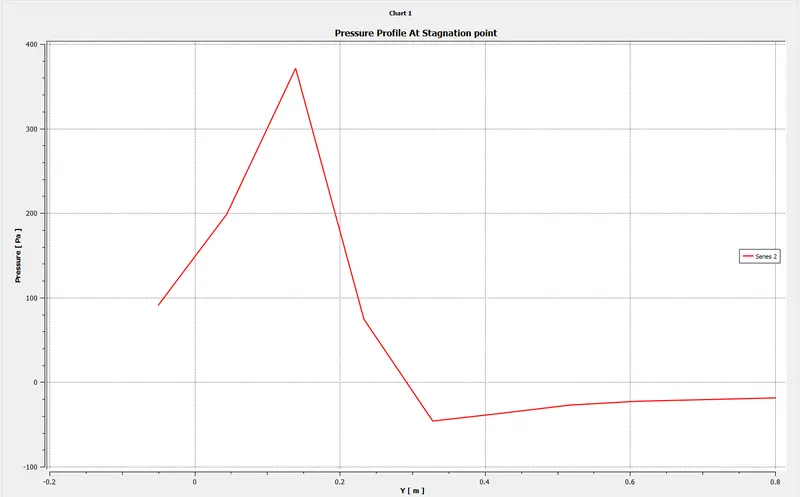
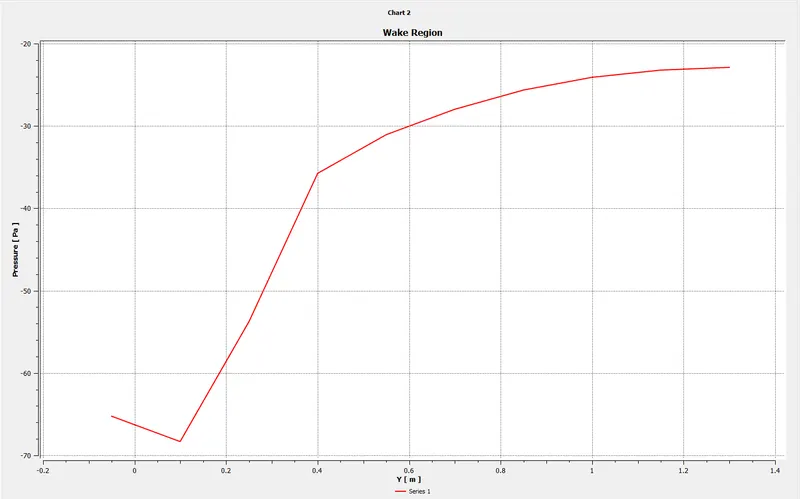
pressure at Stagnation point and wake region
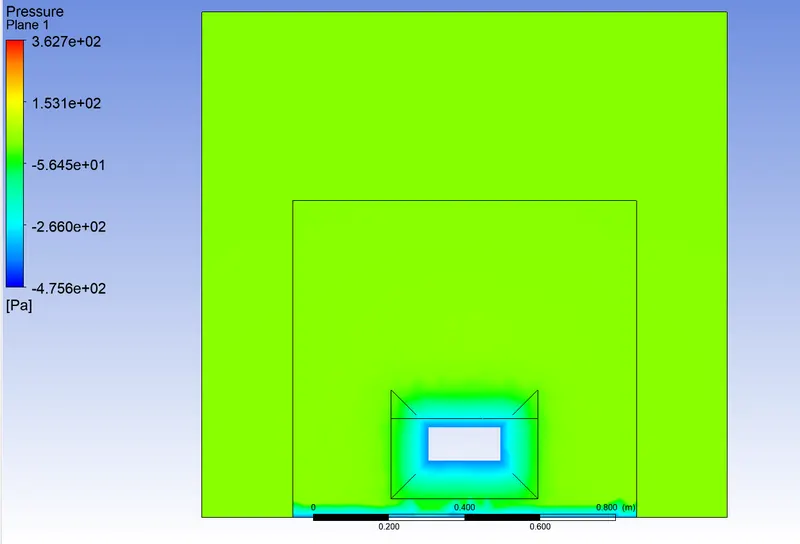
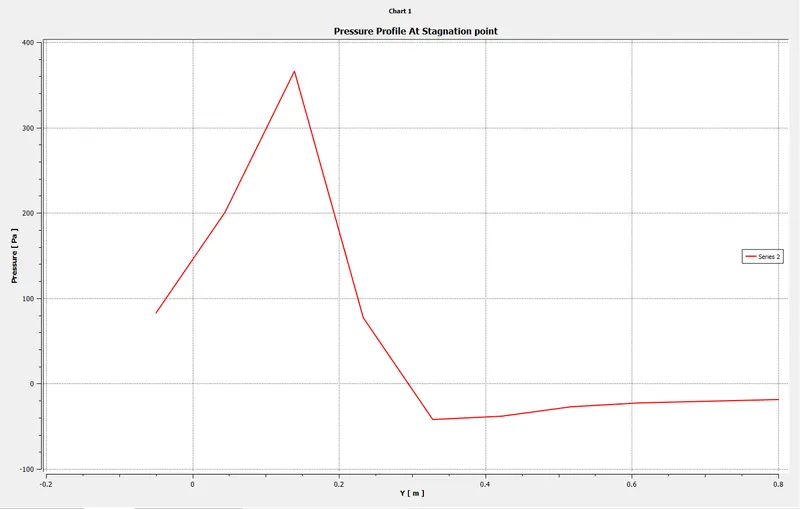
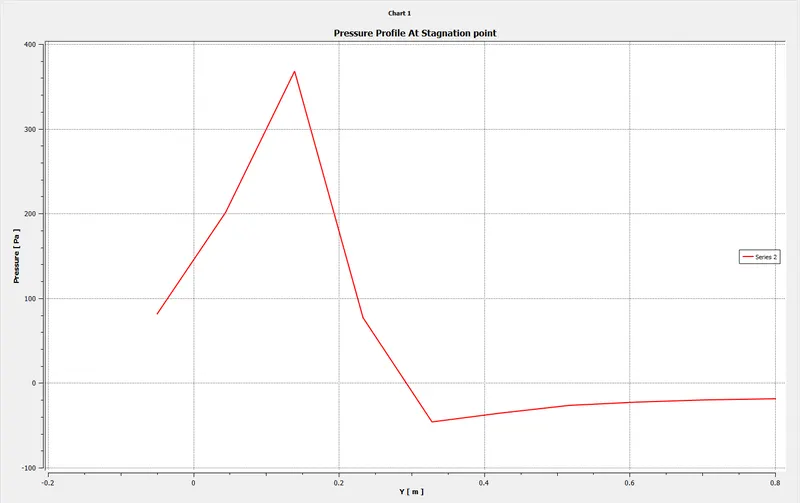
Stagnation point pressure distrubustion
------------------------------------------------------------------------------------------------------------------------------------------------
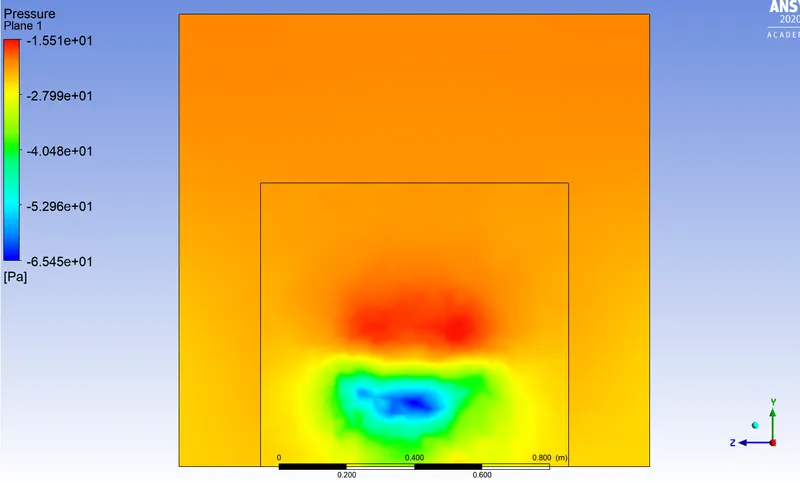
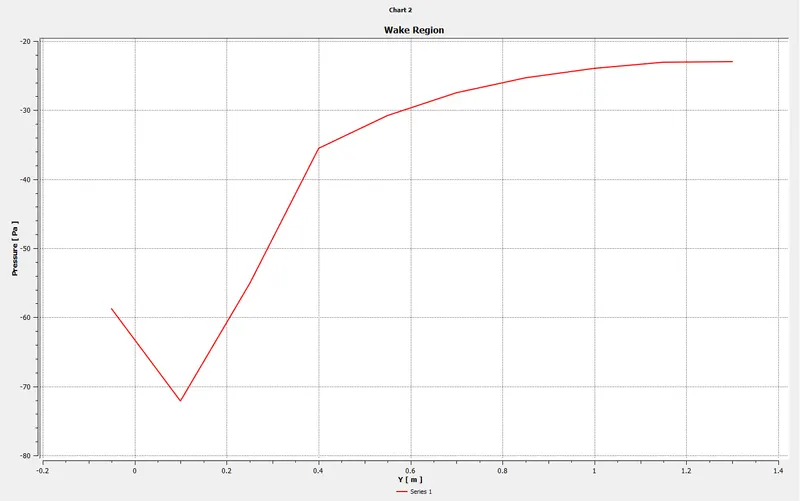
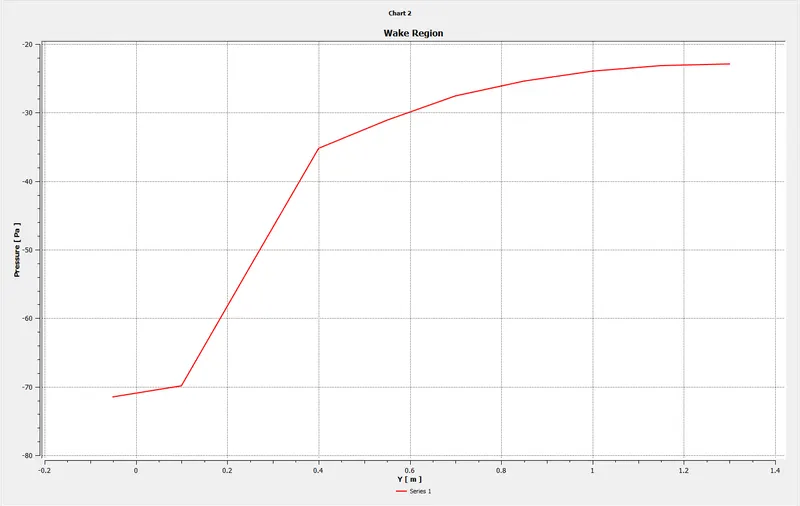
Wake point pressure distribution
------------------------------------------------------------------------------------------------------------------------------------------------
Stagnation point and wake velocity distribution
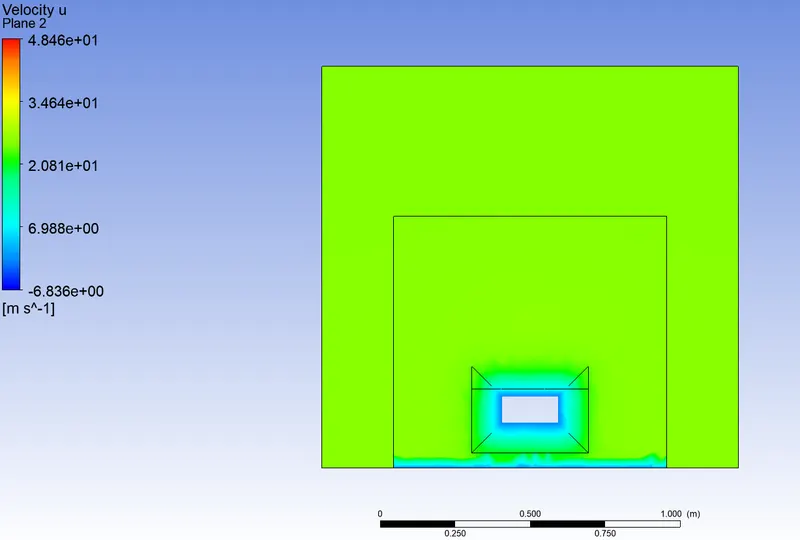
Stagnation point velocity distribution
------------------------------------------------------------------------------------------------------------------------------------------------
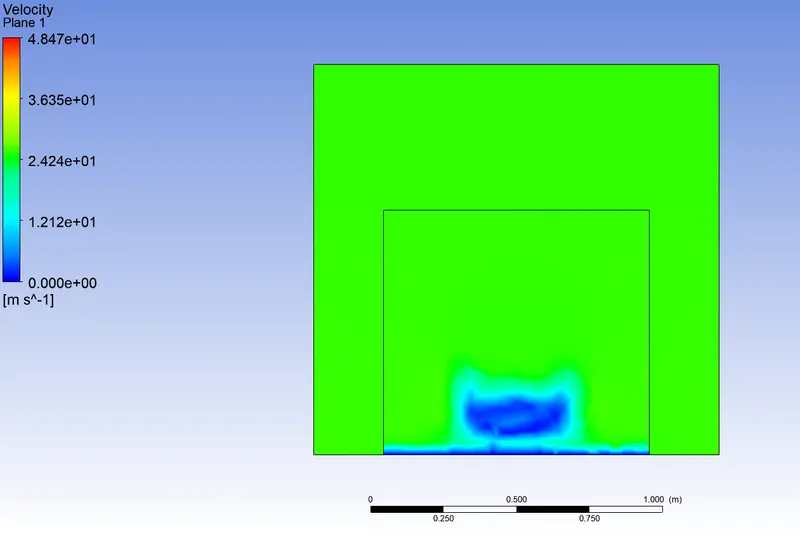
Wake region velocity distribution
------------------------------------------------------------------------------------------------------------------------------------------------
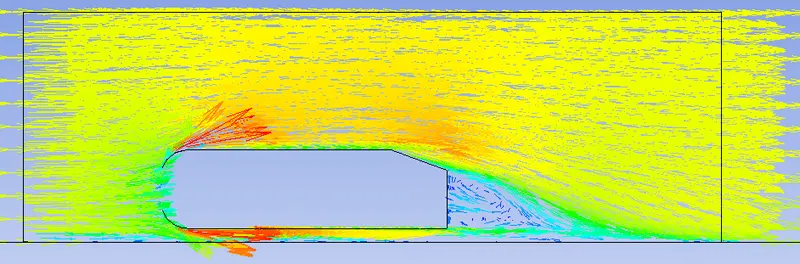
Vector plot along z axis.
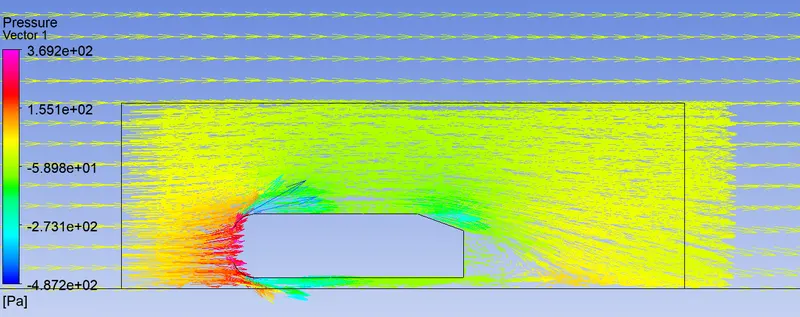
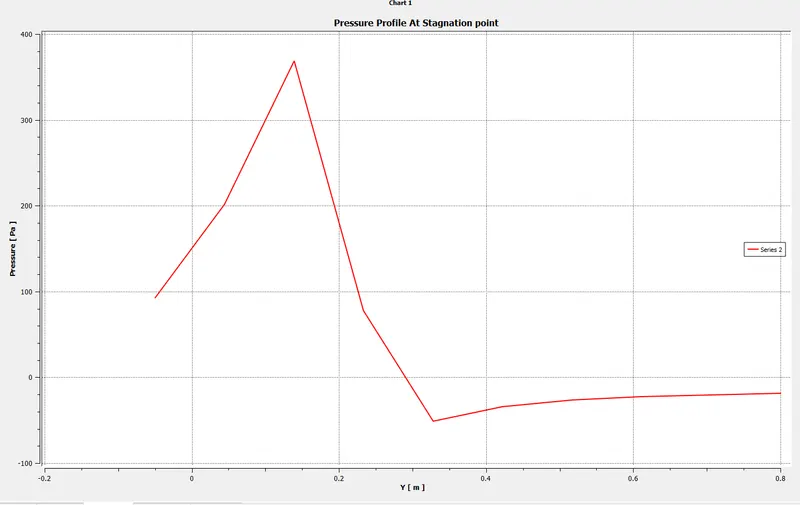
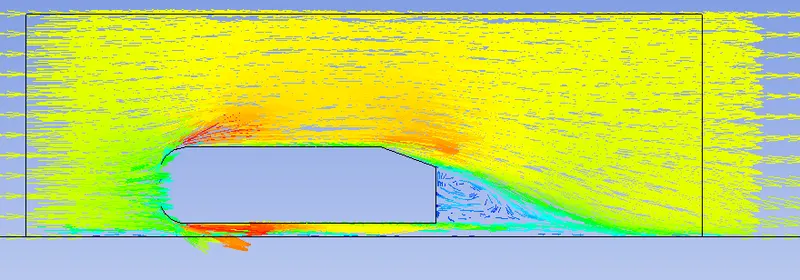
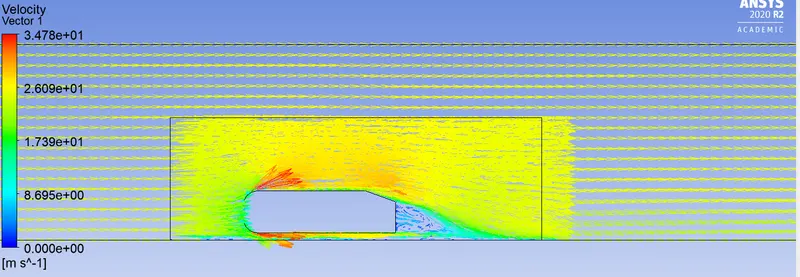
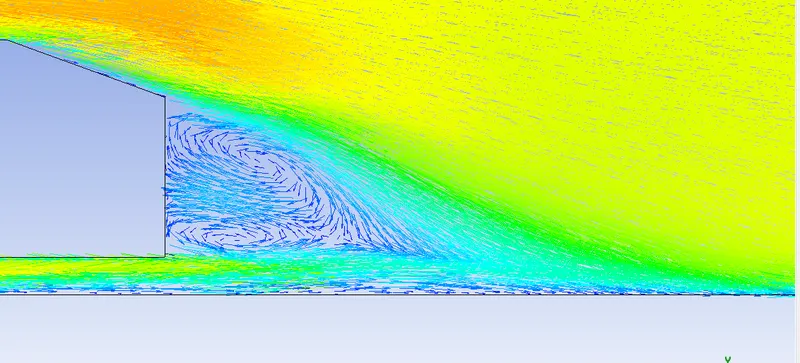
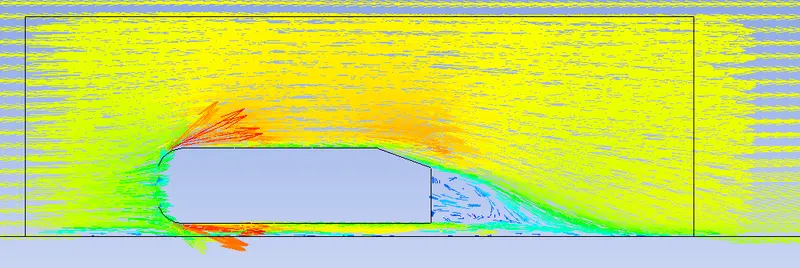
Now with this graphical data we can see that most of the effects are taking place in the regions where the fluid comes in contact with the surfaces of the ahmed body. The vector lones here shows us the direction in which these pressure vectors are moving toward. Which gives us a good understanding as to how the fluid behaves flowing over this object.
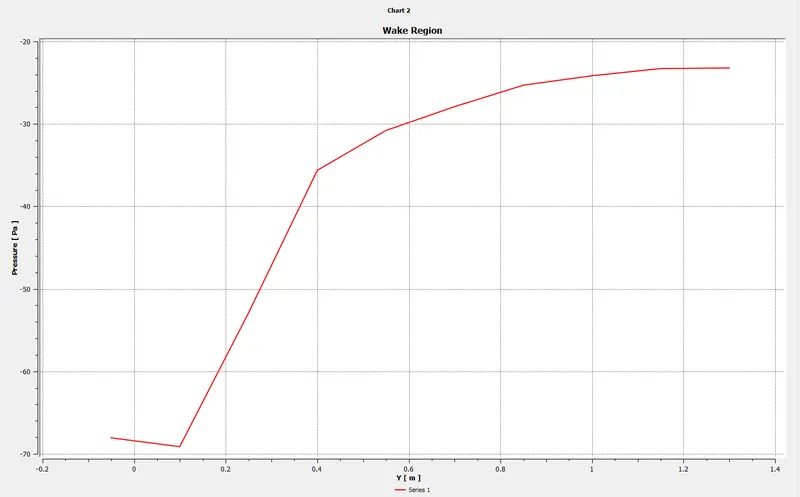
Here you can see the flow circulation at the wake region. Wake region is the region behind any object where any fluid passing over its surface undergoes drastic changes in pressure velocity and affects the amount Lift and/or Drag of that particular body(in this case the ahmed body )
------------------------------------------------------------------------------------------------------------------------------------------------
Line Probes
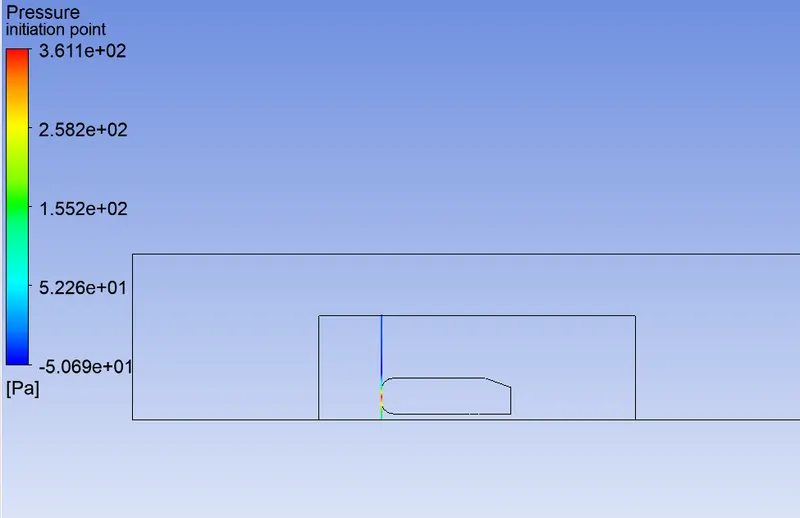
Stagnation point
------------------------------------------------------------------------------------------------------------------------------------------------
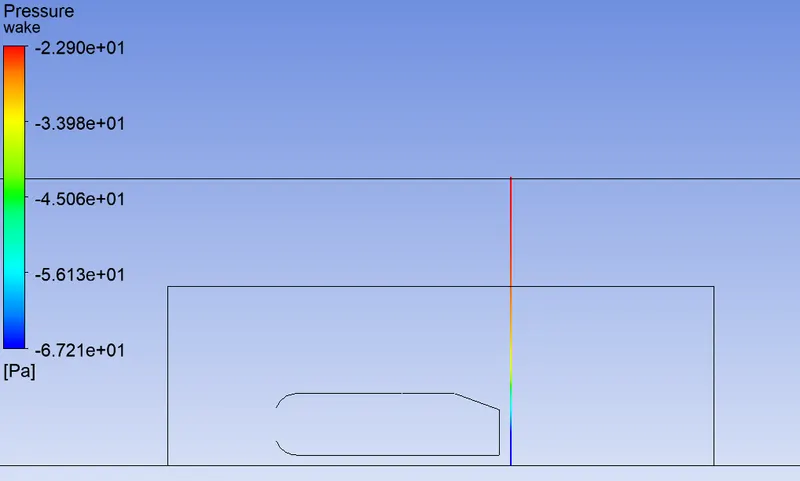
Wake region
------------------------------------------------------------------------------------------------------------------------------------------------
Charts with line probe at stagnation point and wake region
------------------------------------------------------------------------------------------------------------------------------------------------
Wake region pressure distribution along y axis
------------------------------------------------------------------------------------------------------------------------------------------------
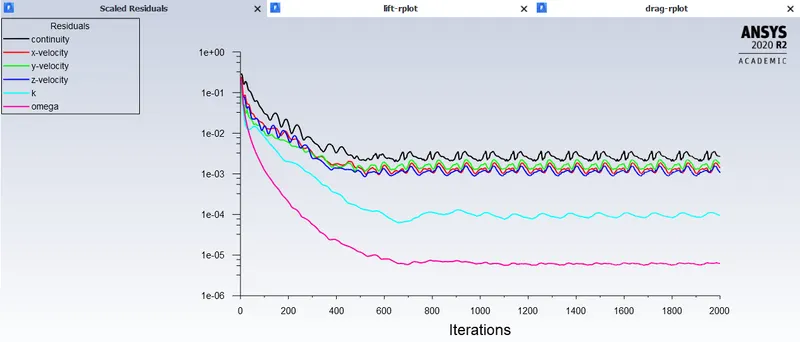
Residuals Plot
------------------------------------------------------------------------------------------------------------------------------------------------
------------------------------------------------------------------------------------------------------------------------------------------------
CASE 2
Mesh size 90 mm
------------------------------------------------------------------------------------------------------------------------------------------------
------------------------------------------------------------------------------------------------------------------------------------------------
stagnation point velocity
------------------------------------------------------------------------------------------------------------------------------------------------
Stagnation point pressure
------------------------------------------------------------------------------------------------------------------------------------------------
Velocity Profile
------------------------------------------------------------------------------------------------------------------------------------------------
Pressure profile

------------------------------------------------------------------------------------------------------------------------------------------------
Velocity Vector Plot
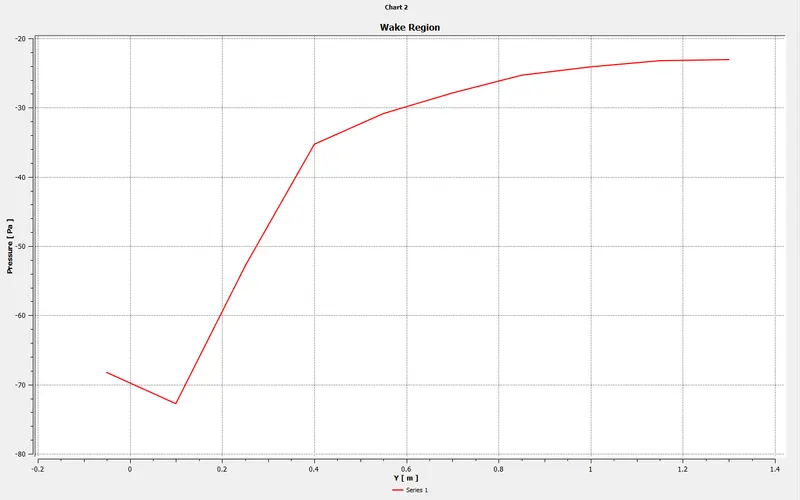
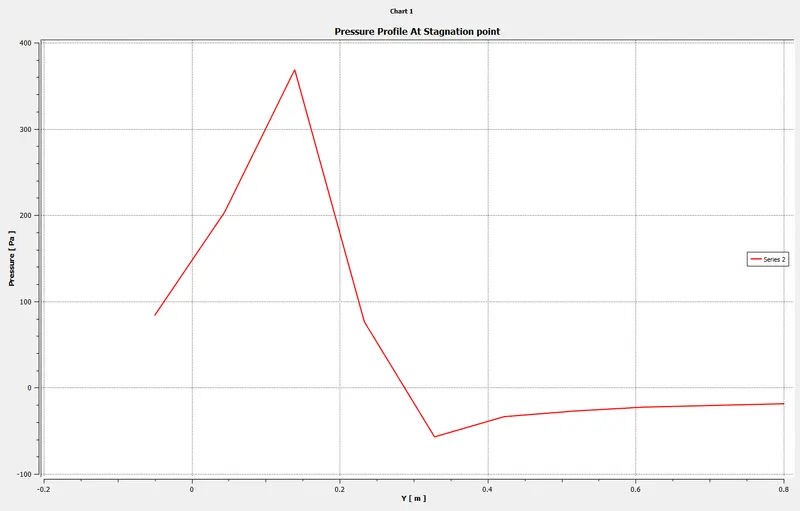
Line probe charts
------------------------------------------------------------------------------------------------------------------------------------------------
1.Wake
------------------------------------------------------------------------------------------------------------------------------------------------
2.Stagnation point
------------------------------------------------------------------------------------------------------------------------------------------------
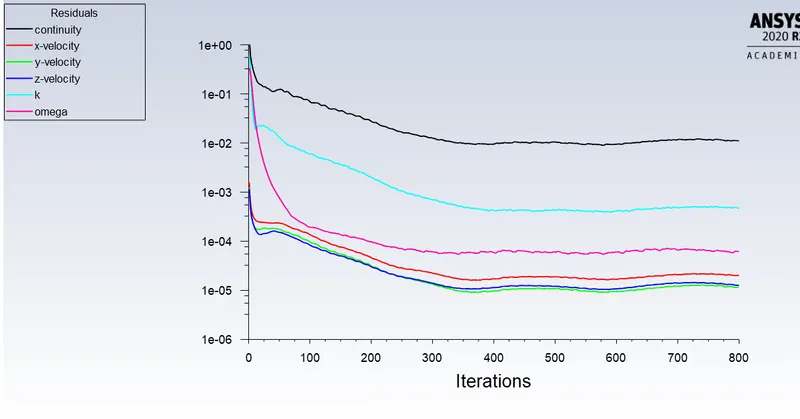
Residuals
------------------------------------------------------------------------------------------------------------------------------------------------
------------------------------------------------------------------------------------------------------------------------------------------------
Case 3
mesh size 80mm
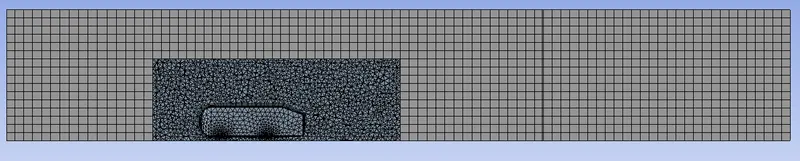
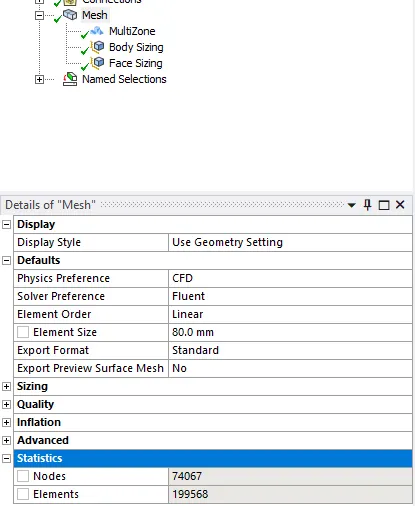
Mesh
------------------------------------------------------------------------------------------------------------------------------------------------
Mesh Profile

------------------------------------------------------------------------------------------------------------------------------------------------
Pressure
------------------------------------------------------------------------------------------------------------------------------------------------
Velocity
------------------------------------------------------------------------------------------------------------------------------------------------
stagnation point pressure
Stagnation point Velocity.
------------------------------------------------------------------------------------------------------------------------------------------------
Wake Region Vector plot
------------------------------------------------------------------------------------------------------------------------------------------------
Stagnation point chart
------------------------------------------------------------------------------------------------------------------------------------------------
Wake Region Chart
------------------------------------------------------------------------------------------------------------------------------------------------
------------------------------------------------------------------------------------------------------------------------------------------------
Case 4
70mm mesh
------------------------------------------------------------------------------------------------------------------------------------------------
Mesh profile

------------------------------------------------------------------------------------------------------------------------------------------------
Pressure
------------------------------------------------------------------------------------------------------------------------------------------------
Velocity
------------------------------------------------------------------------------------------------------------------------------------------------
Stagnation Pressure
------------------------------------------------------------------------------------------------------------------------------------------------
------------------------------------------------------------------------------------------------------------------------------------------------
Wake Region Vector plot
------------------------------------------------------------------------------------------------------------------------------------------------
Stagnation point chart
------------------------------------------------------------------------------------------------------------------------------------------------
Wake Region Chart
------------------------------------------------------------------------------------------------------------------------------------------------
------------------------------------------------------------------------------------------------------------------------------------------------
Case 5
60mm mesh
------------------------------------------------------------------------------------------------------------------------------------------------
------------------------------------------------------------------------------------------------------------------------------------------------
------------------------------------------------------------------------------------------------------------------------------------------------
------------------------------------------------------------------------------------------------------------------------------------------------
------------------------------------------------------------------------------------------------------------------------------------------------
------------------------------------------------------------------------------------------------------------------------------------------------
Wake Region Vector plot
------------------------------------------------------------------------------------------------------------------------------------------------
Stagnation point chart
.
------------------------------------------------------------------------------------------------------------------------------------------------
Wake Region Chart
------------------------------------------------------------------------------------------------------------------------------------------------
------------------------------------------------------------------------------------------------------------------------------------------------
Case 6
50mm mesh
------------------------------------------------------------------------------------------------------------------------------------------------
------------------------------------------------------------------------------------------------------------------------------------------------
------------------------------------------------------------------------------------------------------------------------------------------------
------------------------------------------------------------------------------------------------------------------------------------------------
Stagnation point pressure
------------------------------------------------------------------------------------------------------------------------------------------------
Stagnation Point Velocity
 \
\
------------------------------------------------------------------------------------------------------------------------------------------------
------------------------------------------------------------------------------------------------------------------------------------------------
Stagnation point chart
------------------------------------------------------------------------------------------------------------------------------------------------
Wake Region Chart
------------------------------------------------------------------------------------------------------------------------------------------------
------------------------------------------------------------------------------------------------------------------------------------------------
Final Results Tabulation
(mesh case in 'mm')
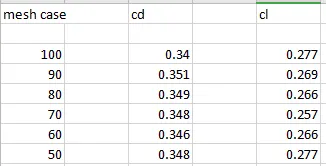
Each Mesh case represents respective size of element.
Here from the results obtained form the simulations we can say Mesh independence test was carried out succefully.
And that there was no drastic change in any of the parameters used to monitor the simulations.
Reason for Negative Pressure in the wake region.
Viscous losses, And Separation, and when there is a high pressure region at the front of the object. (in this case the object is the ahmed body.)
Separation point
- It has been observed that the flow is reversed at the vicinity of the wall under certain conditions.
- The phenomenon is termed as separation of boundary layer.
- Separation takes place due to excessive momentum loss near the wall in a boundary layer trying to move downstream against increasing pressure, i.e., , which is called adverse pressure gradient.