Project 1 - Parsing NASA thermodynamic data
TITLE
Write a function that extracts the 14 co-efficients and calculates the enthalpy, entropy and specific heats for all the species in the data file. You will be reading this file NASA thermodynamic data.
EQUATIONS
`(CP)/R=a1+a2*T+a 3*T^2+a4*T^3+a5*T^4`
`H/(RT)=a1+a2*(T/2)+a3*(T^2/3)+a4*(T^3/4)+a5*(T^4/5)+(a6)/T`
`S/R=a1*lnT+a2*T+a3*(T^2/2)+a4*(T^3/3)+a5*(T^4/4)+a7`
Where
- CP = specific heat
- R = is the universal gas constant =
- a1 to a14 are the data values for the coefficients of the polynomial.
- T1,T2,T3 = are the global temperatures(high,mid and low respectively)
- S = entropy
- H = enthalpy
CODE LOGIC
- To start off in almost all codes we use clear all, close all and clc.
- Now we have to open the file from which we have to take and read(Parse) the data.
- we assign a file handle f1
- and use the fopen() function to open a particular file in the given file directory.
- to read the first line we use gt = fgetl() function to read the line.
- now we dont need the first line. We are interested in the values of the coefficients in the data.
- There is a certain format which is followed here, so inorder to extract the data we need to execute our functions and codes we have to code accordingly.
- After reading the first line we read the scond line which has the name of our species as given in the data
- gt1 is used to store teh second line and we need to convert that line into numbers so that we can navigate around that line easily.
- Now we are required to split that line to get our data (Global temps)
- we use the strsplit() function to split the strig.
- We define the global temperatures which we may or may not use with the progression of the code.
- Next we are required to skip the next three lines which contain data which is not of relevance for the code.
- we do that by using a simple for loop to skip the 3 lines.
- Next we extract the lines with useful data.
- So, accoding to the distribution of the data we need to get all the numbers properly, so we use the exponential operator(in the data) to navigate through the line.
- With the given data we require all the numbers before 'E' except the spaces and +2,3 digits after 'E'.
- this logic is used and shown below.
- Mainly we conert the whole line into a numerical array then we use strfind() to find the 'E'
- Then we navigate with the handle of each line treating each of the line as an array.
- Now we use all the useful data by using variable (a_n) where n would be the array pointer( to navigate through the array and store the coeff values)
- We have to manually do that 3 times for all the coefficients
- get all values and put it in our formulae.
- we get all the values and then we use a function to calculate the Total Molecular Weight of each element with its name.
- So what we have done to store all the graph figures in the folder is given in the code. We assign a variable to each figure with an iteration variable (k).
- Initially we assign k = 1
- Then for each figure we iterate the original value of k and then repeat the same.
- we plot all the necessary graphs in the 3 different figures.
- The above code will be executed many times and we get 159 images.
- these are stored/saved in a folder using function saveas()
- The results of the same are given below.
CODE
clear all
close all
clc


% we are going to open the file
f1=fopen('THERMO.dat','r');
gt=fgetl(f1);
% splitting the gt1 to convert it into number
k = 1;
gt1=fgetl(f1);


gt1 = strsplit(gt1);
% now converting the cell array into number

global_low_temp=str2double(gt1{2});
global_mid_temp=str2double(gt1{3});
global_high_temp=str2double(gt1{4});

% now skipping the lines which are not having the usefull data
 for l=1:3
     skip_line=fgetl(f1);
 end


 for j=1:53

% now we need extract the lines from line5 which are having the useful data.

line=fgetl(f1);
% splitting the o string
line_split=strsplit(line);
% converting the cell array into number
atomic_num=str2double(line_split{4});
local_low_temp=str2double(line_split{end-3});
local_high_temp=str2double(line_split{end-2});
local_mid_temp=str2double(line_split{end-1});
%line_num=str2double(line_split{9});
species_name = line_split{1};

% now we need to get the 6th line where we are actually going to calculate
% the coefficients
tline=fgetl(f1);
% we are going to get the locations of the E, so that we can find out the
% coefficients of it.
a=findstr(tline,'E');

% we found the locations of E and with the help of these we can find the
% coefficients,we can get 3 numbers after E using that we can find the
% coeffs. the below 7coefficients are for high temperature.

a1=tline(1:a(1)+3);
a1=str2double(a1);
a2=tline(a(1)+4:a(2)+3);
a2=str2double(a2);
a3=tline(a(2)+4:a(3)+3);
a3=str2double(a3);
a4=tline(a(3)+4:a(4)+3);
a4=str2double(a4);
a5=tline(a(4)+4:a(5)+3);
a5=str2double(a5);

% another 2 coefficients are present in the next line.
tline_2=fgetl(f1);

b=findstr(tline_2,'E');

a6=tline_2(1:b(1)+3);
a6=str2double(a6);
a7=tline_2(b(1)+4:b(2)+3);
a7=str2double(a7);


% the below 7 coefficients are for low temperatures

a8=tline_2(b(2)+4:b(3)+3);
a8=str2double(a8);
a9=tline_2(b(3)+4:b(4)+3);
a9=str2double(a9);
a10=tline_2(b(4)+4:b(5)+3);
a10=str2double(a10);

% the below 4 coefficients are in the next line.

tline_3=fgetl(f1);

c=findstr(tline_3,'E');

a11=tline_3(1:c(1)+3);
a11=str2double(a11);
a12=tline_3(c(1)+4:c(2)+3);
a12=str2double(a12);
a13=tline_3(c(2)+4:c(3)+3);
a13=str2double(a13);
a14=tline_3(c(3)+4:c(4)+3);
a14=str2double(a14);


% assuming the temperature values from low to high global temperature as
% 1000
%  taking the value for universal gas constant.
R=8.314;

 T=linspace(local_low_temp,local_high_temp,1000);


%  calculating the specific heat,enthalpy,entropy
 for i=1:length(T)

     if T(i)>local_mid_temp

       cp(i)=(a1+a2.*T(i)+a3.*T(i)^2+a4.*T(i)^3+a5.*T(i)^4).*R;
       H(i)=(a1+a2.*(T(i)./2)+a3.*(T(i)^2./3)+a4.*(T(i)^3./4)+a5.*(T(i)^4./5)+a6./T(i)).*R.*T(i);
       S(i)=(a1*log(T(i))+a2.*T(i)+a3.*(T(i)^2./2)+a4.*(T(i)^3./3)+a5.*(T(i)^4./4)+a7);


     else
       cp(i)=(a8+a9.*T(i)+a10.*T(i)^2+a11.*T(i)^3+a12.*T(i)^4).*R;
       H(i)=(a8+a9.*(T(i)./2)+a10.*(T(i)^2./3)+a11.*(T(i)^3./4)+a12.*(T(i)^4./5)+a13./T(i)).*R.*T(i);
       S(i)=(a8*log(T(i))+a9.*T(i)+a10.*(T(i)^2./2)+a11.*(T(i)^3./3)+a12.*(T(i)^4./4)+a14);


     end
 end


 mkdir('D:\Srijith\programs',species_name);


 p1 = figure(k)

plot(T,cp,'linewidth',3,'color','r')
grid on
title(species_name)
xlabel('TEMP')
ylabel('SPECIFIC HEAT')


p2 = figure(k+1)

plot(T,H,'linewidth',3,'color','b')
grid on
title(species_name)
xlabel('TEMP')
ylabel('ENTHALPY')

p3 = figure(k+2)
plot(T,S,'linewidth',3,'color','g')
grid on
title(species_name)
xlabel('TEMP')
ylabel('ENTROPY')

k = k+3;

path1 =sprintf('D:/Srijith/programs/%s/temp_vs_cp.png', species_name);
path2 =sprintf('D:/Srijith/programs/%s/temp_vs_H.png', species_name) ;
path3 =sprintf('D:/Srijith/programs/%s/temp_vs_S.png', species_name);

saveas(p1,path1)
saveas(p2,path2)
saveas(p3,path3)

% calculating the molecular weight of each species


disp(species_name)
Total_mol_wt=molecular_weight(species_name);


 end
FUNCTION DEFINITION CODE
function total_m_wt=molecular_weight(species_name)


 element={'O','C','H','Ar','N','S'};

 Atomic_mass=[15.999,12.011,1.008,39.948,14.007,32.06];

total_m_wt=zeros(1,length(species_name));

 for i=1:length(species_name)

     if isnan(str2double(species_name(i)))

         for j=1:length(element)
             if strcmp(species_name(i),element(j))
             total_m_wt(i)=total_m_wt(i)+Atomic_mass(j);
             end
         end
     else
        total_m_wt(i-1)=total_m_wt(i-1)* str2double(species_name(i));

     end
 end


           total_m_wt=sum(total_m_wt)

end
RESULTS
1.The image below shows all the species with their name saved in the coded file

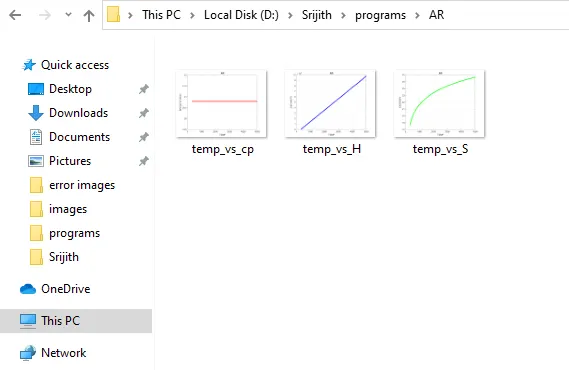
2.This image below shows the contents of the first species folder (AR) Argon gas.
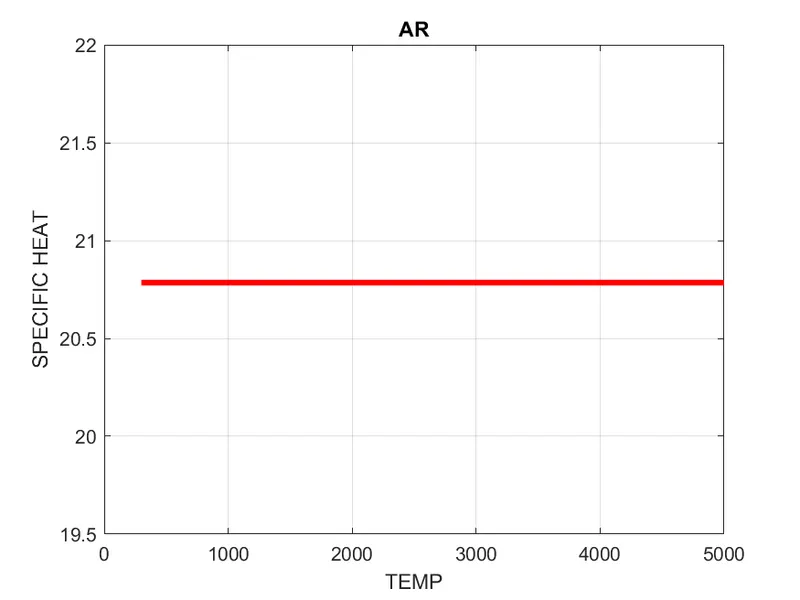
3.The below image shows the plot of Temp vs specific heat of Argon gas.
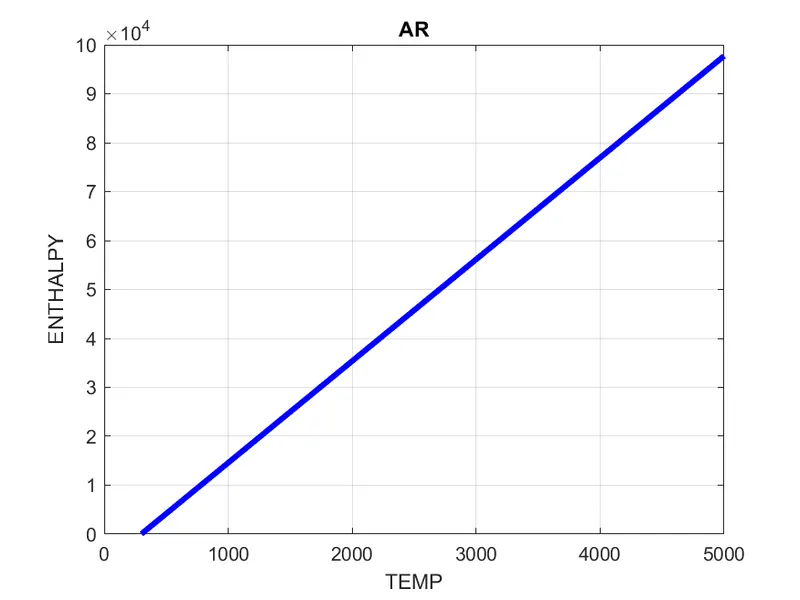
4.The below image shows the plot of Temp vs Enthalpy of Argon gas.
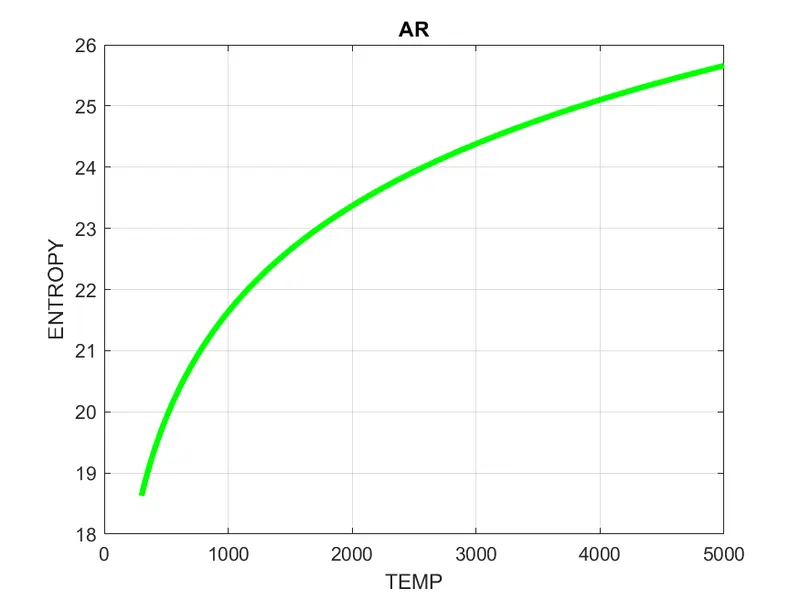
5.The below image shows the plot of Temp vs Entropy of Argon gas.
6. The below image shows each species name and its molecular weight.
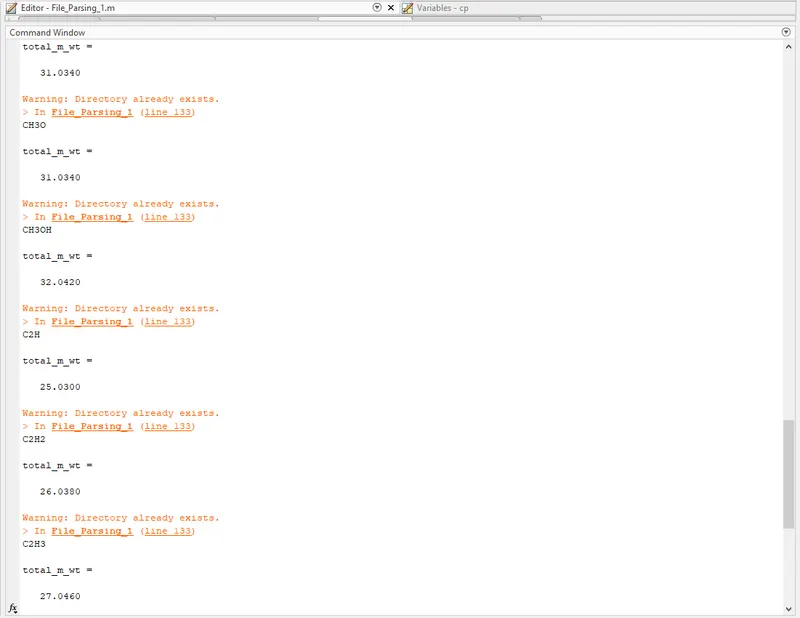
The warning sign is because the mkdir() function is in the final loop.
7. The below 3 figures shows the variation of temp vs cp,H,S in o2
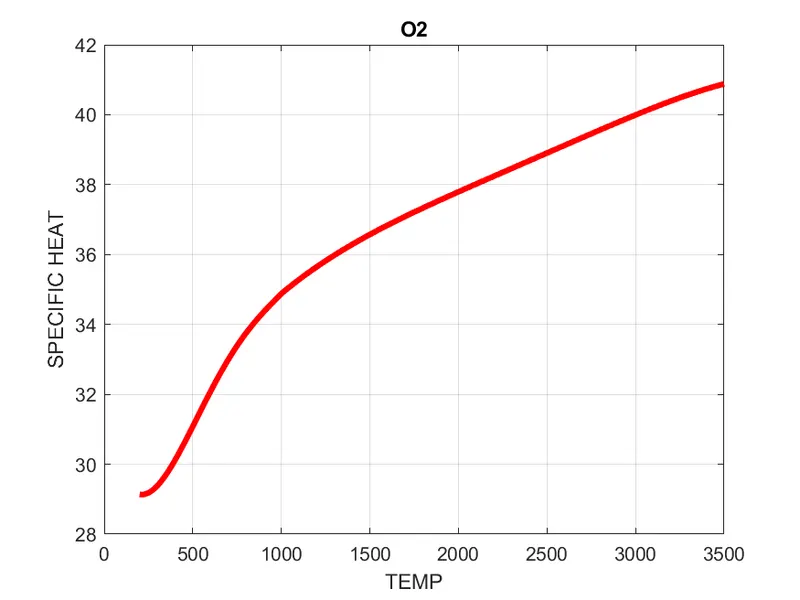
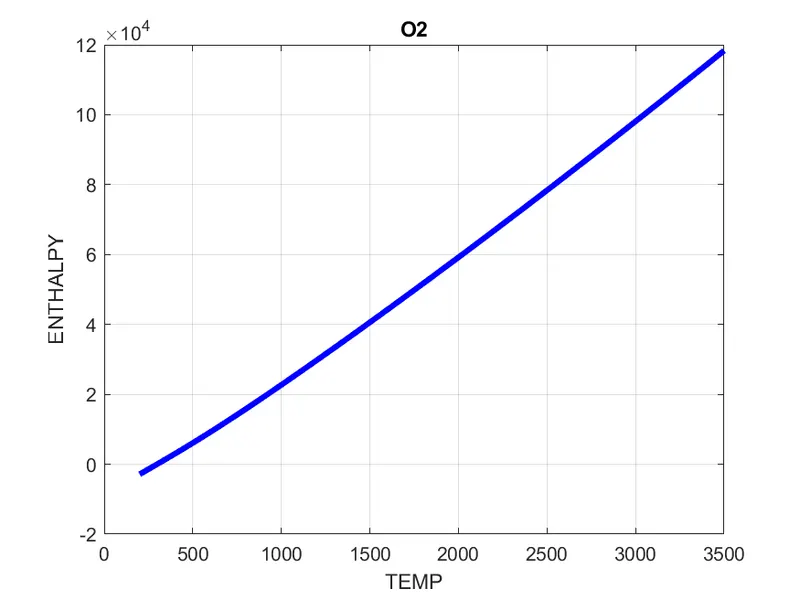
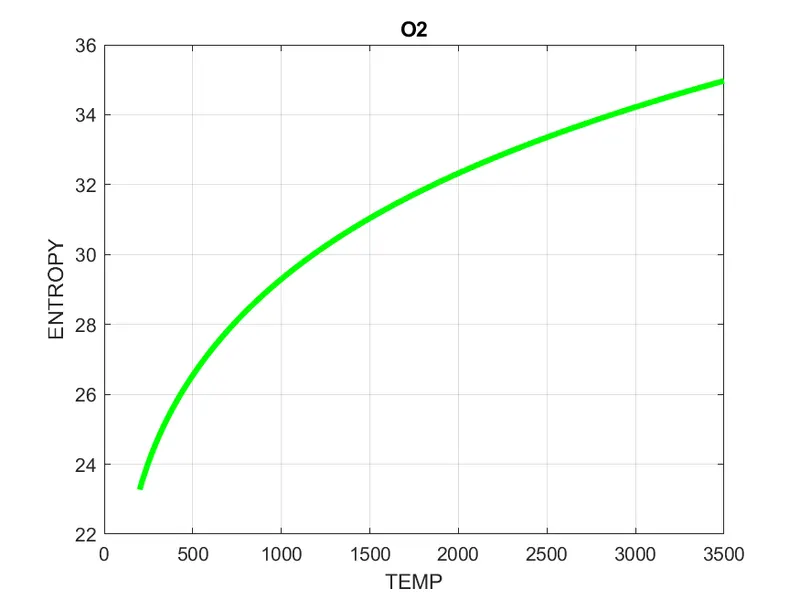
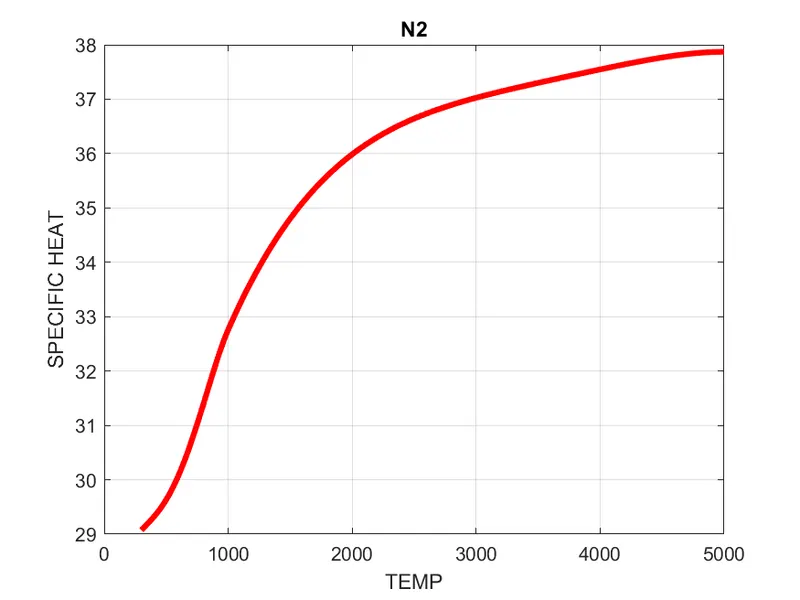
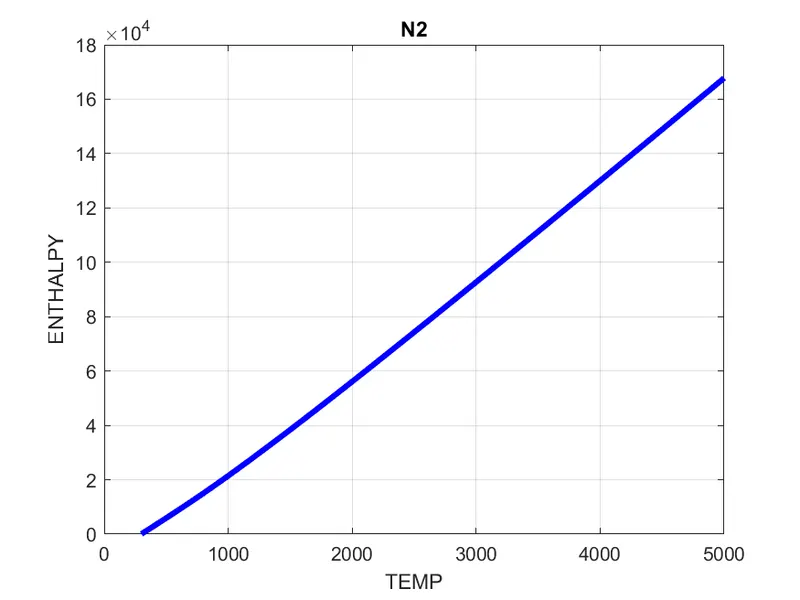
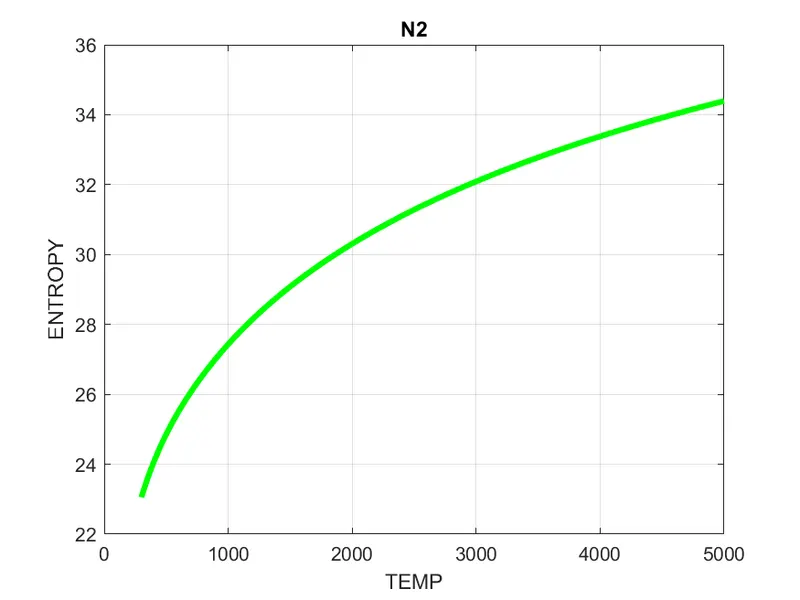
8. The below 3 figures shows the variation of temp vs cp,H,S in N2
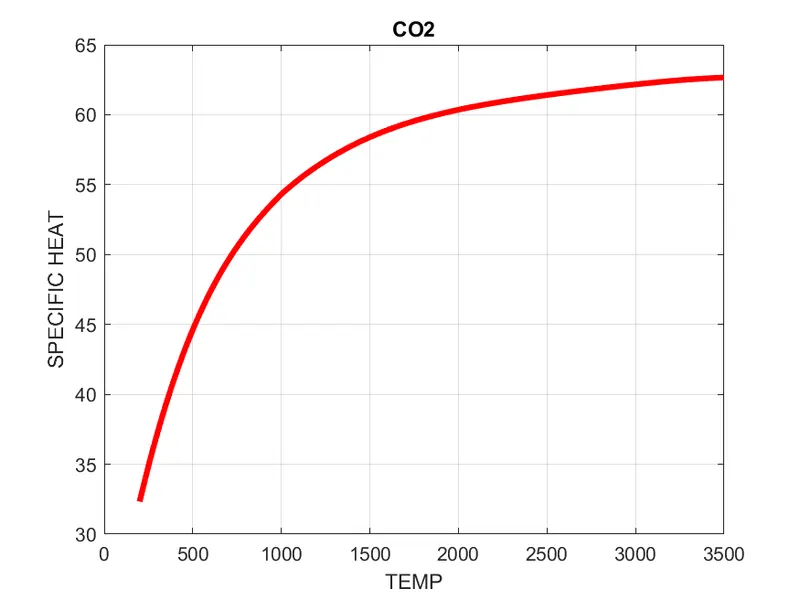
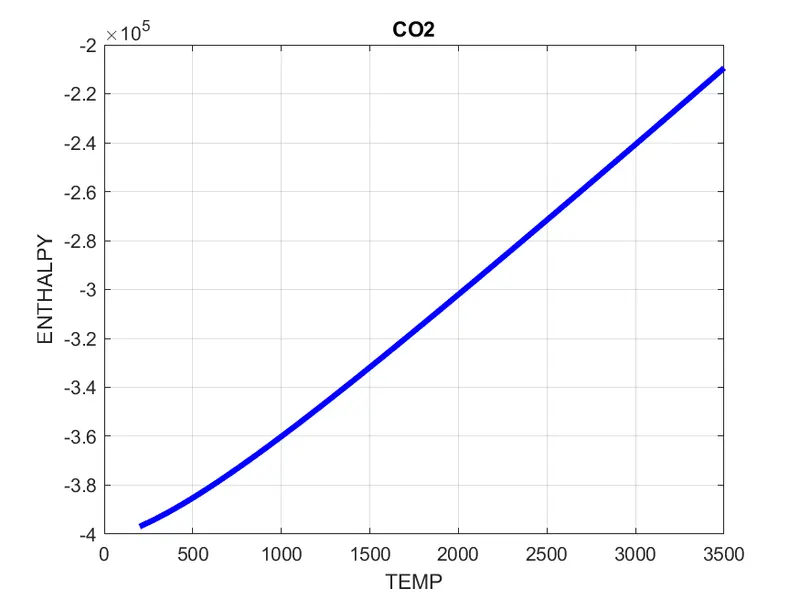
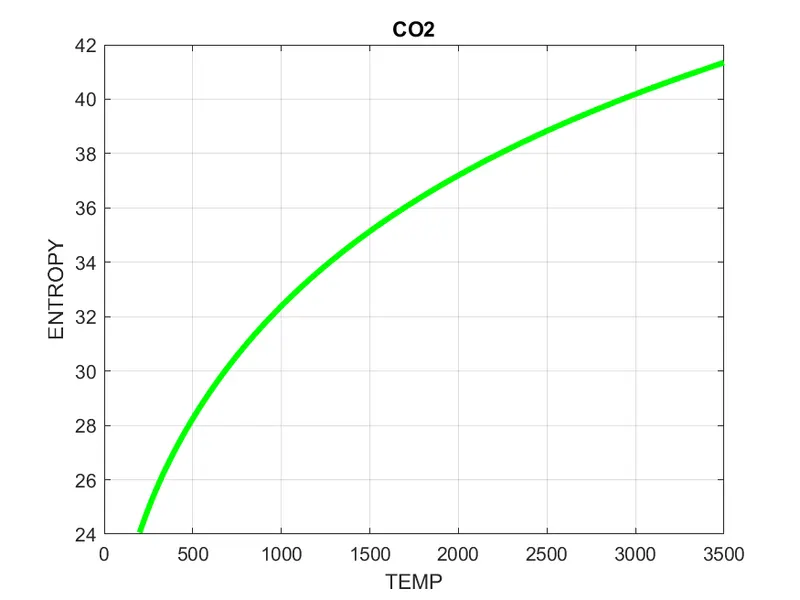
9. The below 3 figures shows the variation of temp vs cp,H,S in Co2
ERRORS

This error was shown when i hadnt defined what' species_name' was in the function.