ADVISOR Tool
AIM :
To use the ADVISOR tool to simulate and observe various vehicle models.
OBJECTIVE :
- To analyse the vehicle EV_defaults_in for a given cargo mass.
- To change the battery capacity for the above vehicle and condition.
- To perform gradeability test with the vehicle PRIUS_Jpn_defaults_in.
ADVISOR TOOL :
The U.S. Department of Energy (DOE) and the National Renewable Energy Laboratory (NREL) have worked with industry partners to develop sophisticated systems analysis tool thatcan answer crucial questions aboutspecific component and vehicle designs.
ADVISOR was preliminarily written and used in November 1994. Since then, it has been modified as necessary to help manage the US DOE Hybrid Vehicle Propulsion System subcontracts. Only in January 1998 was a concerted development effort undertaken to clean up and document ADVISOR.
Since then, over 4500 individuals have downloaded one or more versions of ADVISOR, including all of the OEMs and major suppliers. About 2/3 of the users are from industry and 1/3 from universities. A short list of major ADVISOR users includes:
- DaimlerChrysler
- Ford Motor Company
- General Motors Corp.
- Delphi Automotive Systems
- Visteon
- and hundreds of others
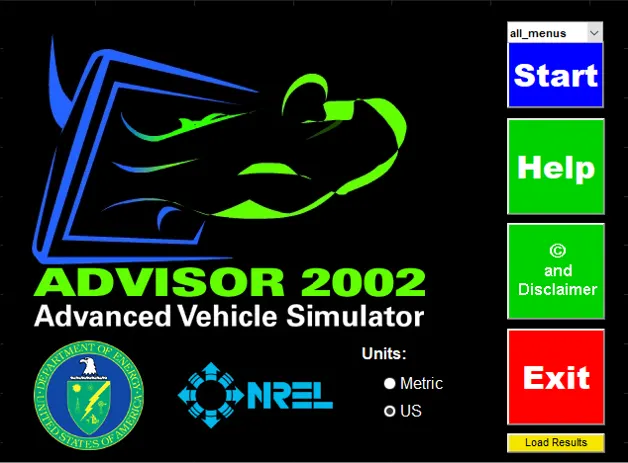
ADVISOR (Advanced VehicleSimulator) is a model written in the widely used MATLAB/Simulinksoftware environment. It can be used to simulate and analyze conventional, advanced, light and heavy vehicles, including hybrid electric and fuel cell vehicles. ADVISOR tests the effect of changes in vehicle components (such as motors, batteries, catalytic converters,climate control systems, and alternative fuels) or other modifications that might
affect fuel economy, performance, or emissions. The user can alter simulation results by selecting vehicle component types, sizes, and parameters.
One may benefit from using ADVISOR if you want to:
- estimate the fuel economy of vehicles that have not yet been built
- learn about how conventional, hybrid, or electric vehicles use (and lose) energy throughout their drivetrains
- compare relative tailpipe emissions produced on a number of cycles
- evaluate an energy management strategy for your hybrid vehicle’s fuel converter
- optimize the gear ratios in your transmission to minimize fuel use or maximize performance, etc.
The models in ADVISOR are:
- mostly empirical, relying on drivetrain component input/output relationships measured in the laboratory, and
- quasi-static, using data collected in steady state (for example, constant torque and speed) tests and correcting them for transient effects such as the rotational inertia of drivetrain components.
There are three windows in ADVISOR tool
- Vehicle input window
- Simulation Parameter window
- Results window
1. Analysing the vehicle EV_defaults_in for a given cargo mass
The vehicle used here for simulation was EV_defaults_in.
Here with all the default conditions the cargo mass alone was changed to 500.
After changing the cargo mass, the total mass will also be changed.
The vehicle input window for this simulation was attached below,
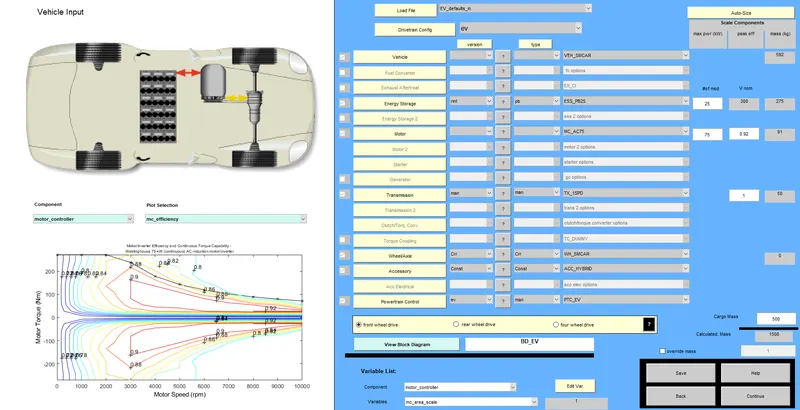
After defining the parameters, click on the continue buttuon to proceed to the next window.
The next window was the simulation parameter window,
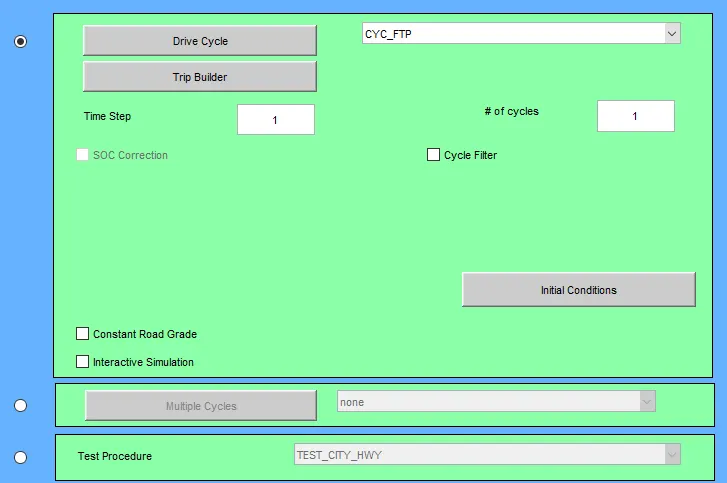
In this window initially the drive cycle was set to CYC_FTP from the drop down list.
After clicking on the run button, the simulation was carried out and the results were displayed in the results window.
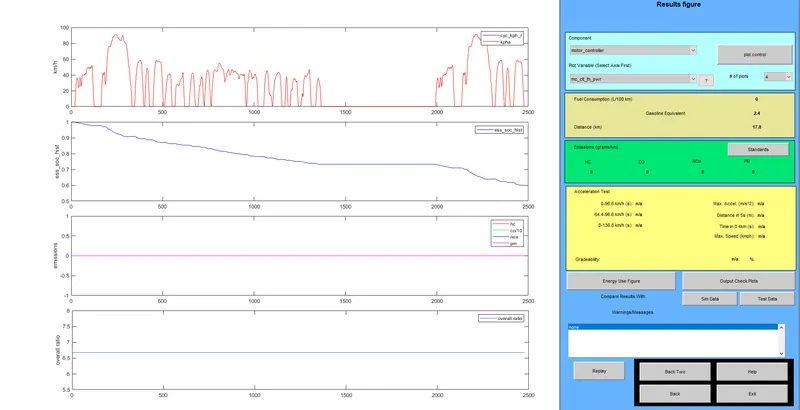
In the result window all the output plots and observations were displayed.
∴ The distance travelled by the vehicle in 1 drive cycle was found to be 17.8 km.
It used almost 40 % of the SOC.
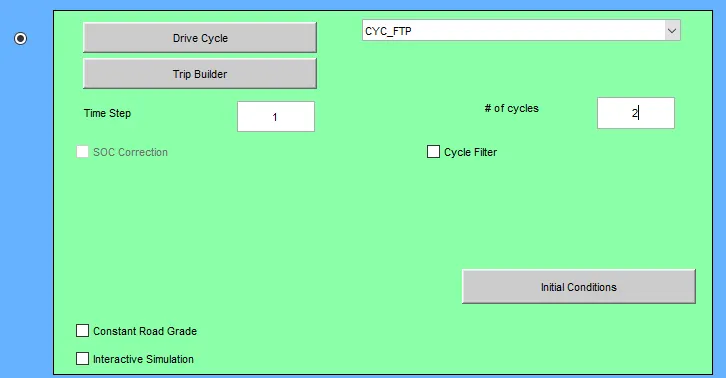
The drive cycles were further increased to 2,
The Result window simulated for 2 drive cycles was attached below,
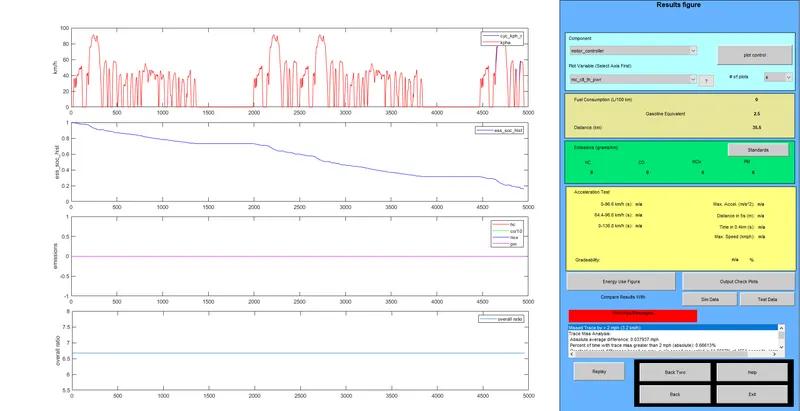
∴ The distance travelled by the vehicle in 2 drive cycles was found to be 35.5 km.
It used almost 80 % of the SOC.
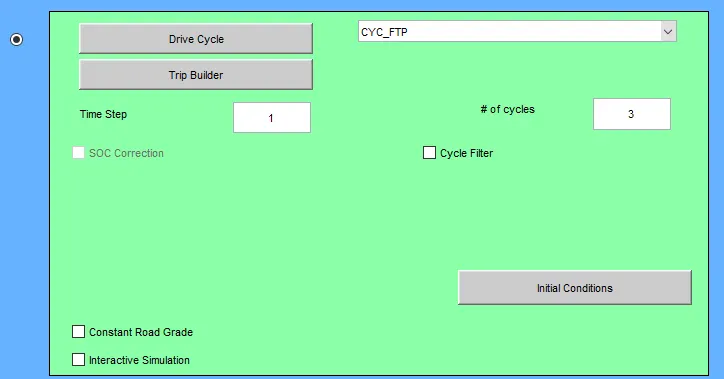
Further, the drive cycles were increased to 3,
The Result window simulated for 3 drive cycles was attached below,
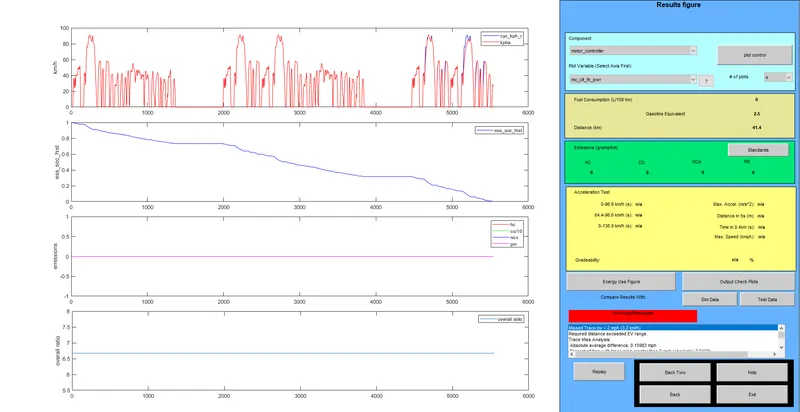
∴ The distance travelled by the vehicle in 3 drive cycles was found to be 41.4 km.
In this case the SOC was completely used up.
Inference :
- The distance covered by the vehicle per cycle was 17.8 kms
- The maximum distance covered by this vehicle with 500 kg of cargo was 41.1 km
- This distance was covered in 3 drive cycles which completely exhausted the battery of the vehicle.
Result :
Hence the EV_defaults_in vehicle cannot cover a distance of 45 km with a cargo load of 500 kg.
2.Analysing the vehicle EV_defaults_in for a given cargo mass with change in battery capacity
The vehicle used here for simulation was EV_defaults_in.
All the conditions in the previous case study was followed.
The battery capacity of the vehicle was altered.
It was changed fro 25 modules to 30 modules which also increased the mass of the battery to 330.
The vehicle input window for this simulation was attached below,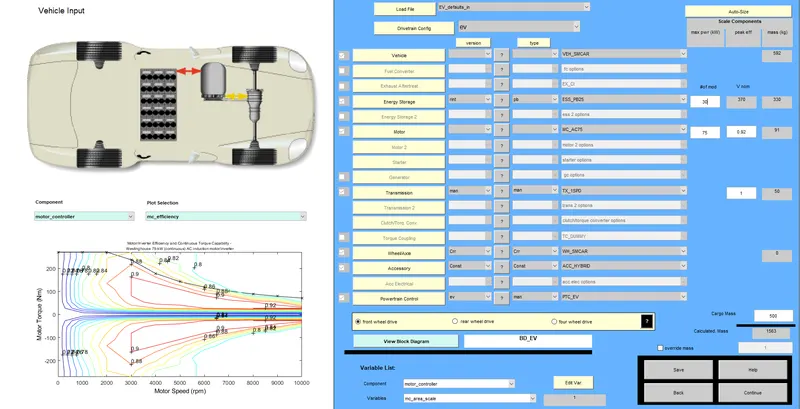
After defining the parameters, click on the continue buttuon to proceed to the next window.
The next window was the simulation parameter window,
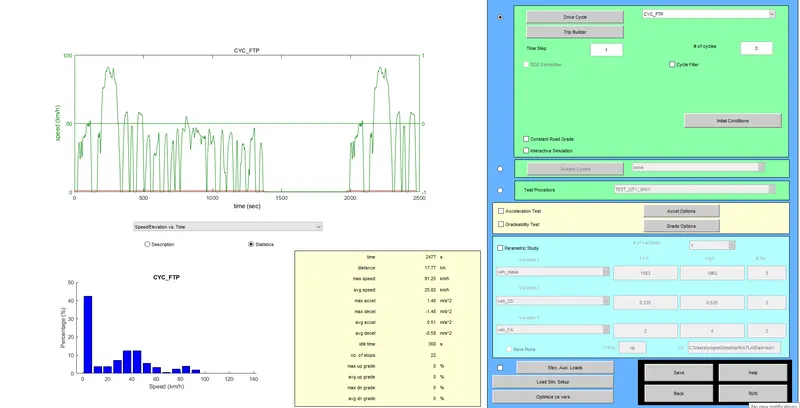
In this window initially the drive cycle was set to CYC_FTP from the drop down list and the number of cycles were set to 3 like the previous case.
After clicking on the run button, the simulation was carried out and the results were displayed in the results window.
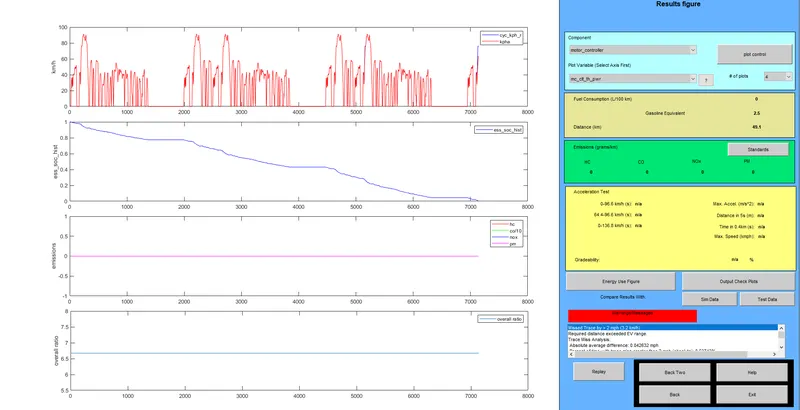
In the result window all the output plots and observations were displayed.
The distance travelled by the vehicle in 3 drive cycles was found to be 49.1
The Battery was completely exhausted after completing this distance.
Result :
- Thus as the battery capacity increases to 30 modules, the vehicle was able to cross the distance of 45 km with a cargo mass of 500 kg.
- This clearly depicts the efficiency of the vehicle was improved compared to the previous case.
3. Performing gradeability test with PRIUS_Jpn_defaults_in
The vehicle used here for simulation was PRIUS_Jpn_defaults_in.
All the default conditions were taken into consideration.
The vehicle input window for this simulation was attached below,
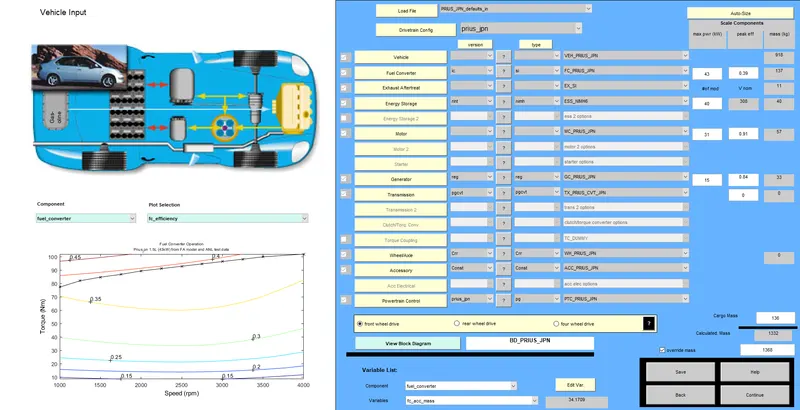
After defining the parameters, click on the continue buttuon to proceed to the next window.
The next window was the simulation parameter window,
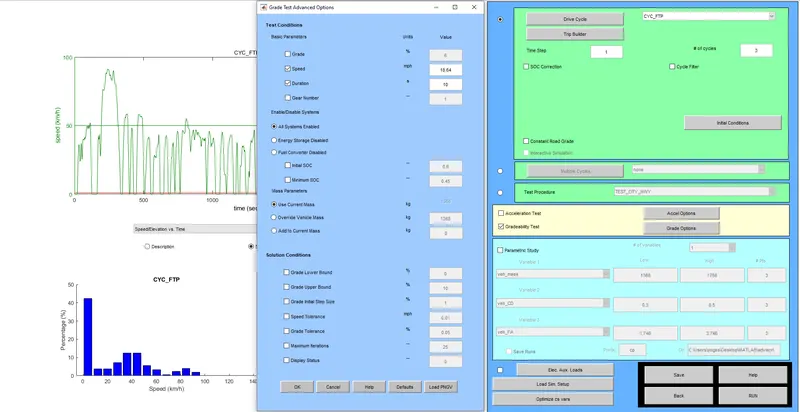
In the simulation parameter window the following steps were followed,
- The drive cycle used was CYC_FTP and the number of cycles were chosen as 3.
- For performing the gradeability test select the Gradeability Test box and click on the Grade Options box.
- A Grade Test dialogue box appears, in the dialogue box set the speed and time as required.
- Enable the All Systems Enabled option and clicl OK to proceed futher.
- Finally click on the Run button to proceed to the results window.
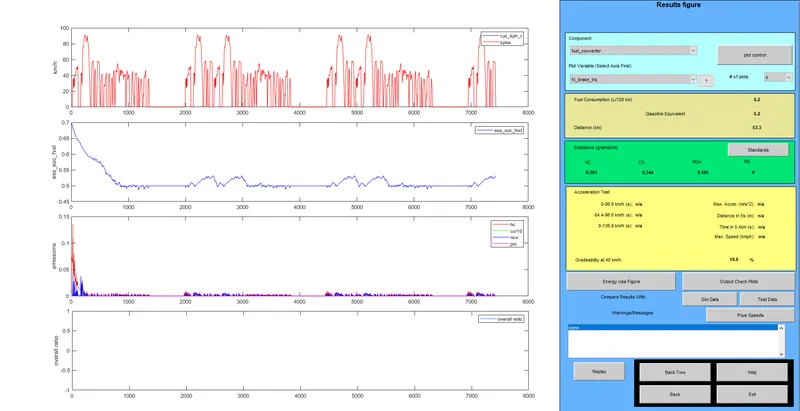
Case 1 :
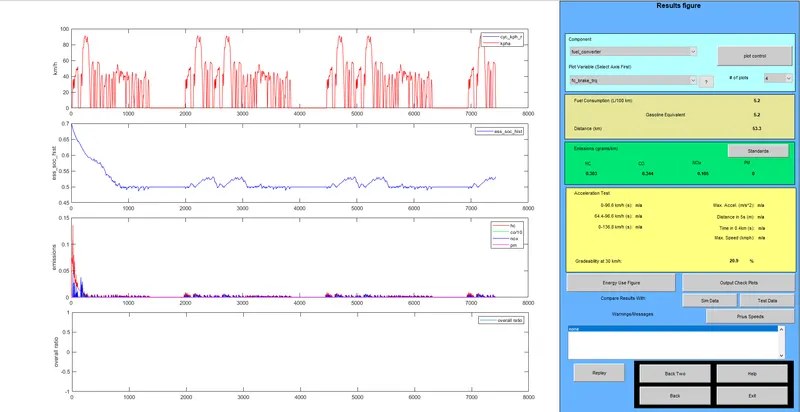
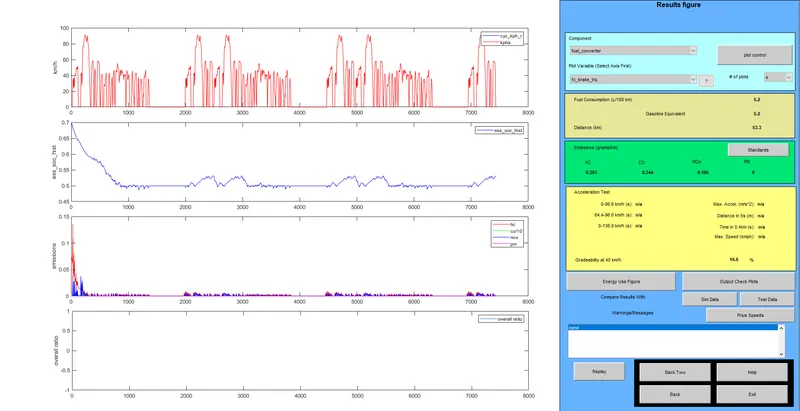
For a time duration of 10 s , the vehicle was tested for two different speed values.
- SPEED = 30 km/h
Gradeability = 20.9 %
- SPEED = 40 km/h
Gradeability = 16.6 %
Case 2 :
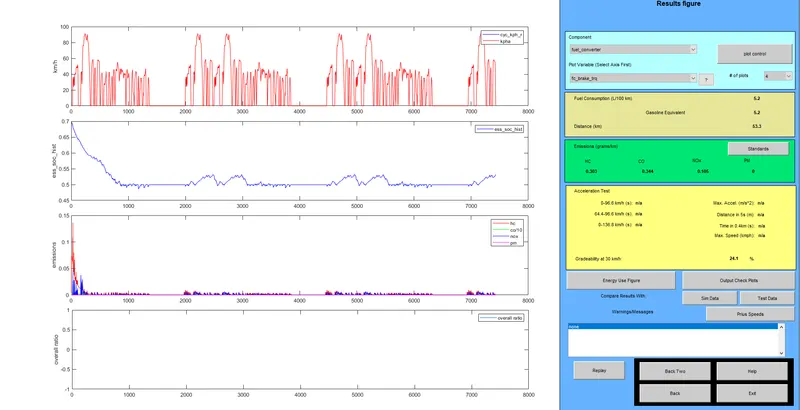
For a time duration of 20 s , the vehicle was tested for two different speed values.
- SPEED = 30 km/h
Gradeability = 24.1 %
- SPEED = 40 km/h
Gradeability = 19.8 %
Result :
From the above results it was clear that the Gradeability decreases as the Vehicle speed increases for both the time duration.
Hence we can conclude that Gradeability is inversely propotional to the Vehicle speed.
CONCLUSION :
All the given objectives were satisfied using th ADVISOR tool.
Some of the benefits of the ADVISOR tool includes,
- Reduces testing time to evaluate variousvehicle powertrain alternatives.
- Provides a shared simulation tool for government and industry.
- Assists the automotive industry to develop fuel-efficient vehicles and components.
Any given vehicle can be simulated and analysed using this tool.