Week-3 Challenge: ADVISOR Tool
Use the ADVISOR tool and simulate the following:
- For the EV_defaults_in file, if cargo mass is 500 kg with all other default conditions, can the vehicle travel 45 km with an FTP drive cycle? Conclude your observations.
- In the above case, try changing the battery capacity and repeat the simulation.
- Perform gradeability test with PRIUS_Jpn_defaults_in file. Compare your results in a table and conclude.
What is ADVISOR & Benefit from using it?
NREL’s ADvanced VehIcle SimulatOR is a set of model, data, and script text files for use with Matlab and Simulink. It is designed to rapidly analyse the performance and fuel economy of conventional, electric, and hybrid vehicles. ADVISOR also provides a backbone for the detailed simulation and analysis of user-defined drivetrain components, a starting point of verified vehicle data and algorithms from which to take full advantage of the modelling flexibility of Simulink and the analytic power of MATLAB.
Benefit from using ADVISOR if you want to:
- Estimate the fuel economy of vehicles that have not yet been built
- Learn about how conventional, hybrid, or electric vehicles use (and lose) energy throughout their drivetrains
- Compare relative tailpipe emissions produced on a number of cycles
- Evaluate an energy management strategy for your hybrid vehicle’s fuel converter
- Optimise the gear ratios in your transmission to minimise fuel use or maximise performance, etc.
The models in ADVISOR are:
- Mostly empirical, relying on drivetrain component input/output relationships measured in the laboratory, and
- Quasi-static, using data collected in steady-state (for example, constant torque and speed) tests and correcting them for transient effects such as the rotational inertia of drivetrain components.
ADVISOR was preliminarily written and used in November 1994. Since then, it has been modified to help manage the US DOE Hybrid Vehicle Propulsion System subcontracts. Only in January 1998 was a concerted development effort was undertaken to clean up and document ADVISOR.
Since then, over 4500 individuals have downloaded one or more versions of ADVISOR, including all OEMs and major suppliers. About 2/3 of the users are from industry and 1/3 from universities. A shortlist of major ADVISOR users includes:
- DaimlerChrysler
- Ford Motor Company
- General Motors Corp.
- Delphi Automotive Systems
- Visteon and hundreds of others
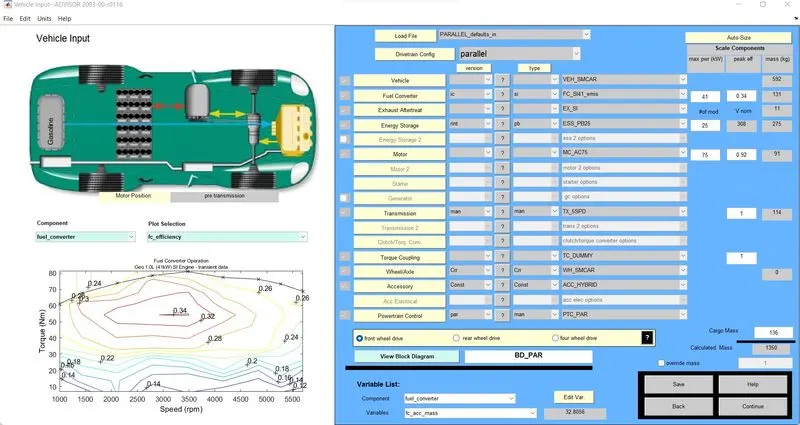
Q) For the EV_defaults_in file, if cargo mass is 500 kg with all other default conditions, can the vehicle travel for 45 km with an FTP drive cycle? Conclude your observations?
A)
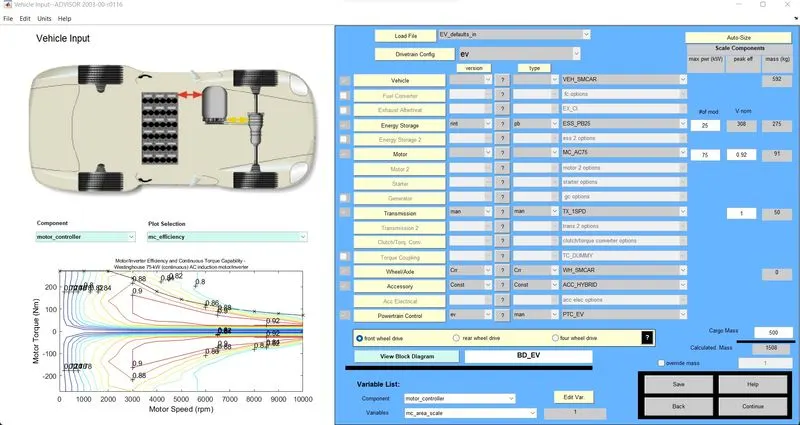
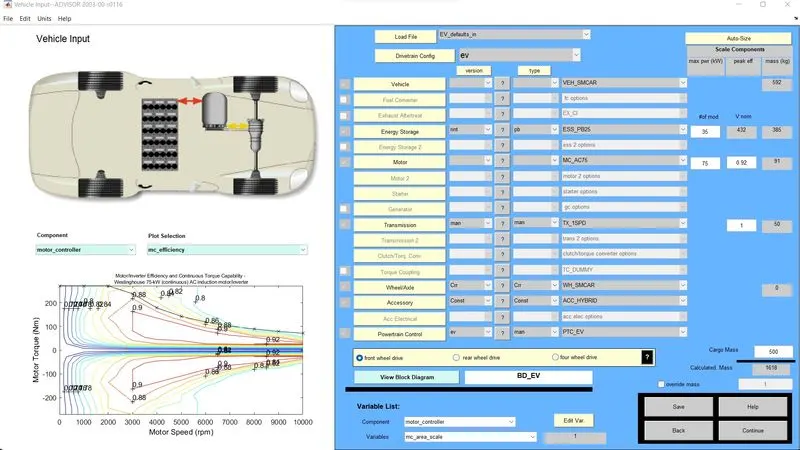
- First, select the EV_defaults_in from vehicle input windows in the load file.
- Next, change the cargo weight to 500 and click on continue.
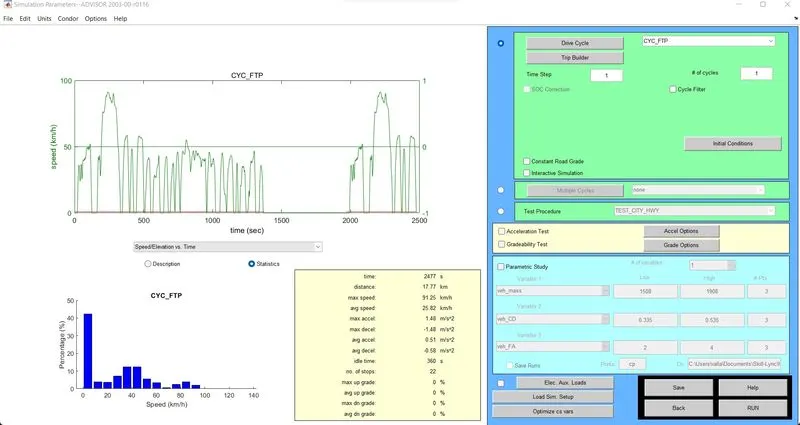
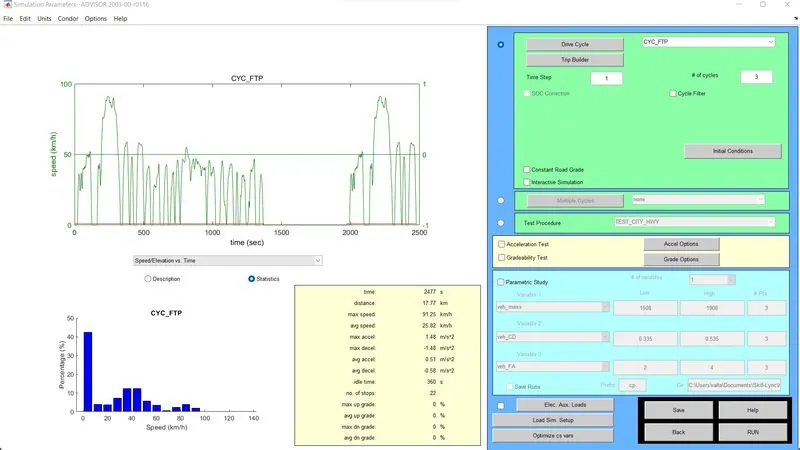
- Next, select CYC_FTP from the drive cycle window in the simulation parameter.
- Next, select the no of cycle #1 and click on RUN.
- Next, the results window will open with all the graphs and result values.
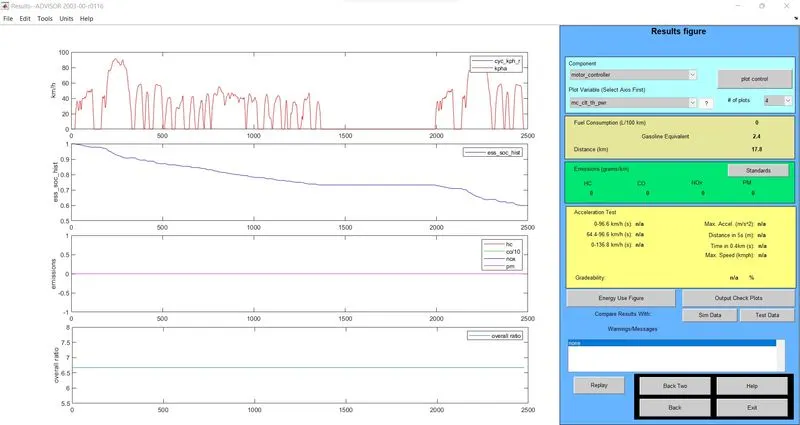
The distance travelled by the vehicle in drive cycle 1 was 17.8 km.
- Next, change the no of drive cycles to # 2 and click on RUN.
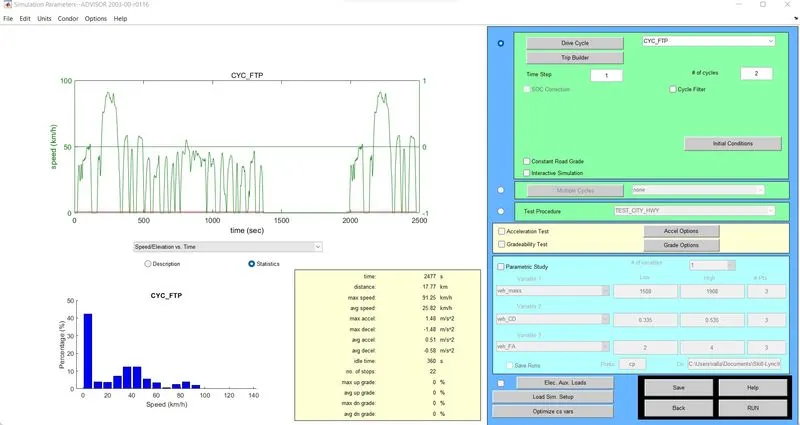
- Next, the results window will open with all the graphs and result values.
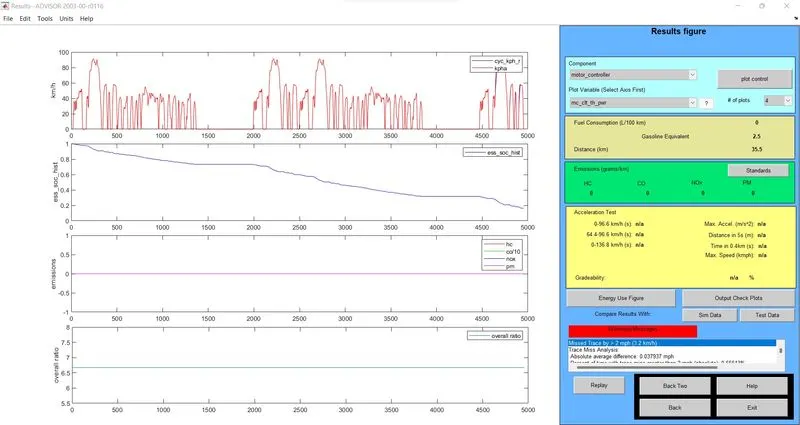
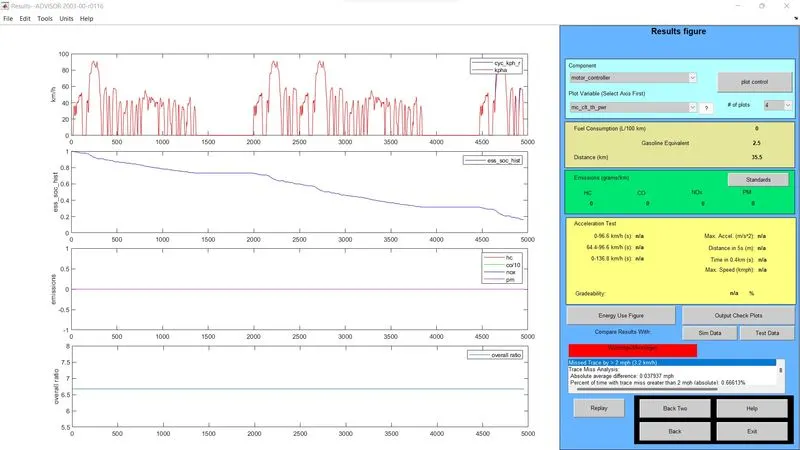
The distance travelled by the vehicle in drive cycle 2 was 35.5 km.
- Next, change the no of drive cycles to # 3 and click on RUN.
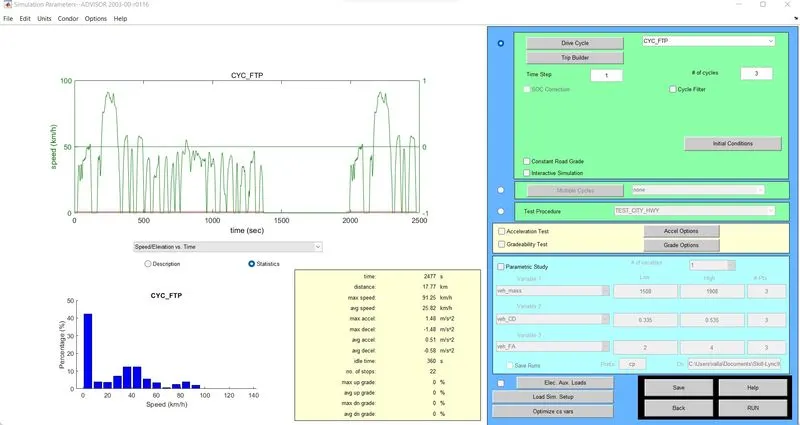
- Next, the results window will open with all the graphs and result values.
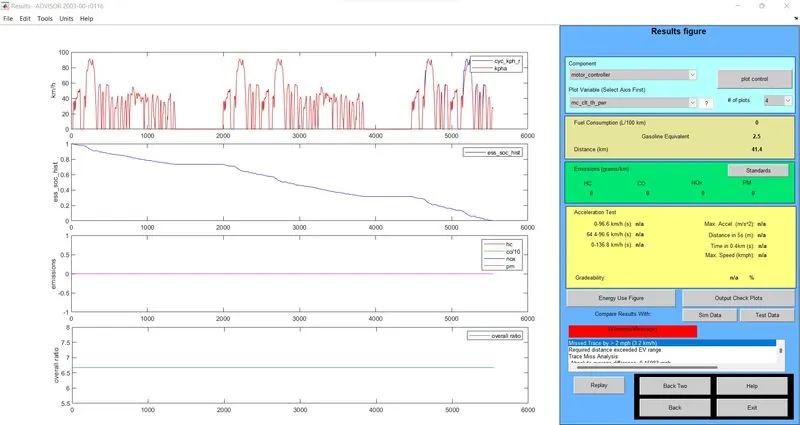
The distance travelled by the vehicle in drive cycle 3 was 41.4 km.
The conclusion results:
| The no of drive cycles used | Distance travelled by the vehicle in the respective drive cycles (Kms) |
| 1 | 17.8 |
| 2 | 35.5 |
| 3 | 41.4 |
We observe that the minimum distance the car travelled was 17.8 Kms with no drive cycles to be 1, and the maximum distance the vehicle travelled was 41.4 with no drive cycles to be 3. In the drive cycles, 100% of the battery was consumed. In conclusion, the car could not travel the distance of 45 km even in drive cycle three as there was insufficient SOC.
Q) In the above case, try changing the battery capacity and repeat the simulation?
A)
- In this case, we will be simulating in the same manner as the last one.
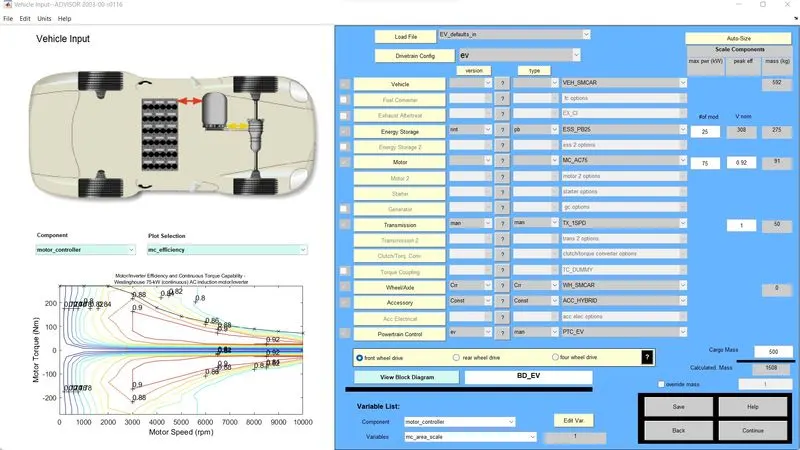
- The only things which we will be changing are the # of mod V nom and the cargo mass to 500kgs.
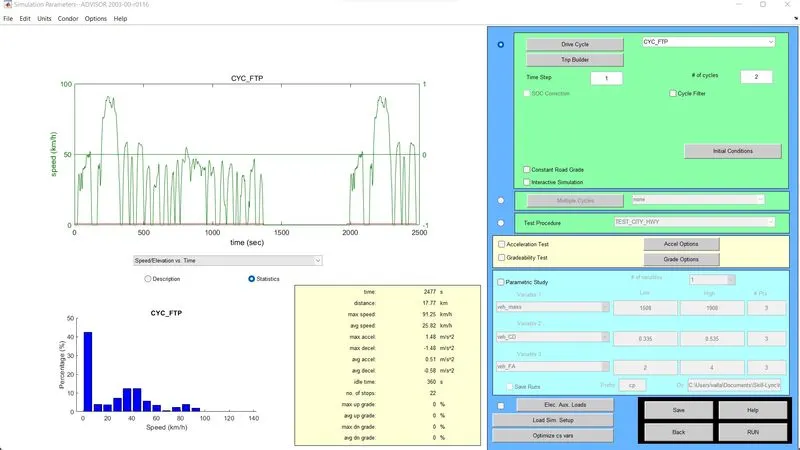
- Next, in the simulation parameter window, we will change the drive cycles to 2 & 3 and run the simulation.
(i) No of modules = 25 and the no of drive cycles = 2
(ii) No of modules = 30 and the no of drive cycles = 2
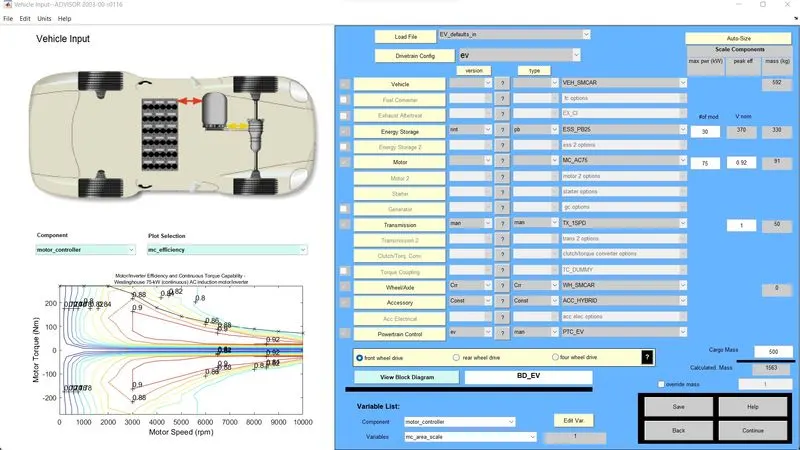
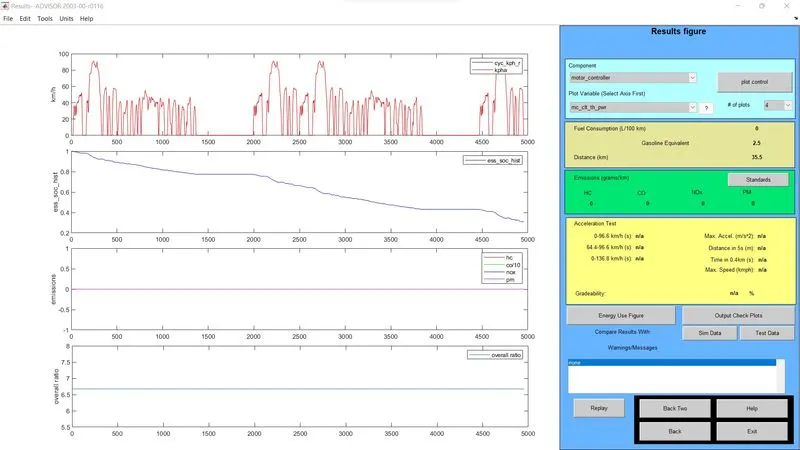
(iii) No of modules = 35 and the no of drive cycles = 2
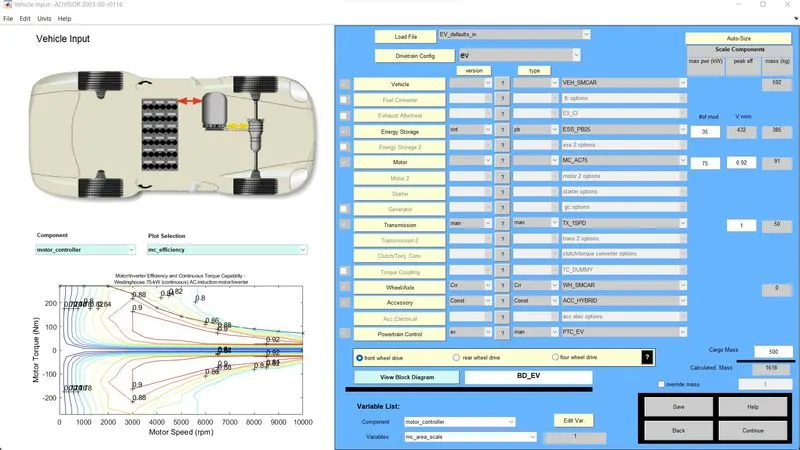
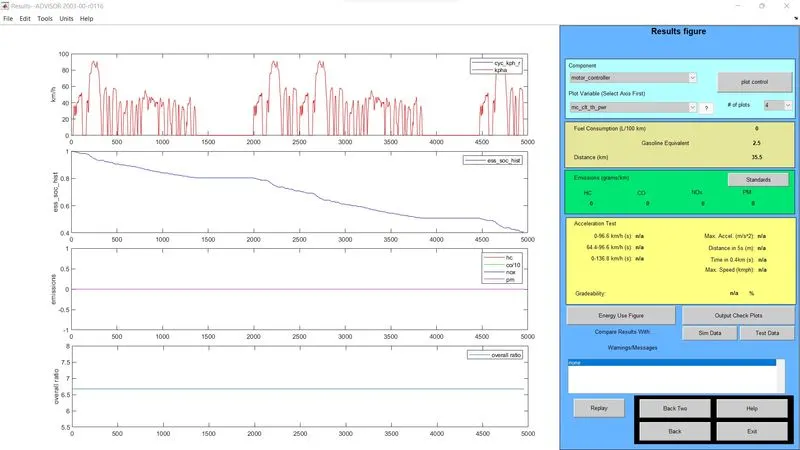
(iv) No of modules = 25 and the no of drive cycles = 3
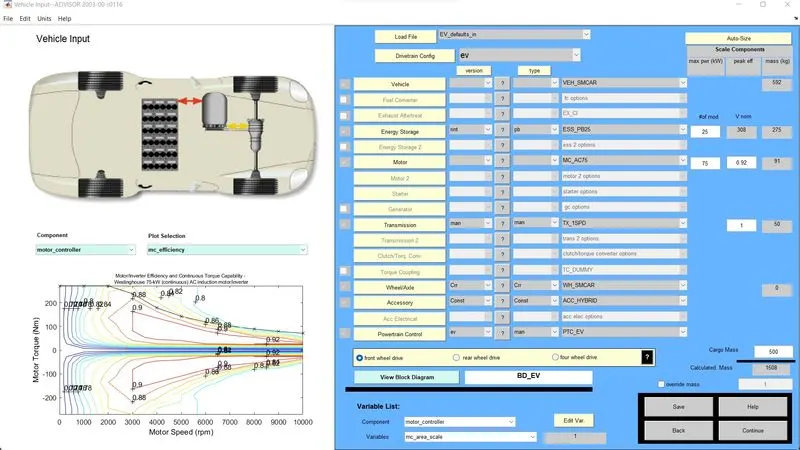
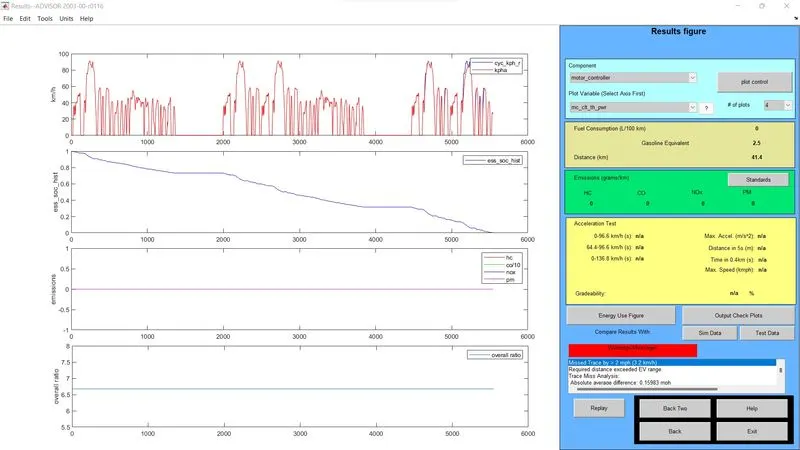
(v) No of modules = 30 and the no of drive cycles = 3
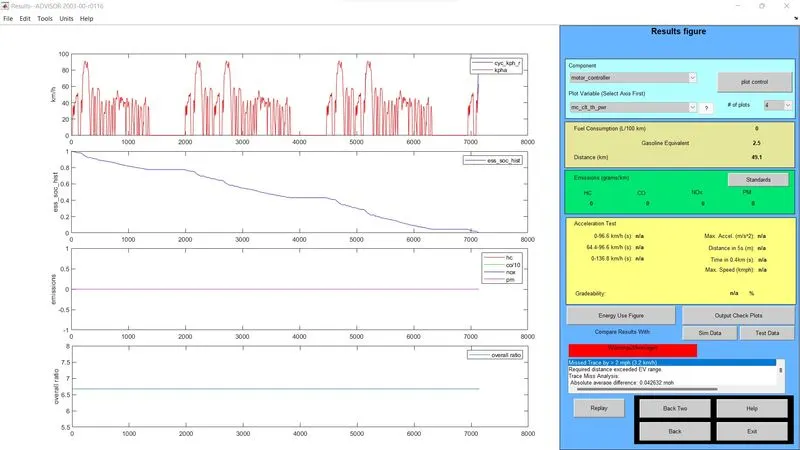
(vi) No of modules = 35, and the no of drive cycles = 3
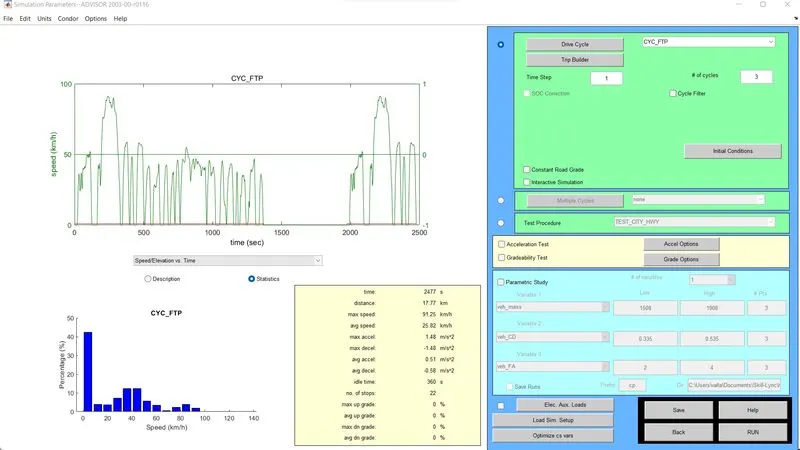
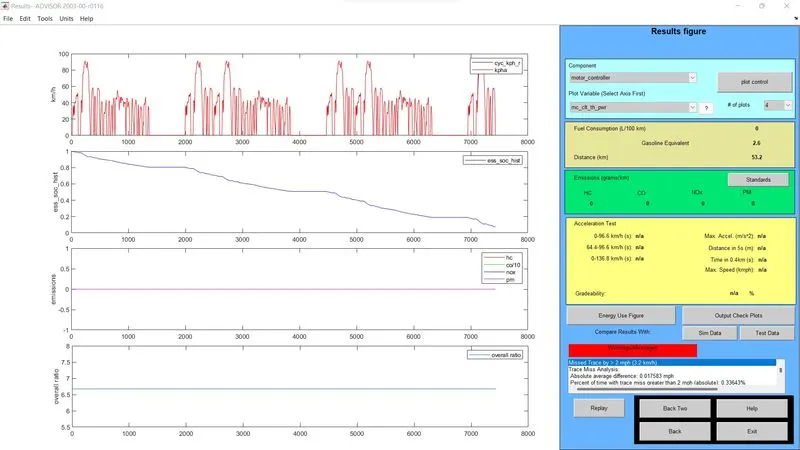
The conclusion results:
|
The no of drive cycles used = 2 |
|
No of the Modules used |
Distance travelled by the vehicle in the respective drive cycles (Kms) |
| 25 | 35.5 |
| 30 | 35.5 |
| 35 | 35.5 |
|
The no of drive cycles used = 3 |
|
No of the Modules used |
Distance travelled by the vehicle in the respective drive cycles (Kms) |
| 25 | 41.4 |
| 30 | 49.1 |
| 35 | 53.2 |
In these simulations, we observe that for two drive cycles, the distance travelled remains constant, i.e., 35.5 km. And when we change to 3 drive cycle the distance travelled gets changes and it takes on 30 modules to travel 45 km.
Q) Perform gradeability test with PRIUS_Jpn_defaults_in file. Compare your results in a table and conclude?
A)
- First, select the PRIUS_Jpn_default model from vehicle input windows in the load file and click continue.
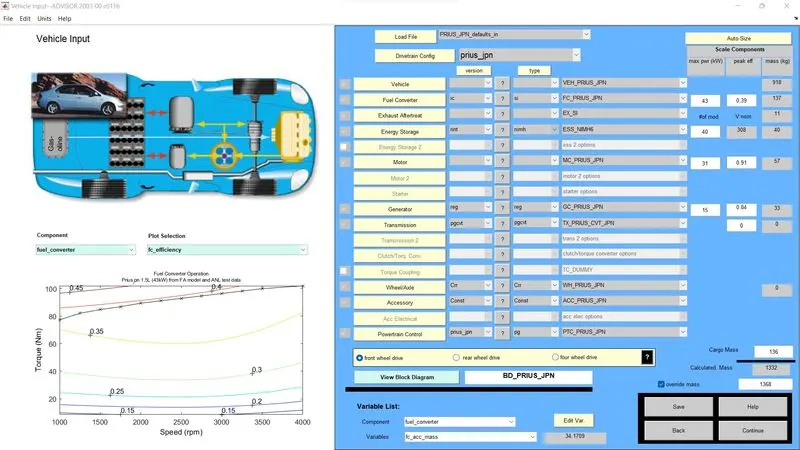
- Next, select the gradeability test, click on the grade, and set the duration to be 60 secs. We keep changing the speeds from 20 mph to 60 mph with ten mph.
- Select All system enabled and constant road grade.
- Next, click on RUN and run the simulations.
(i) Speed = 20 mph; Duration = 60 secs.
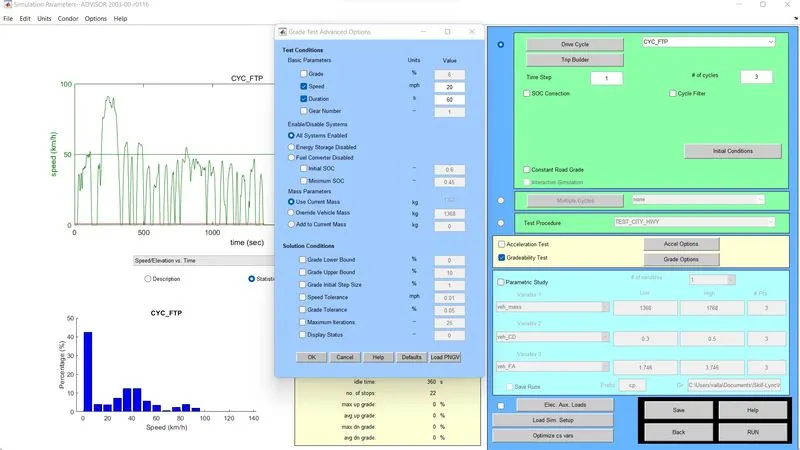
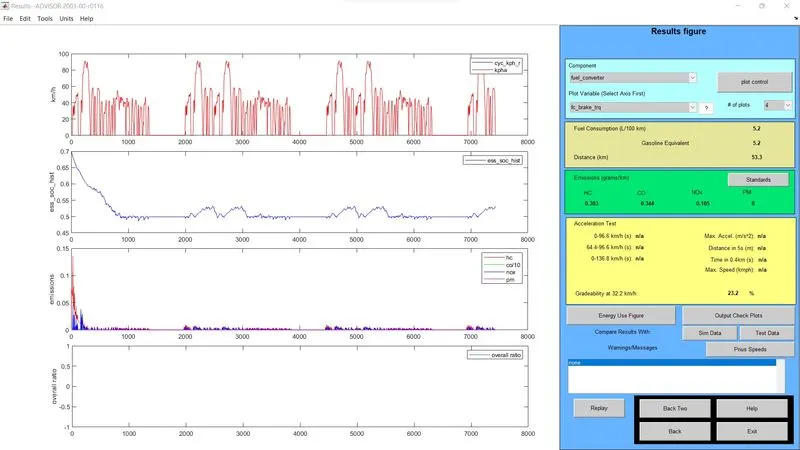
The gradability at 32.2 kmph is 23.2%.
(ii) Speed = 30 mph; Duration = 60 secs.
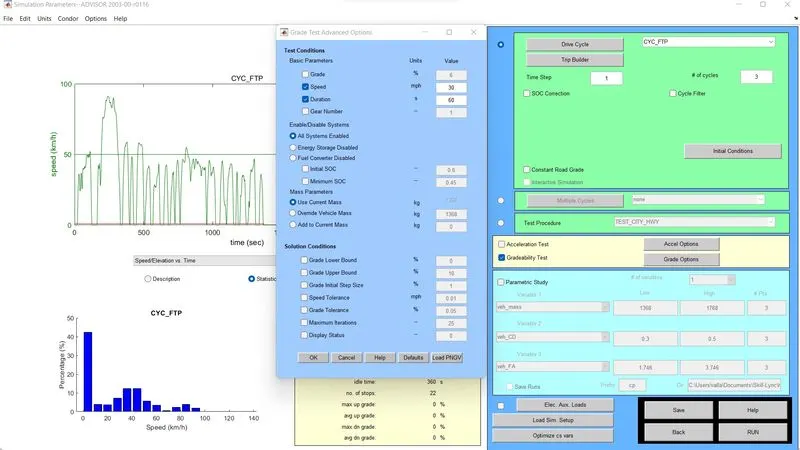
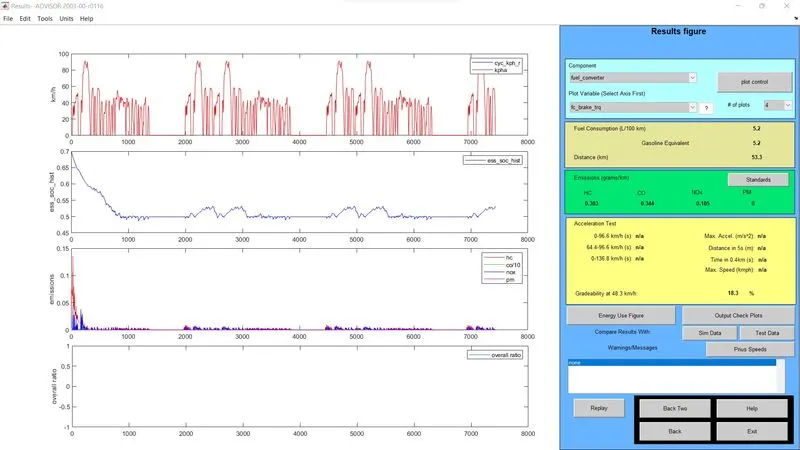
The gradability at 48.3 kmph is 18.3%.
(iii) Speed = 40 mph; Duration = 60 secs.
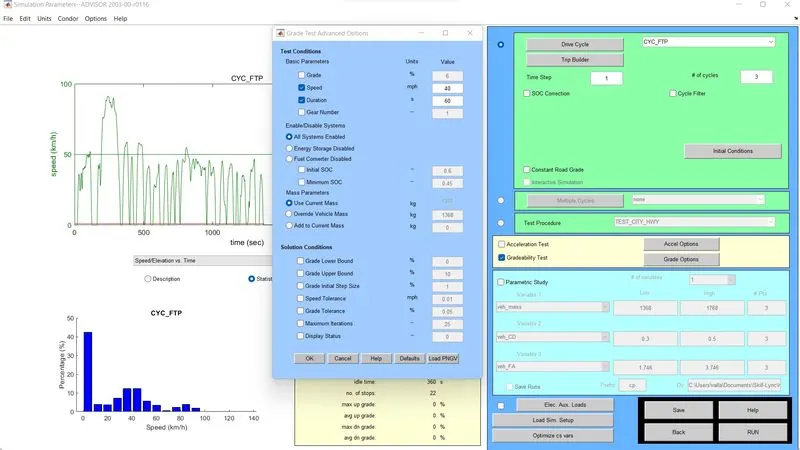
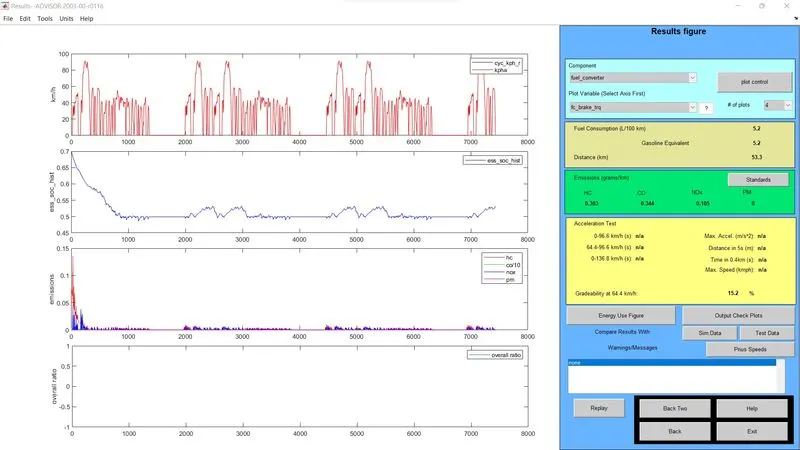
The gradability at 64.4 kmph is 15.2%.
(iv) Speed = 50 mph; Duration = 60 secs.
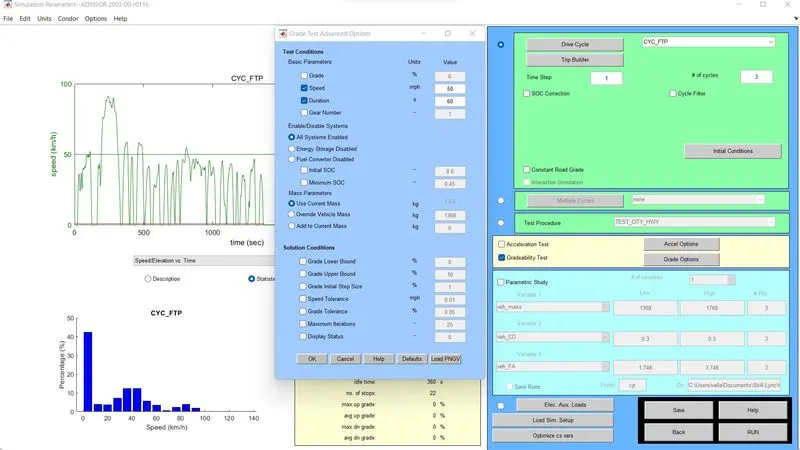
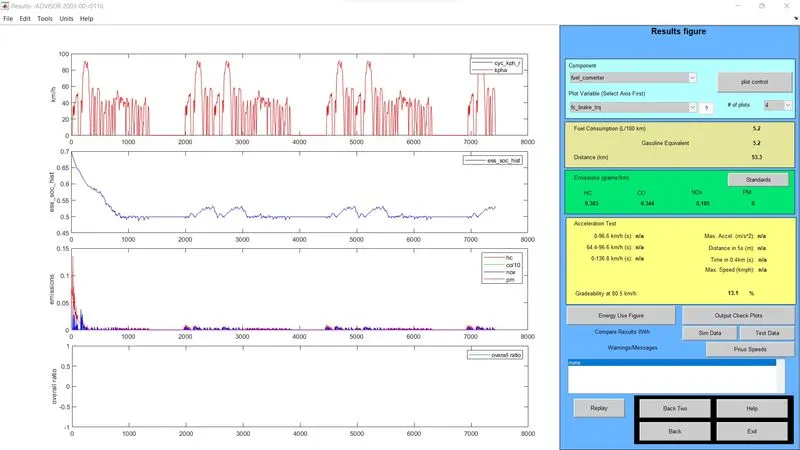
The gradability at 80.5 kmph is 13.1%.
(v) Speed = 60 mph; Duration = 60 secs.
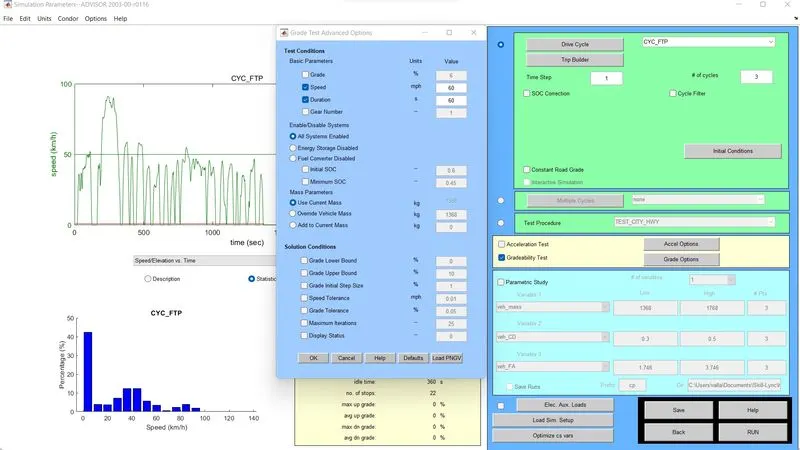
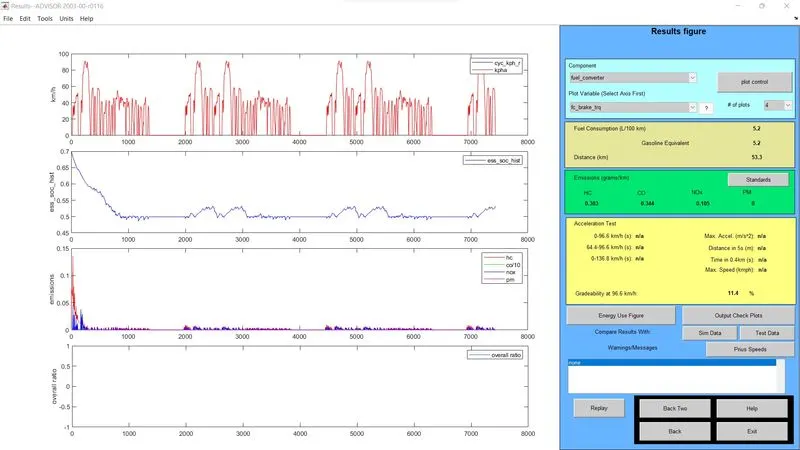
The gradability at 96.6 kmph is 11.4%.
The conclusion results:
| Speed (MPH) | Gradability (%) |
| 20 | 23.2 |
| 30 | 18.3 |
| 40 | 15.2 |
| 50 | 13.1 |
| 60 | 11.4 |
From the above table, we observe that when the vehicle's speed increases as time stay constant, the car's gradability decreases.