Week-3 Challenge: ADVISOR Tool
ADVISOR TOOL
AIM-Understand the use of advisor tool.
OBJECTIVE-Use ADVISOR tool and simulate the following-
1) EV with cargo mass of 500kg running FTP drive cycle.
2) EV with cargo mass of 500kg running FTP drive cycle with increased battery capacity.
3) Gradeability test of Toyota Prius.
BODY OF WORK
1) EV with cargo mass of 500kg running FTP drive cycle.
ADVISOR tool is a Matlab program used to simulate vehicle behavior for different drivetrains on different user selectable drive cycles. The program has a graphical user interface which makes selection of variables and parameters easier. The first requirement is to choose the drivetrain. In this case the EV_defaults_in file is selected for simulation of electric vehicle. Details are given in figure 1.
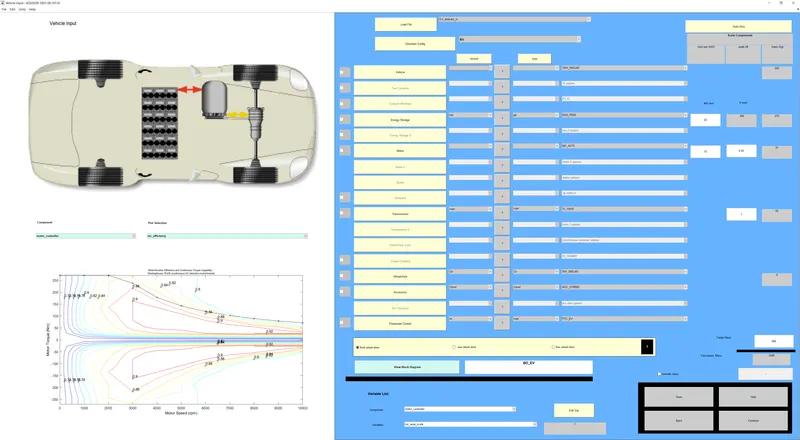
Figure 1-Simulated Electric Vehicle
From the preview on the top left we can see the battery electric vehicle has 25 battery modules and an electric motor powering the front axle of the vehicle. At the bottom left of the image, we see a graph for torque vs speed of the 75 kW AC induction motor powering the vehicle along with its associated efficiency contours. The lead acid battery pack has a nominal voltage of 308 volts and capacity of 27725 kJ. The vehicle weighs 1508 kg with its 500 kg payload.
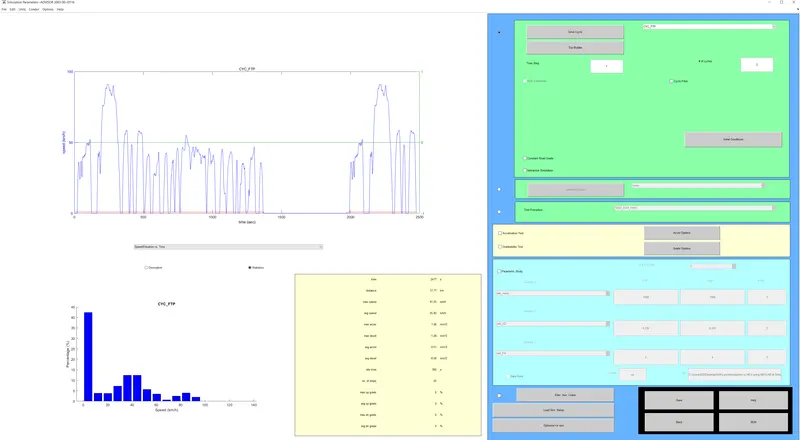
Figure 2-FTP Drive Cycle Details
The drive cycle must be selected next. For this simulation, the FTP drive cycle is selected as shown in figure 2. The speed vs time graph for the target cycle is shown at the top left of the screen. At the bottom left we can see a statistical analysis of how long the vehicle should spend at certain speeds as a percentage of the time taken to run the cycle. Each cycle lasts for 2477 seconds and covers 17.77 km assuming the vehicle does not deviate from target speed. This cycle is run 3 times with no gradient. Thus, when one cycle ends, the next cycle begins without delay and without recharging the battery.
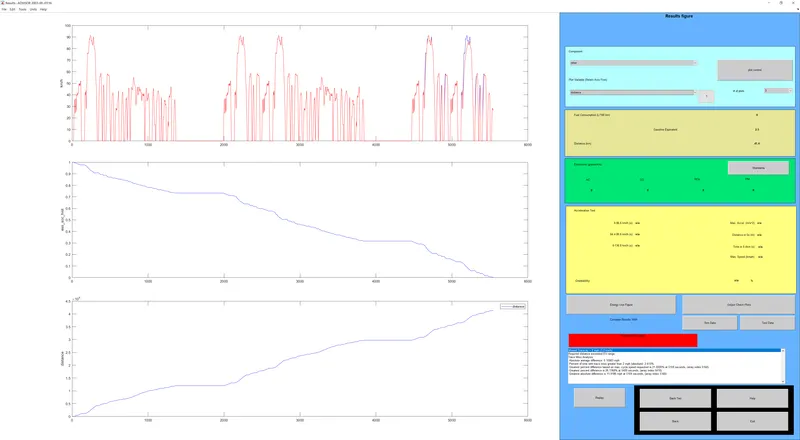
Figure 3-Simulation Results
The simulation results are shown in figure 3. From the top left graph, we can see the speed vs time graph for the target cycle overlayed with the achieved cycle. The actual drive cycle achieved (shown in red) differs slightly from the target drive cycle (shown in blue) as the vehicle is unable to generate the power required to accelerate the mass of the vehicle along with its payload under heavy acceleration.
The second graph shows the percentage charge of the battery pack vs time. It starts off at 100 percent and reduces to zero. This shows that the vehicle ran out of charge before the cycle was completed.
In the third graph we see the distance covered vs time taken by the vehicle. The vehicle runs out of charge at 41.4 km. Thus, this vehicle cannot travel 45 km on a single charge with its current battery capacity on the FTP drive cycle.
2) EV with cargo mass of 500kg running FTP drive cycle with increased battery capacity.
The simulation is run again using the same drive cycle conditions but with a battery pack with an increased energy capacity of 31075 kJ from 28 battery modules rather than 25. The vehicle is shown in figure 4 below.
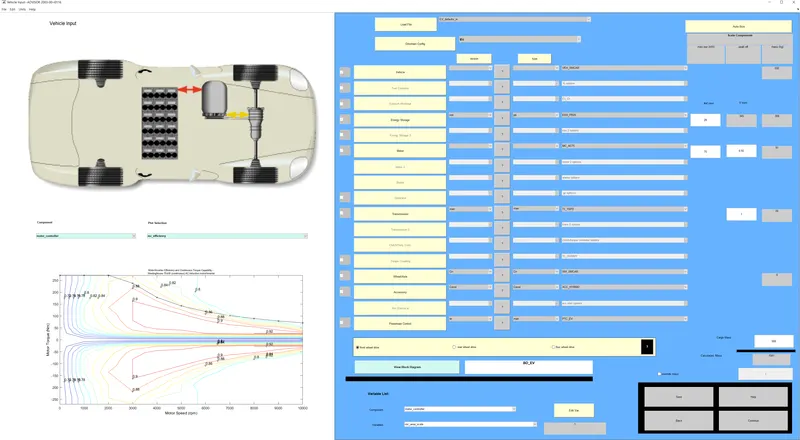
Figure 4-Simulated Electric Vehicle with Increased Battery Capacity
The payload of the vehicle remains the same at 500 kg. However, the overall weight of the vehicle has increased to 1541 kg due to the added batteries. The nominal voltage of the battery has increased to 345 volts.
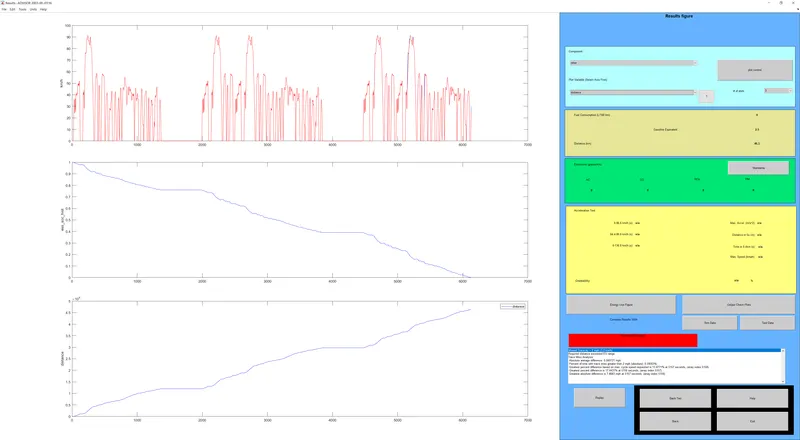
Figure 5-Simulation Results with Increased Battery Capacity
From figure 5 we can see the simulation results have improved. The drive cycle achieved still varies slightly from the target drive cycle, but this has an insignificant effect on the results. The vehicle can now travel 46.3 km before it runs out of charge. Thus, with its increased battery capacity the vehicle can travel over 45 km on the FTP cycle on a single charge.
3) Gradeability test of Toyota Prius.
A Toyota Prius is simulated to assess its ability to climb gradients. A preview of the vehicle drivetrain is shown in figure 6.
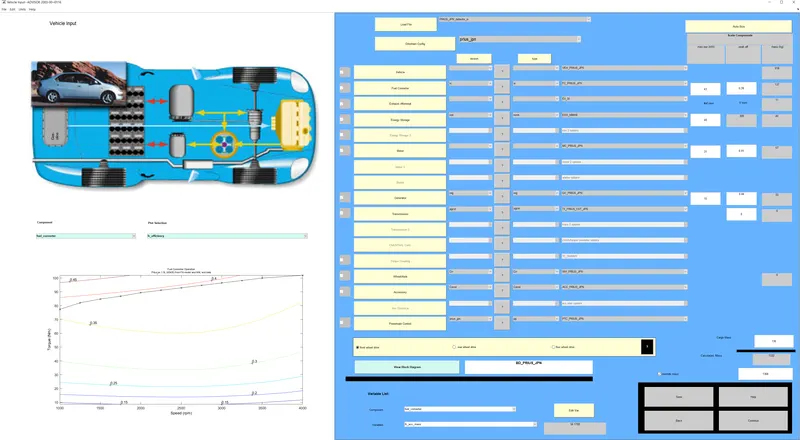
Figure 6-Toyota Prius Drivetrain
The Prius has a hybrid drivetrain consisting of a 43 kW internal combustion engine, a 31 kW electric motor/generator and a 15 kW motor/generator to switch seamlessly between series and parallel hybrid mode and also select the most efficient control strategy to use as little fuel as possible. This is achieved using a power split device in the form of an epicyclic gearbox as shown in the diagram. The more powerful electric motor is connected to the sun gear. The internal combustion engine is connected to the planet carrier and the less powerful electric motor is connected to the ring gear. The car weighs 1368 kg overall, including its 40 kg battery.
The details of the gradeability test cycle are shown in figure 7 below.
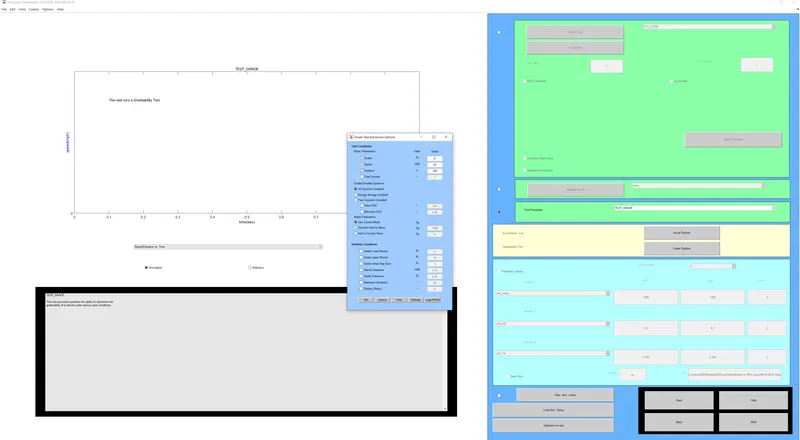
Figure 7-Prius Gradeability Test Cycle
The test is carried out at a constant speed of 55 mph/88.5 kph. The uphill grade is constant at 6%. The test is carried out for 100 seconds.
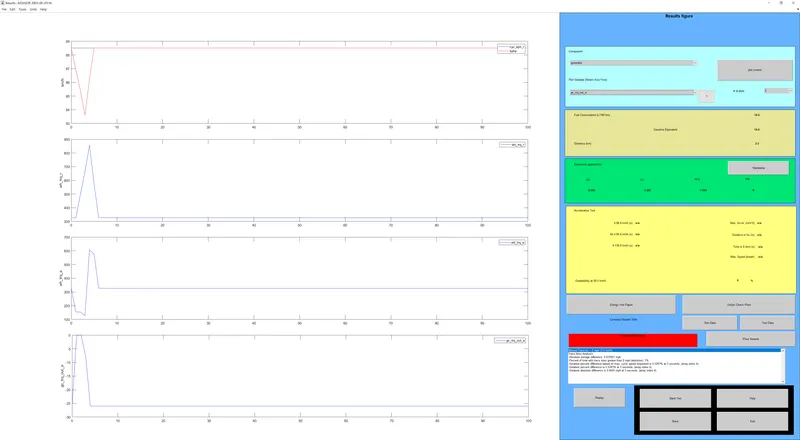
Figure 8-Simulation Results Part 1
Figure 8 shows the speed versus time graph at the top left corner. Here we can see the requested drive cycle in blue and the achieved drive cycle shown in red. The achieved drive cycle dips below the target drive cycle by up to 4.89 kph and then catches up with the requested drive cycle near the 5 second mark. Being a vehicle trying to climb a grade, the torque needed to drive the vehicle up the slope is more than that required on a flat surface. Because of the way the power split device works and its ability to switch between control regimes, it decides to function in hybrid rather than pure electric mode to tackle the gradient.
The rotational inertia of the components coupled with the need for the smaller electric motor to start working as a generator to charge the battery causes a small deviation from the ideal driving cycle.
The second graph from the top shows the requested torque at the wheel to keep the speed of the vehicle constant. The actual torque at the wheel shown in the third graph falls short of the target torque, which causes the deviation in speed. The torque of the less powerful electric motor is shown in the fourth graph. This shows the torque working in the negative regime as it works as a generator to charge the battery. However, to close the gap between the torque delivered at the wheel and the wheel torque requested, it temporarily provides zero drag torque.
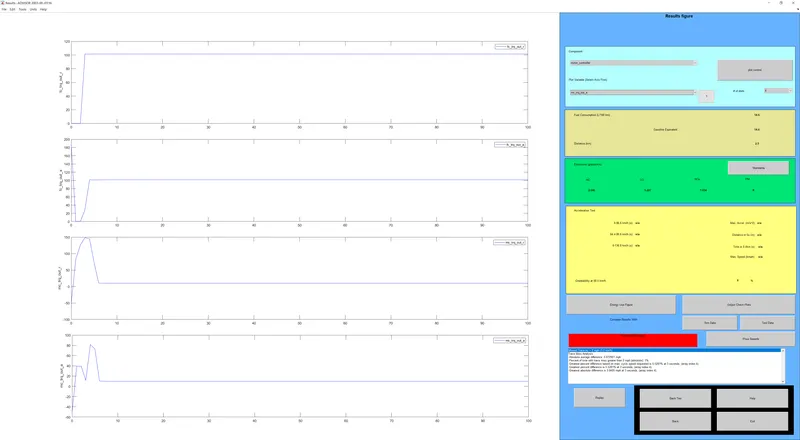
Figure 9-Simulation Results Part 2
In figure 9, the target torque of the internal combustion engine is shown in the top graph, with the second graph showing the torque achieved by the internal combustion engine. The internal combustion engine just starts turning at the beginning of the simulation and needs time to achieve its target torque and speed. The target torque of the more powerful electric motor is shown in the third graph and the torque achieved by said motor is the last graph shown. The electric motor must limit the torque it produces as to allow the internal combustion engine to achieve required speed as the engine can only rotate in one direction and must achieve a certain rpm to provide requested torque. Once the internal combustion engine reaches the required torque requested by on board computer, the electric motor can momentarily provide high torque as well until vehicle accelerates back to 88.5 kph. Once target speed is achieved, this electric motor provides very low torque, allowing the combustion engine to provide most of the power and also charge the battery using the smaller electric motor.
|
Test condition |
No grade |
6% grade |
|
Fuel energy usage |
2697 kJ |
11434 kJ |
|
Electric motor energy usage (31 kW) |
17 kJ |
401 kJ |
|
Electric motor energy usage (15 kW) |
515 kJ |
7 kJ |
|
Battery energy used |
-131 kJ |
726 kJ |
|
Energy generated in regen |
556 kJ |
9 kJ |
Table 1-Energy Usage Between different test conditions
From table 1 we can see that the Prius decides to work with reduced power when cruising at constant speed on a flat surface using minimal output from the internal combustion engine and draining the battery to power the electric motor. However, while climbing a 6% gradient, it runs in hybrid regen mode. This feeds energy to the battery rather than deplete energy from it and using the internal combustion engine to its fullest extent.
CONCLUSION
1) The vehicle simulated by EV_default_in cannot travel 45 km on repeated FTP cycles with its default battery capacity of 27725 kJ.
2) The vehicle simulated by EV_default_in can travel over 45 km on repeated FTP cycles with increased battery capacity of 31075 kJ.
3) Toyota Prius switches to hybrid regen mode while climbing gradient. By nature, the internal combustion engine can only rotate in one direction and can only provide power above idle rpm. This causes a small drop in torque output while changing power regime, until combustion engine reaches target speed and torque.