ADVISOR Tool
AIM - 1
1. For EV_defaults_in file, if cargo mass is 500 kg with all other default conditions, can the vehicle travel for 45 km with FTP drive cycle? Conclude your observations.
Introduction to ADVISOR - ADvanced VehIcle SimulatOR
This tool, originally developed by the National Renewable Energy Laboratory (NREL), allows users to simulate and analyze conventional, advanced, light, and heavy vehicles, including hybrid electric and fuel cell vehicles. The tool allows users to assess the effect of changes in vehicle components ( such as motors, batteries, catalytic convertors, climate control systems, and alternative fuels) and other modifications that might affect fuel economy, performance, or emissions. This allows system-level analysis and trade-off studies of advanced vehicles.
ADVISOR approximates the continuous behavior of a vehicle as a series of discrete steps during each of which the components are assumed to be a steady-state. That is, at each time step, the effects of changing current, voltage, torque, and RPM are neglected. This allows efficiency or power loss tables, which are generated by testing a drivetrain component at a fixed torque and RPM (and current and voltage, if applicable), to be used to relate the power demands of the components at each time step. A significant advantage of using a model that is in the Simulink/MATLAB environment is the flexibility and ease of changing the model, such as replacing one control strategy or regenerative braking algorithm with another.
MATLAB also allows easy plotting of results that make a detailed analysis of vehicle configurations possible. ADVISOR is driven by the input driving profiles which can be the classic speed vs time, or a speed and grade vs time driving profile. With a given driving profile goal, ADVISOR then works its way backward from the required vehicle and wheel speeds to the required torques and speeds of each component between the wheels and the energy source, which is either fuel from the hybrid power unit (HPU) or electricity from the batteries. Limits for each of the components are included, so the actual speed vs time profile computed is the one that is within the limits of all components and included all component losses and vehicle drag.
Now to check if the vehicle can travel for 45 km with an FTP drive cycle with a 500 kg cargo mass we need to open the EV_defaults_in file and enter the inputs. When we open the ADVISOR tool and select the required file we get a window as shown below. 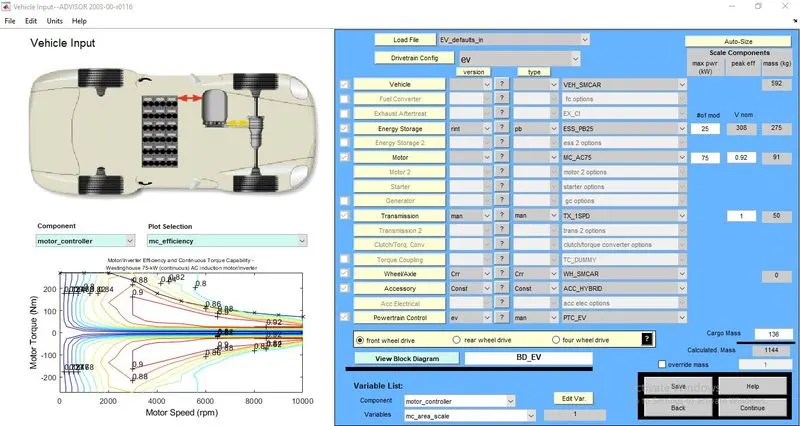
The vehicle input description and the plot of motor efficiency are shown below.
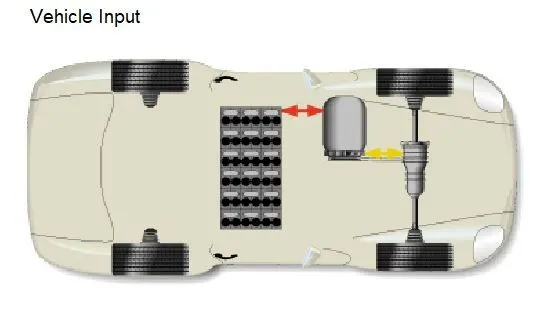
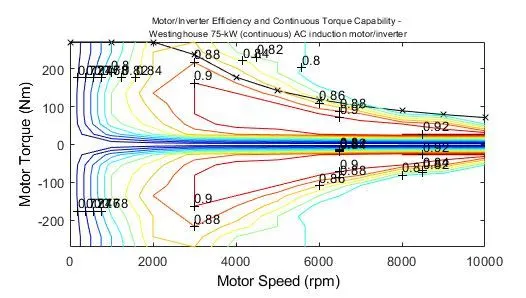
We need to change the cargo mass input from the original 136 kg to 500 kg as shown below.
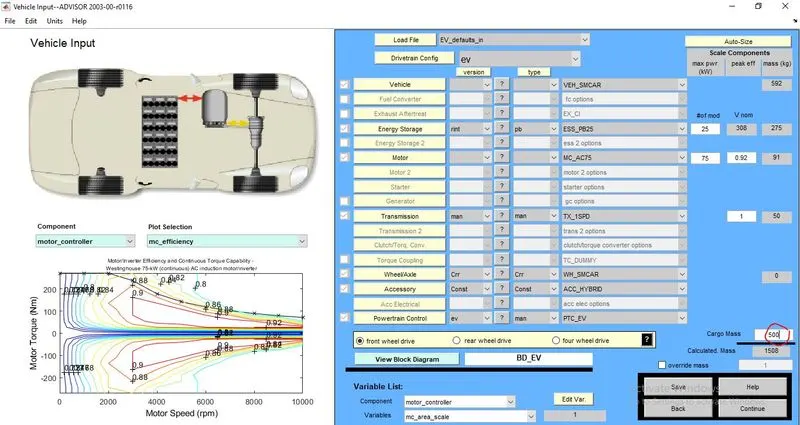
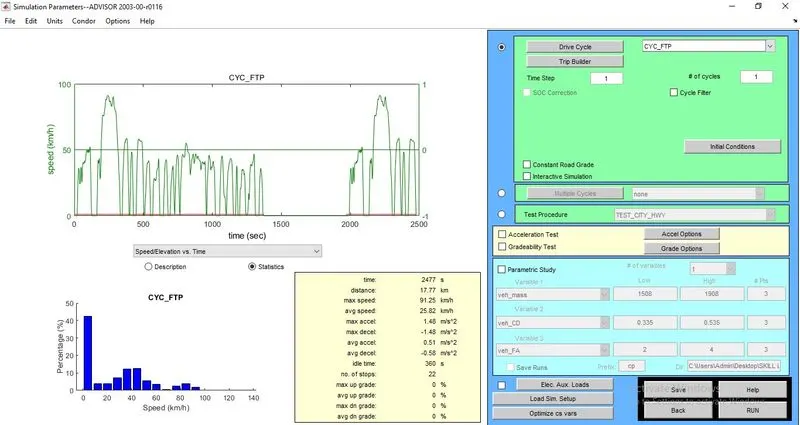
Now after changing the cargo mass and selecting continue, we need to select the FTP drive cycle from the drop-down list.
We can see from the below image that one cycle completes a total distance of 17.77 km, so for the vehicle to complete 45 km, it needs to complete a total of 3 drive cycles. Hence we change the '# of cycles' to 3. After this step, we can run the model and check the results
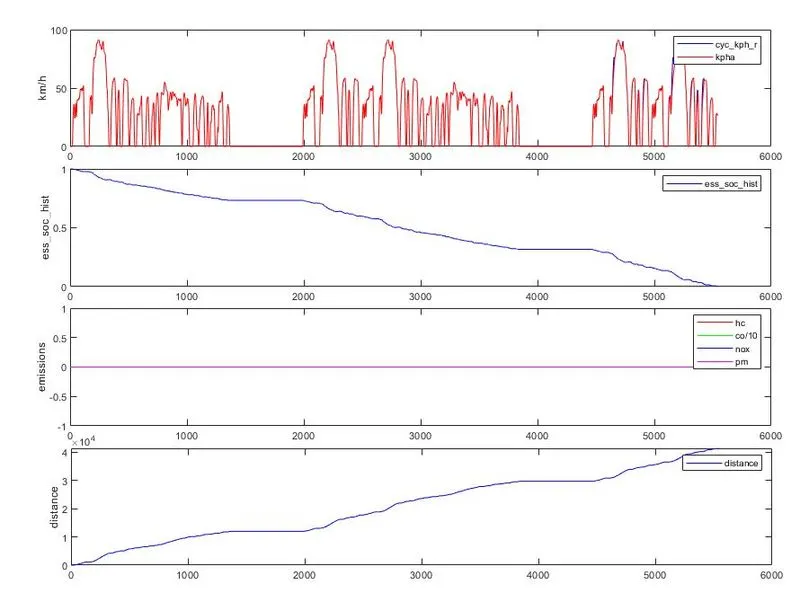
The below image shows us the result window.
OBSERVATIONS -
1. We can observe the drive cycles in the first plot.
2. We can observe from the above plots, the state of charge will come down from 100% to 0% at around 5500 seconds
3. We also observe that the emissions are 0 throughout as it is an electric vehicle.
4. The total distance it covers with the current battery capacity is 41.4 km as shown below
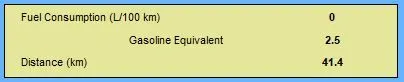
Hence we can say that the vehicle fails to travel the distance of 45 km with an FTP drive cycle and cargo mass of 500 kg.
AIM - 2
2. In the above case, try changing the battery capacity and repeat the simulation.
We can change the number of modules in the energy storage in the above case as shown below.


We have increased the value from 25 to 30 modules and we can see the nominal voltage has increased from 308 to 370 Volts and the total mass of the energy unit has increased from 275 to 330 kg.
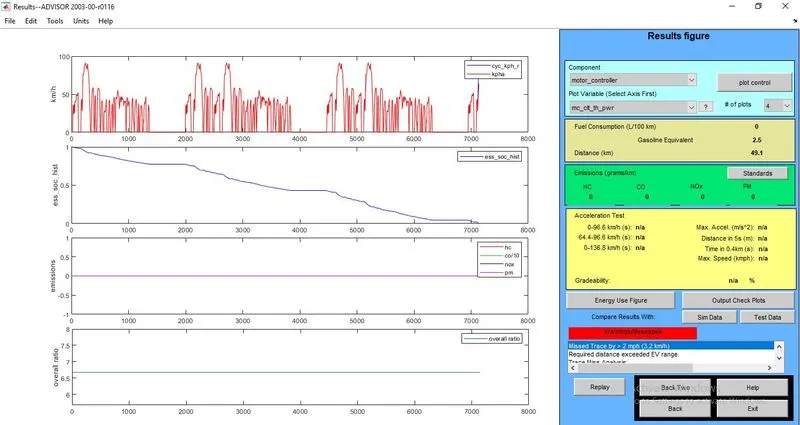
Keeping the rest of the parameters the same, we run the model and get the below results.
OBSERVATIONS -
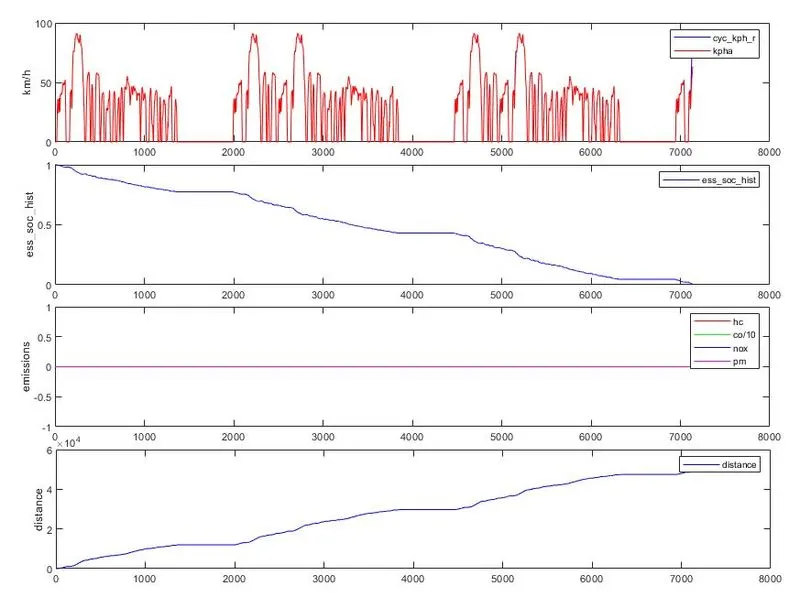
1. We can observe the drive cycles in the first plot.
2. We can observe from the above plots, the state of charge will come down from 100% to 0% above 7000 seconds
3. We also observe that the emissions are 0 throughout as it is an electric vehicle.
4. The total distance it covers with the current battery capacity is 49.1 km as shown below

Hence, we can conclude that the vehicle will travel a distance of 45 km with a cargo mass of 500 kg and an FTP drive cycle if the number of battery modules is 30.
We can also change the battery type and see if the result can be achieved. 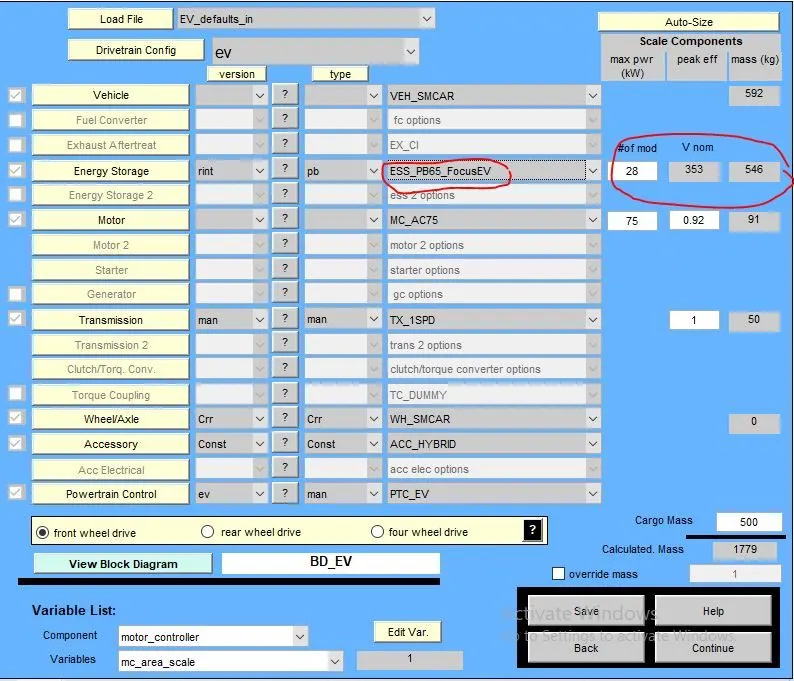
The type is changed to ESS_PB65_FocusEV from ESS_PB25 which has a total of 28 modules with a nominal voltage of 353 V and a total mass of 546 kg. With the FTP drive cycle selected, we run the model.
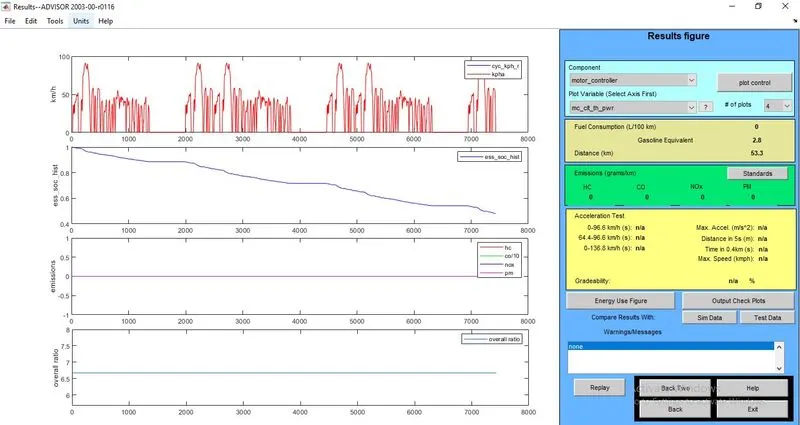
We can observe from the above image that the state of charge will be at 0.5% at the end of the 3 drive cycles and covers a total distance of 53.3 km.
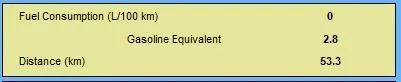
Hence we can achieve the required range by changing the type of energy storage in the vehicle too.
AIM - 3
3. Perform gradeability test with PRIUS_Jpn_defaults_in file. Compare your results in the table and conclude.
Select the PRIUS_Jpn_defaults_in file in the drop-down list after opening the ADVISOR tool.
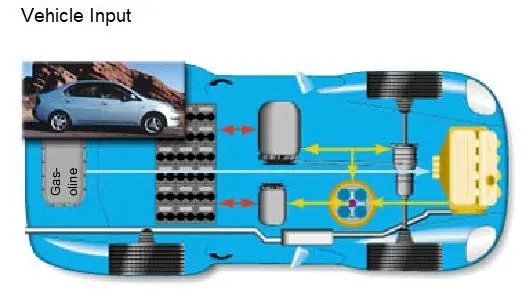
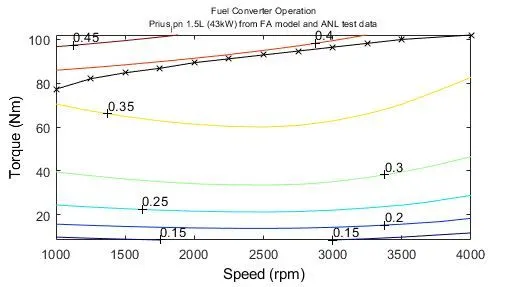
The Motor characteristics
Vehicle Configuration -
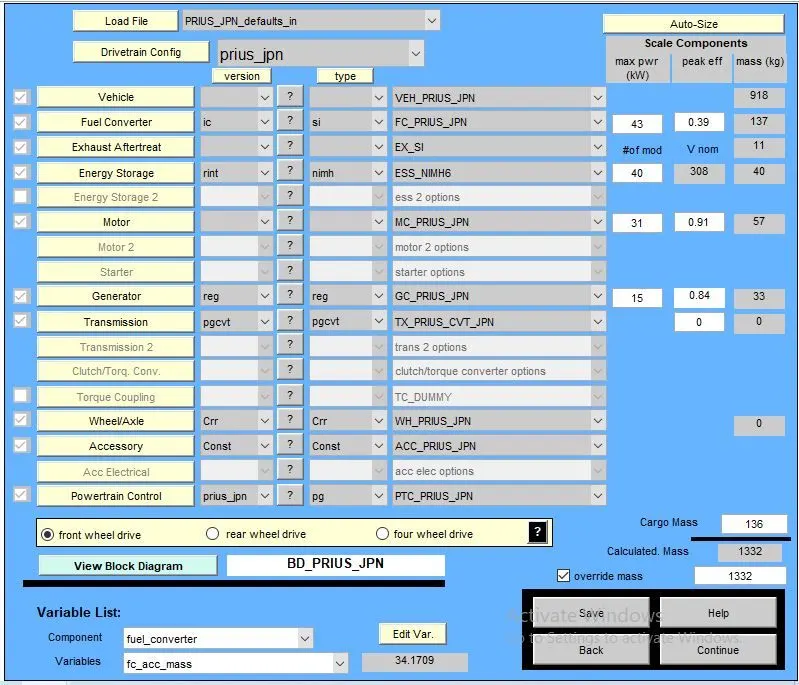
The vehicle configuration will remain unchanged. For the gradeability test, we can select the drive cycle of choice, here we will select the 'CYC_ECE_EUDC' as shown below.
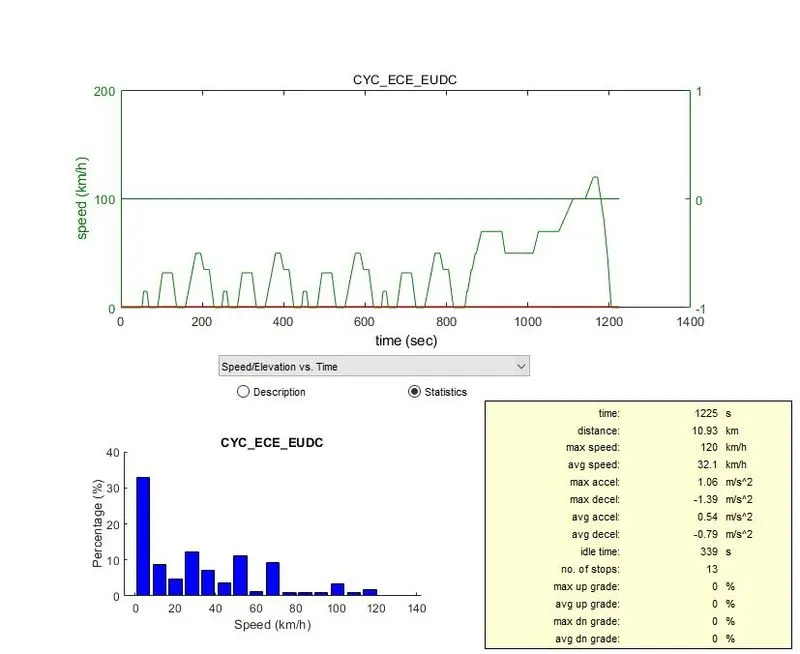
To perform the gradeability test, we need to select the option as shown below.

Then we select the grade options and make the necessary changes as shown below.
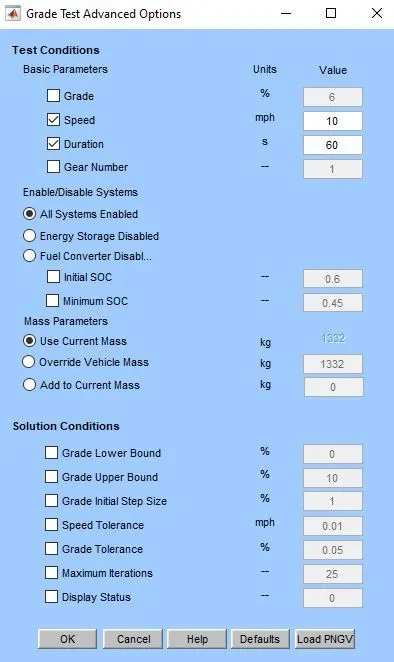
After adding the inputs, we can run the model and the results are shown below.
1. Vehicle at 10 mph for 60 seconds
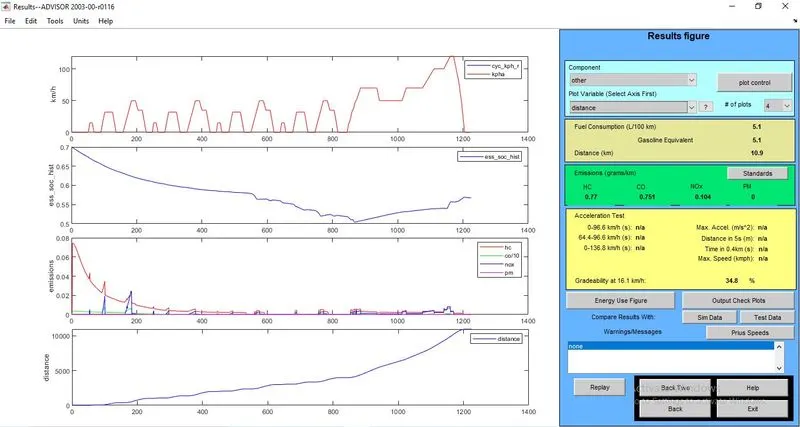
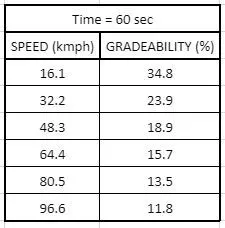
The gradability is 34.8% with a speed of 16.1 kmph for 60 seconds.
2. Vehicle at 20 mph for 60 seconds
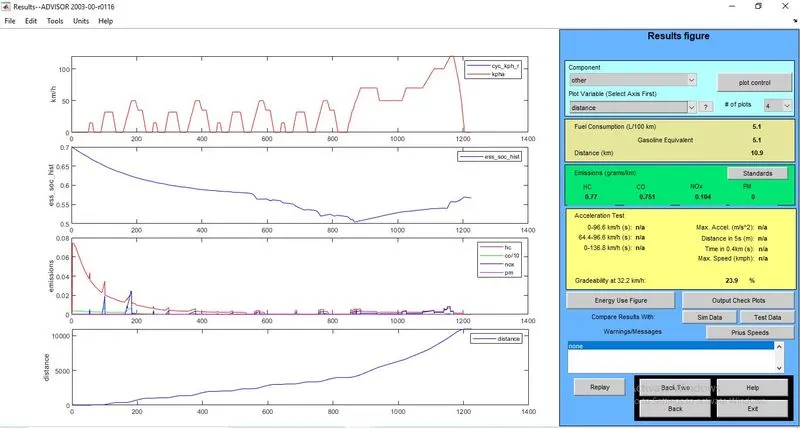
The gradability is 23.9% with a speed of 32.2 kmph for 60 seconds.
3. Vehicle at 30 mph for 60 seconds
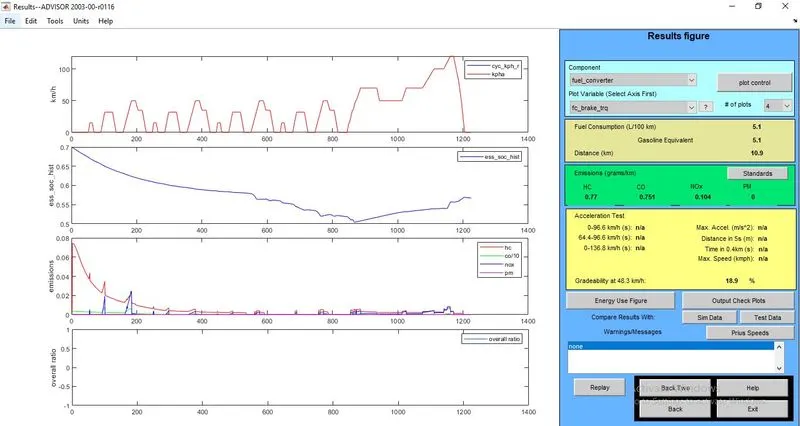
The gradability is 18.9% with a speed of 48.3 kmph for 60 seconds.
4. Vehicle at 40 mph for 60 seconds
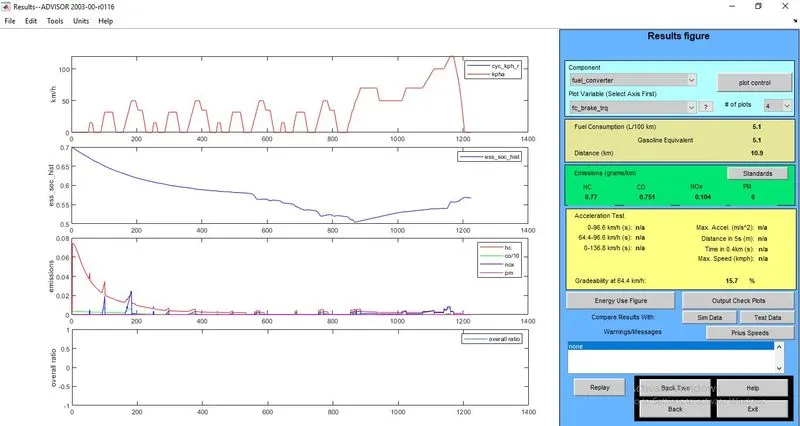
The gradability is 15.7% with a speed of 64.4 kmph for 60 seconds.
5. Vehicle at 50 mph for 60 seconds
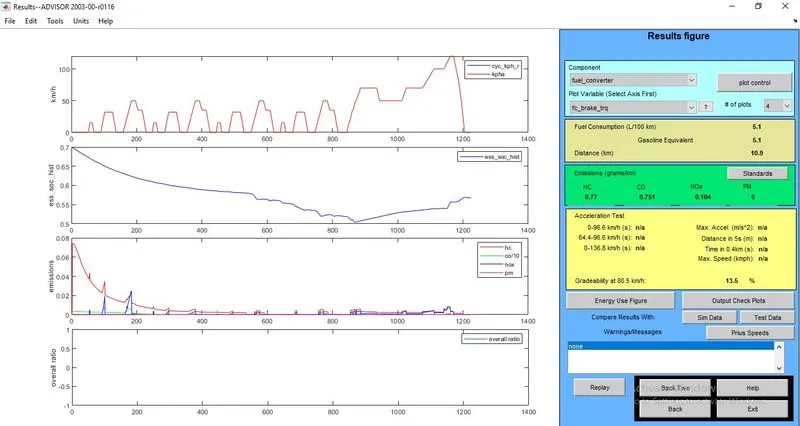
The gradability is 13.5 % with a speed of 80.5 kmph for 60 seconds.
6. Vehicle at 60 mph for 60 seconds
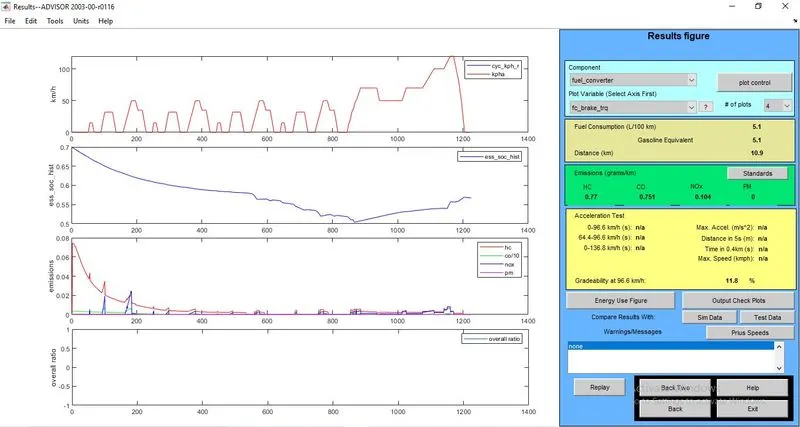
The gradability is 11.8 % with a speed of 96.6 kmph for 60 seconds.
CONCLUSION -
The gradability test fails when we go above the maximum speed achieved in the drive cycle. The results can be concluded as follows-
The gradeability of the vehicle decreases with an increase in speed.