Week-3 Challenge: ADVISOR Tool
- For EV_defaults_in file, if cargo mass is 500 kg with all other default conditions, can the vehicle travel for 45 km with FTP drive cycle? Conclude your observations.
AIM
- To understand ADVISOR tool and Simulate EV default vehicle with cargo mass 500kg during a 45km run with FTP cycle.
- Change the battery capacity and observe the results.
ADVISOR TOOL
Advanced Vehicle Simulator (ADVISOR) was first developed in November 1994 at the National Renewable Energy Laboratory. It was designed as an analysis tool to assist the US Department of Energy (DOE) in developing technologies for hybrid electric vehicles (HEV) through the Hybrid Electric Vehicle Propulsion System contracts with Ford, General Motors, and DaimlerChrysler. Its primary role is to highlight the system-level interactions of hybrid and electric vehicle components and their impacts on the vehicle performance and fuel economy.
ADVISOR uses three primary graphical user interface (GUI) screens to guide the user through the simulation process. With the GUIs, the user can iteratively evaluate the impacts of vehicle parameters and drive cycle requirements on the vehicle performance, fuel economy, and emissions. The GUIs facilitate interaction with the raw input and output data that is present in the MATLAB workspace. The vehicle model is depicted graphically using Simulink block diagrams to define the connections between components. The model then reads the input data from the MATLAB workspace during the simulation and outputs the results to the workspace to be viewed in the results window.
SIMULATION OF EV DEFAULT VEHICLE
The first part of GUI tool appears as shown in figure 1. We can select vehicle type and change the cargo mass in this window.
Select load file - > EV_defaults_in
Cargo mass -> 500
Press Continue to redirect to the next GUI. It will appear as figure 2.
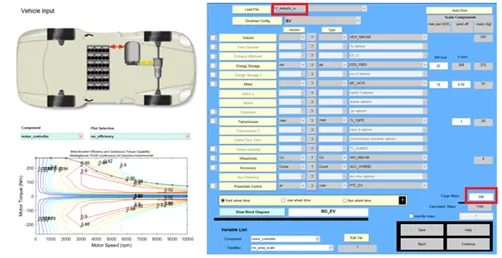
Figure 1: GUI to select vehicle file
In the next GUI, we can select the drive cycle. Scroll down the Drive Cycle bar and select CYC_FTP. The Drive cycle information will be appeared in the left side of the GUI. Since we have to select 45km run increase the number of cycle.
One cycle = 17.77km
No.of cycles for 45km = 45/17.77 = 2.82 cycles
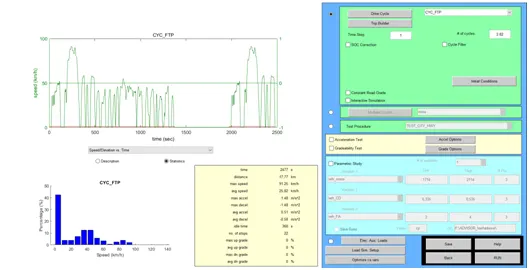
Figure 2: GUI to select drive cycle
Press ‘RUN’ to run the simulation. The results will be appeared as shown in figure 3.
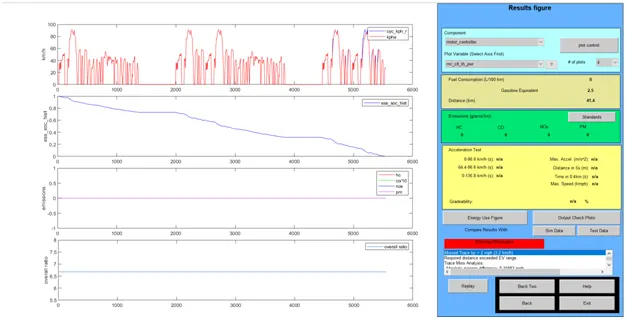
Figure 3: Simulation Results
From the above results, we observe that battery SOC has reaches 0 level at a distance of 41.4km. So the vehicle could not complete the desired drive cycle.
In order to complete the drive cycle, vehicle needs more energy from the battery. So we are increasing battery modules. Battery modules was 25 numbers in previous simulation.
In figure 4, we are changing battery modules to 28. So Nominal voltage, V nom= 345V and Battery mass = 308kg.
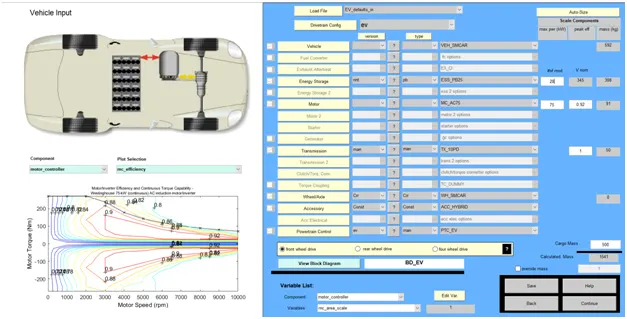
Figure 4: Changing Battery modules to 28
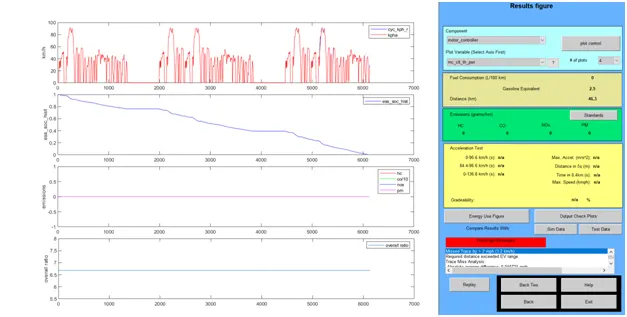
Figure 5: Simulation results with 28 modules
The above results shows that the distance covered by the vehicle was 46.3km and it reached SOC zero at the end of the trip. Here, our criteria of covering 45km have met. But it is not good to drain the battery till zero SOC for the battery life and performance. So we are again increasing the battery modules to maintain a minimum SOC even after covering 45km.
In figure 6, we have increased the battery modules to 30. So Nominal voltage, Vnom = 370V and Battery mass = 330kg.
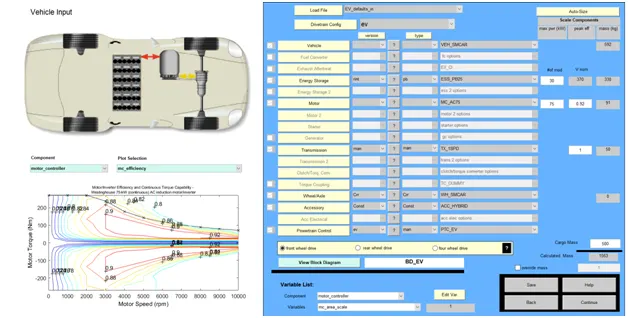
Figure 6: Changing Battery modules to 30
The simulation results with 30modules of batteries is as shown below. The distance covered is 47.8km and even after completing the trip, the battery has a SOC of 2%. But this is not enough for proper health of battery. So we are again increasing the battery modules to 35 which is shown in figure 8.
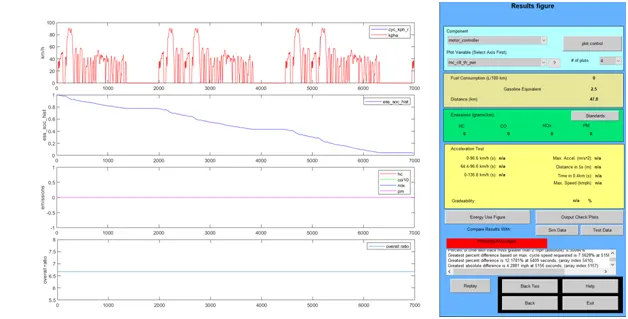
Figure 7: Simulation results with 30 modules
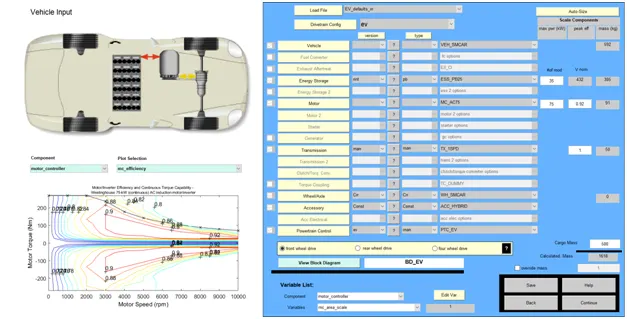
Figure 8: Changing Battery modules to 35
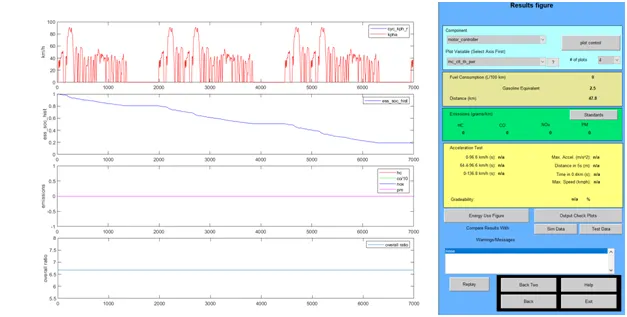
Figure 9: Simulation results with 35 modules
The simulation results with 35 modules of batteries are as shown in figure 9. The distance covered is 47.8km and even after completing the trip, the battery has a SOC of 20%. This will be enough for maintaining proper health of battery.
Conclusion
The Battery modules required just to cover 45km distance is 28. But for longer battery life and proper battery health, a minimum SOC of 20% has to be maintained. By considering the above, we need 35modules of battery to cover this drive cycle.
The table below shows a comparison of battery modules and distance covered.
|
Battery modules |
Distance covered |
SOC |
|
25 |
41.4 |
0 |
|
28 |
46.3 |
0 |
|
30 |
47.8 |
2% |
|
35 |
47.8 |
20% |
3. Perform gradeability test with PRIUS_Jpn_defaults_in file. Compare your results in table and conclude.
AIM
To perform gradeability test of TOYOTA Prius in ADVISOR tool for different speeds and compare the result.
TOYOTA PRIUS
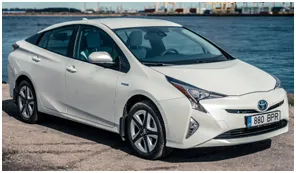
Figure 10: Toyota Prius
Toyota Prius is the first commercialized hybrid electric vehicle (HEV) in the world, while ADVISOR is one of the most widely used computer simulation tools for HEVs. So for better understanding of HEV strategy, the model of Toyota Prius was included in ADVISOR.
ADVISOR SIMULATION OF GRADEABILITY
In ADVISOR tool, select -> Prius_JPN_defaults_in. Then all the parameters of the vehicle will be loaded.
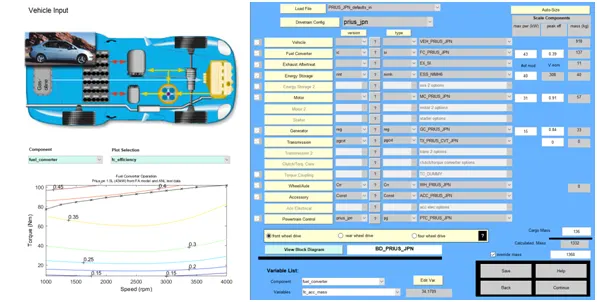
Figure 11: TOYOTA PRIUS model parameters in ADVISOR GUI
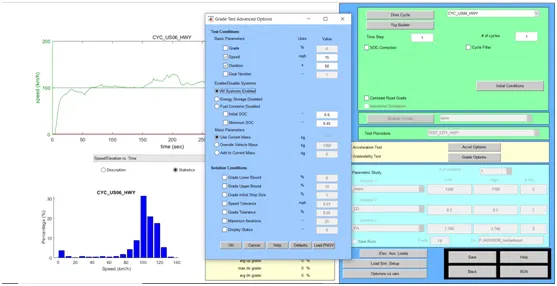
Figure 12: Grade test parameters and Drive cycle for 15mph
Check the Gradeability test box and click Grade Options. Set speed (mph) as 15 ,duration 60s and enable all systems.
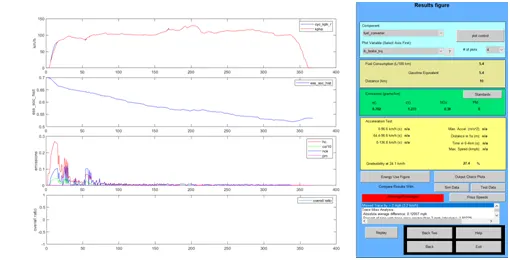
Figure 13: Gradeability test results for 15mph
We can see that the gradeability is 27.4% at 24.1kmph for 60s duration of US06_HWY drive cycle.
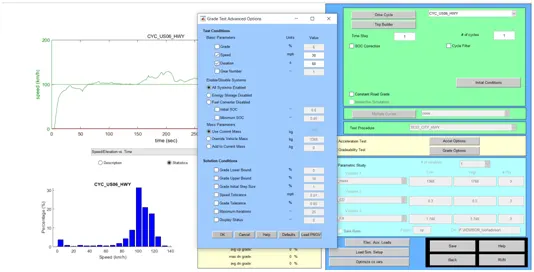
Figure 14: Grade test parameters and Drive cycle for 30mph
Check the Gradeability test box and click Grade Options. Set speed (mph) as 30 ,duration 60s and enable all systems.
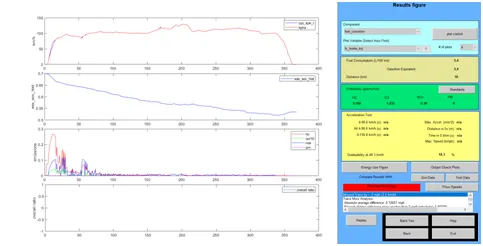
Figure 15: Gradeability test results for 30mph
We can see that the gradeability is 18.3% at 48.3kmph for 60s duration of US06_HWY drive cycle.
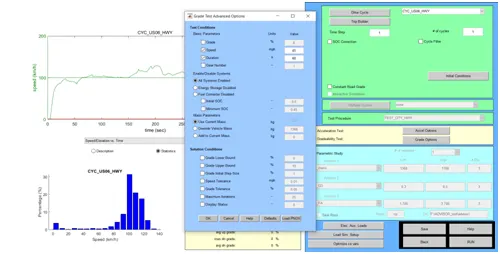
Figure 16: Grade test parameters and Drive cycle for 45mph
Check the Gradeability test box and click Grade Options. Set speed (mph) as 45 ,duration 60s and enable all systems.
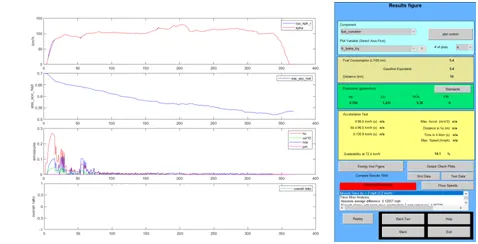
Figure 17: Gradeability test results for 45mph
We can see that the gradeability is 14.1% at 72.4kmph for 60s duration of US06_HWY drive cycle.
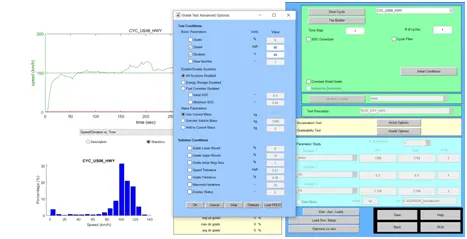
Figure 18: Grade test parameters and Drive cycle for 80mph
Check the Gradeability test box and click Grade Options. Set speed (mph) as 80 ,duration 60s and enable all systems.
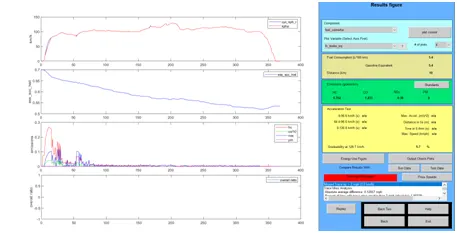
Figure 19: Gradeability test results for 80mph
We can see that the gradeability is 6.7% at 128.7kmph for 60s duration of US06_HWY drive cycle.
Conclusion
From the above results, we can compare the speed and gradeability in the following table.
For US06_HWY Drive cycle of 1cycle, Grade test duration of 60sec,
|
Speed of vehicle (mph) |
Speed of vehicle (kmph) |
Gradeability |
|
15 |
24.1 |
27.4 |
|
30 |
48.3 |
18.3 |
|
45 |
72.4 |
14.1 |
|
80 |
128.7 |
6.7 |
We can understand that as the speed of vehicle increases, gradeability decreases.