Week 2 - Flow over a Cylinder.
Aim:
To simulate the flow over a cylinder and explain the phenomenon of Karman vortex street.
PART 1.
- Simulate the flow with the steady and unsteady case and calculate the Strouhal Number for Re = 100.
PART 2.
- Calculate the coefficient of drag and lift over a cylinder by setting the Reynolds number to 10, 100, 1000, 10000, and 100000. (Run with steady solver)
- Discuss the effect of Reynolds number on the coefficient of drag.
INTRODUCTION:
Flow over circular cylinders has been one of the canonical research topics over the years for fluid dynamists and engineers, not only because of its geometrical simplicity but also for its practical importance. Despite extensive experimental and numerical studies almost over a century, flow around a circular cylinder remains a challenging problem in fluid mechanics, where intensive investigations are continued even today to understand the complex unsteady dynamics of the cylinder wake flow. Cross-flow normal to the axis of a stationary circular cylinder and the associated problems of heat and mass transport are encountered in a wide variety of engineering applications. Both experimental measurements and numerical computations have confirmed the onset of instability of the wake flow behind a cylinder beyond a critical Reynolds number, leading finally to a kind of periodic flow identified by definite frequencies, well known in the literature as the Von Karman vortex street. In laminar flow past cylinders with regular polygonal cross-section, the flow usually separates at one or more sharp corners of the cross-section geometry itself, forming a system of vortices in the wake on either side of the mid symmetry plane. On the other hand, for a circular cylinder, where the point of flow separation is decided by the nature of the upstream boundary layer, the physics of the flow is much more complex than what its relatively simple shape might suggest.
Karman vortex street:
Vortex is the flow that is in the circular motion rotating about a center point. It is the most spectacular and fascinating pattern created by shear flow. It is a rotary flow about an axis. It has low pressure in the center.
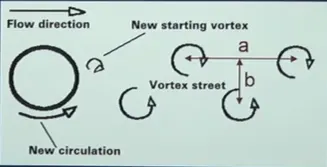
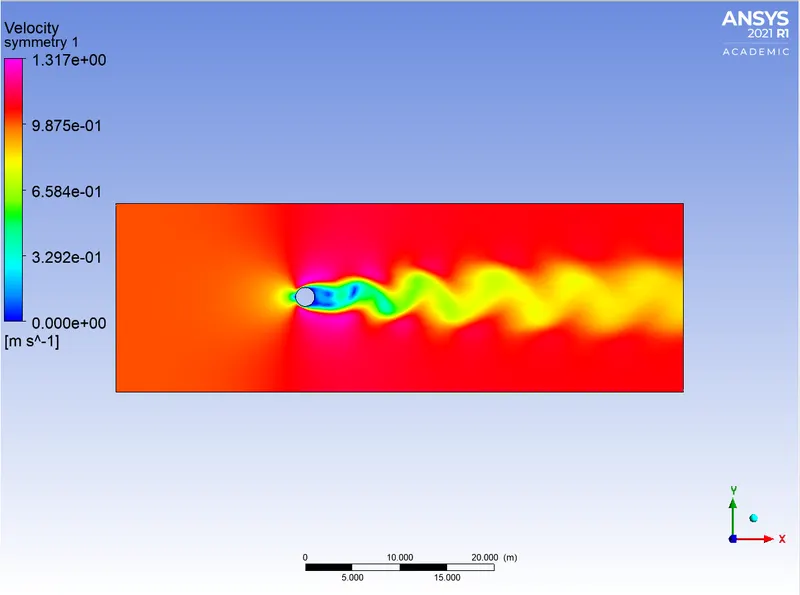
The above-mentioned model is known as the Karman vortex street, proposed by Von Karman. He had this model the solution of which was basically stable only when these vortices are staggered. They are not simultaneously forming and shedding. There is a first from one side, then from the opposite side, and then this cycle will repeat. So it is periodic in nature. The distance between centers of two vortices in the same row is called a and the distance between centers of vortices of opposite rows are denoted by b. Mathematically he got a spacing ratio b/a = 0.281. when this is the spacing ratio and there is a staggered arrangement then the vortex street was stable. Meaning the solution is stable only in this particular fashion.
This was further explained in the formation of the Vortex. the model is shown below.
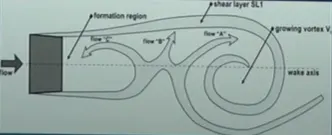
The flow is approaching the bluff body and the shear layer which is nothing but a boundary layer that is separated from the body. As we can see the shear layer is separated from both sides up and down. As both the shear layer separate, since they have the vorticity they will have the tendency to curl up into the form of a vortex. In the normal condition when there is a steady flow approaching the body will generate the flow pattern where one of the shear layers take lead, it forms the vortex earlier than the other one there is no preference here that top one or bottom one, any one of them can take lead. In our case as in the above model here, the upper one is forming a vortex.
Vortex has a strength which we call the circulation that is nothing but vorticity over the area covered by the vortex. So vorticity is continuously generated in the boundary layer and fed into the vortex through the separated shear layer. Once this vortex starts forming, as the vortex has lower pressure in its core so pressure starts falling. The moment pressure reduces it acts as a sink, It will suck flow from all around. So opposite side shear layer gets sucked in because of the suction created and it creates branches of the opposite side shear layer in three directions flow "A", flow "B" and flow "C".
Since vorticity is of the opposite nature there is some sort of cancellation effect. due to the cancellation, this gets to cut the vortex and becomes free once it is free, it will flow with the main flow but it flows with a velocity lower compare to the free streamflow. So depending on what is the velocity of the vortex, if it is high then the drag of the body will be low if the velocity of the vortex is low then the drag experienced by the body will be high.
In this project, we will be simulating flow over the cylinder and we will see the effect of the Reynolds number on the coefficient of drag.
So the interaction between the separated shear layers having opposite signs is essential for the vortex to get become free and shed. That is the reason simultaneous vortex shedding can not happen. If vortices forming simultaneously who will cut whom. So this the reason, we need interaction between two oppositely signed shear layers to interact with each other for the vortex formation and its shedding.
If the vortex is free and there is a flow, the combination of the vortex and uniform flow in one particular direction will produce lift. As in the first model which is shown above, the upper side vortex is rotating clockwise, the upper side has velocity in the same direction as the main flow, the lower side has the velocity is in the opposite direction. Then the lower velocity will be on the lower side and the higher velocity will be on the upper side so higher velocity must have lower pressure and lower velocity must have higher pressure so force lifts upward. Then in reaction, there is a force acting in opposite direction on the body so in the reaction of lift force body will move downward. in the reaction of the downward force, the body will move upward. So flow in left to the right body is moving up and down. This is how oscillations are produced.
Effects of Vortex Shedding
As we have seen, the vortices are inducing the vibration or structural vibration. Each vortex has lower pressure in its core so when it forms behind the body, the induced pressure field at the rear part of the body will create additional drag because the pressure at the back is less than the pressure in the front. The front has stagnation point highest possible pressure. So there is a drag form by the vortex.
As the alternate shedding of Vortex is taking place, because of its low pressure it creates an oscillation in pressure and generates noise. The frequency at which the vortex shedding is occurring there will be the frequency of the noise.
Vortex shedding frequency
Strouhal Number, `St = (f.D)/U`
f = is the frequency of vortex shedding
d = dimension of the body
U = freestream velocity
Each bluff body shape has a particular St value depending on the characteristic of the flow separation. Wider wake results in lower vortex shedding frequency. For example, if the diameter of a circular cylinder is increased keeping the velocity constant, the vortex shedding frequency will decrease. Similarly, an increase in the velocity will increase the vortex shedding frequency and vice versa.
SOLUTION:
PART 1:
(a) Flow simulation with the steady case for Re = 100
We know that,
`Re = (rhoVD)/mu`
`mu`= Fluid dynamic viscosity in kg/(m.s)
`rho`= Fluid density in `(kg)/m^3`
`V`= Fluid velocity in m/s
`D` = Pipe diameter in m
Here we are giving values for `mu` = 0.02 kg/m.s and `rho`= 1 `(kg)/m^3`
Therefore, for given Re = 100, Fluid Velocity will be 1 m/s
PROCESS:
Geometry:
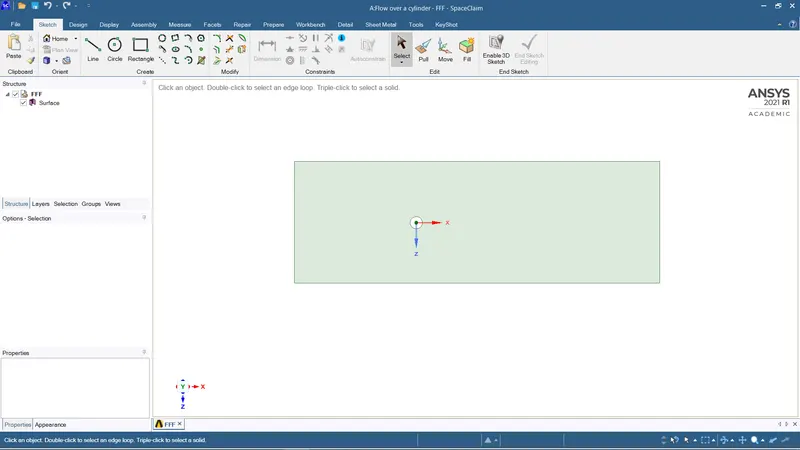
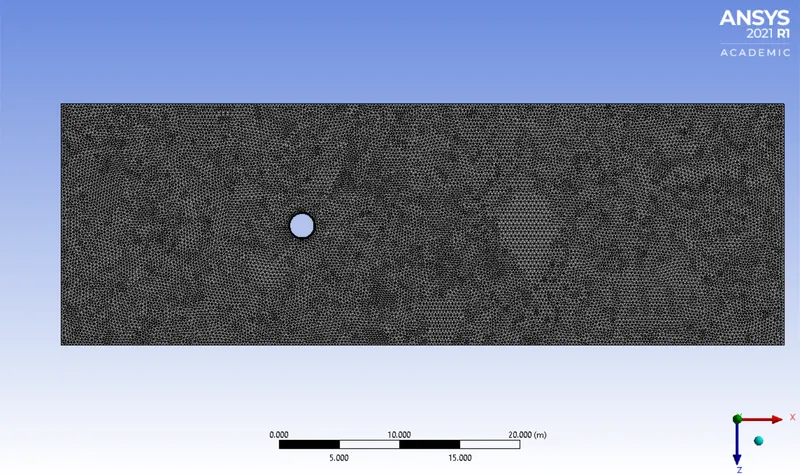
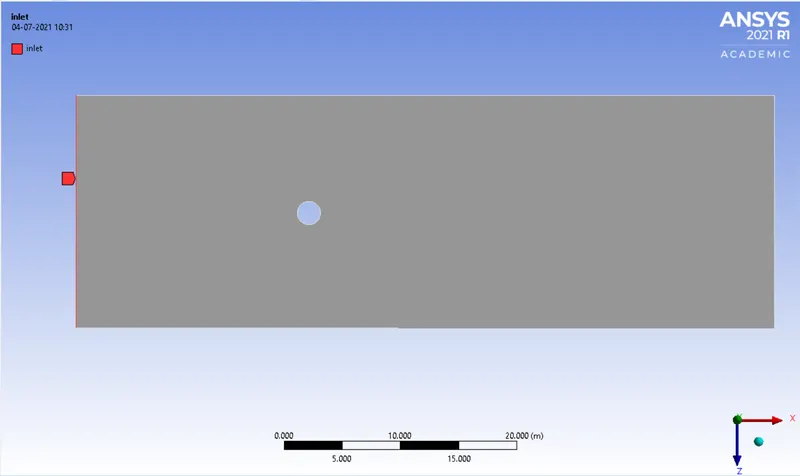
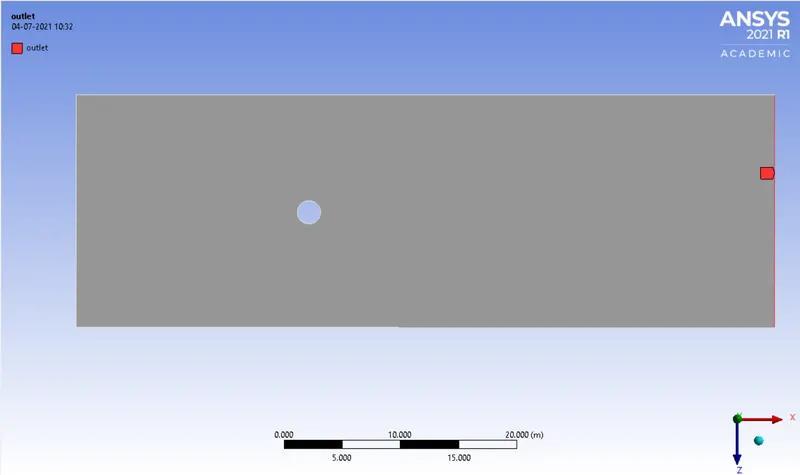
2D geometry is used as the surface in which the whole body is considered as the fluid region. The circle is considered as the cylinder wall. Cylinder of 2m diameter which is immersed in the fluid domain of 20 x 60 m dimension. The inlet of the domain is 20m left from the center of the cylinder and the outlet is 40m right from the center of the cylinder. After providing the details the geometry will be
Meshing:
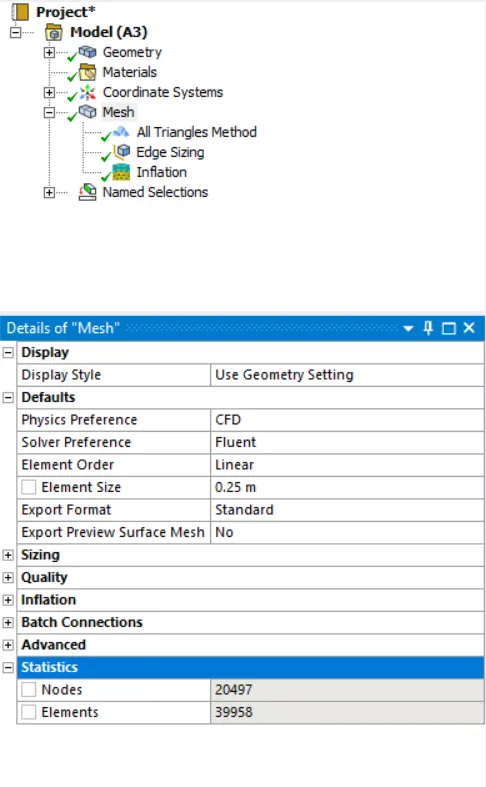
The triangular method is used for the meshing. 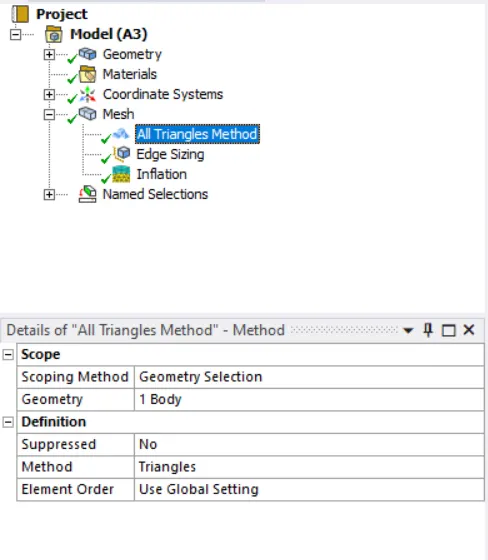
Edge sizing is used around the circle with 36 divisions.
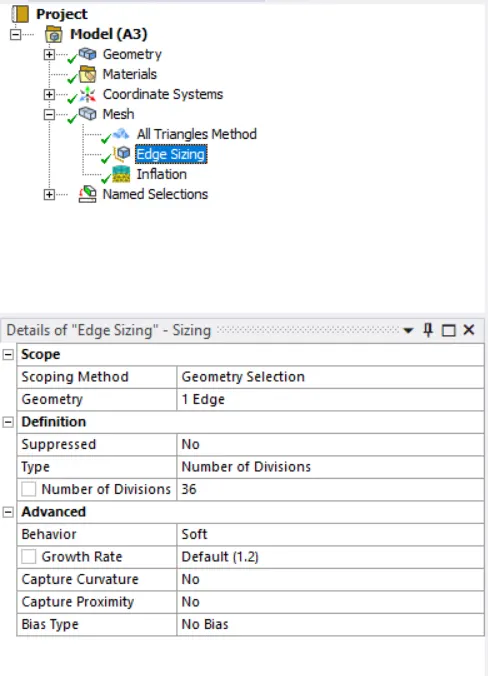
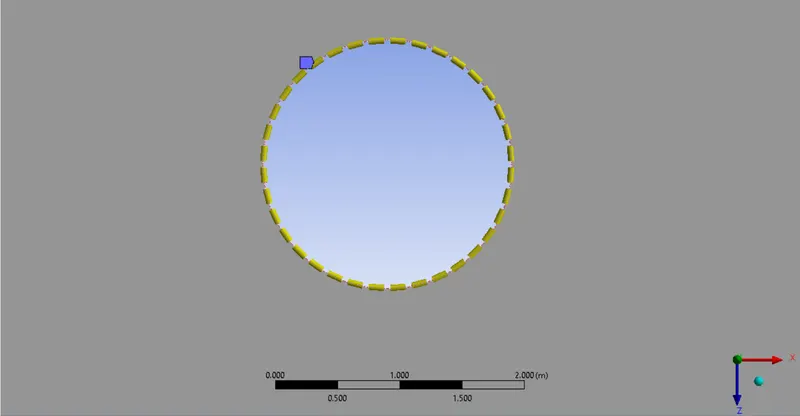
Inflation is used around the circle with the first layer height 0.005m, with 10 maximum layers and the growth rate is 1.2.
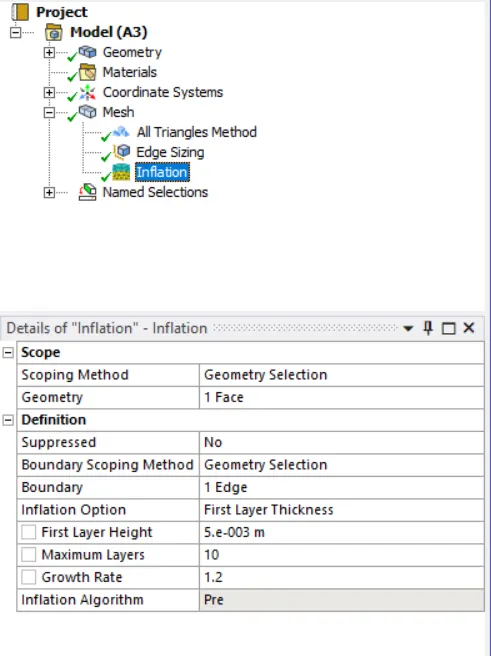
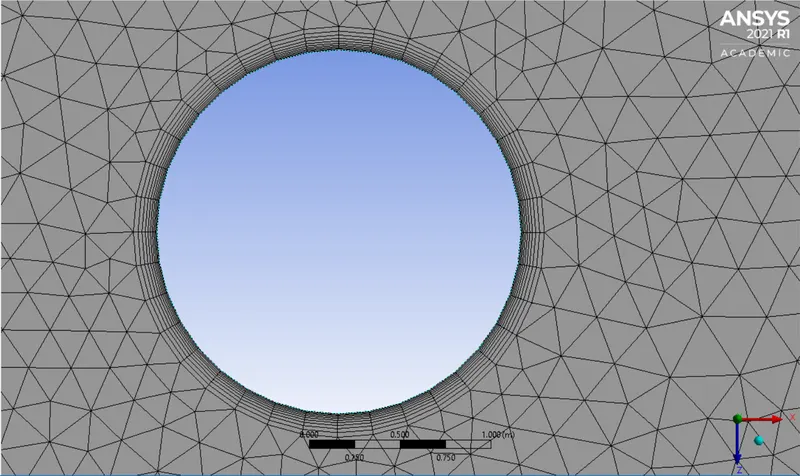
The element size of 0.25m is provided for mesh
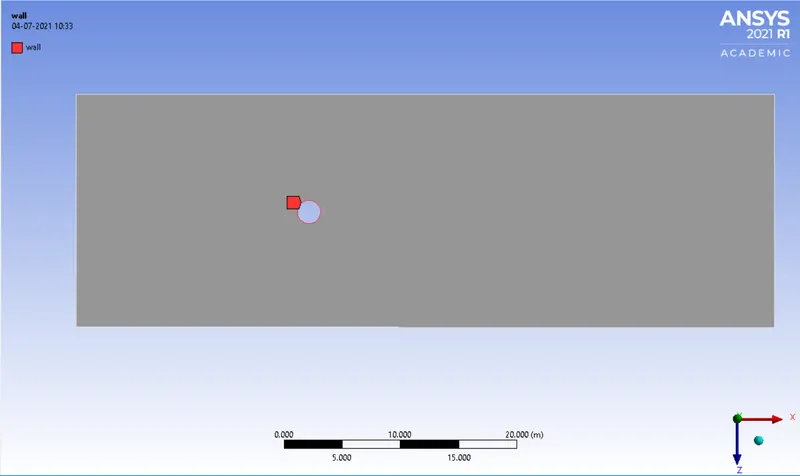
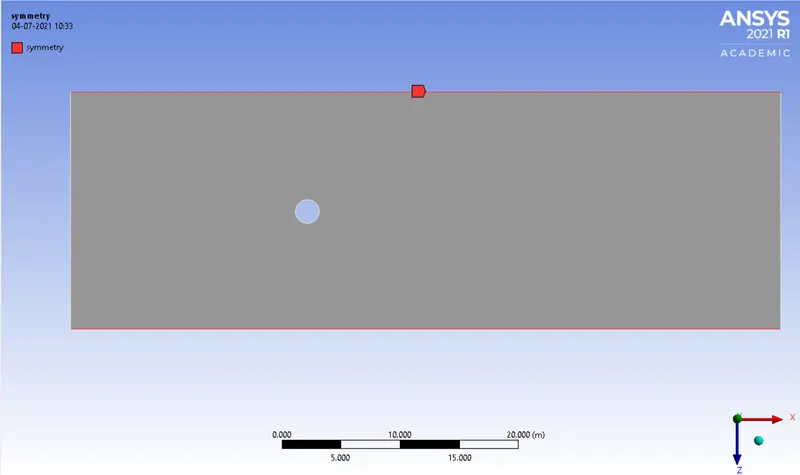
Named selection of the created geometry:
Setup:
Setting up physics
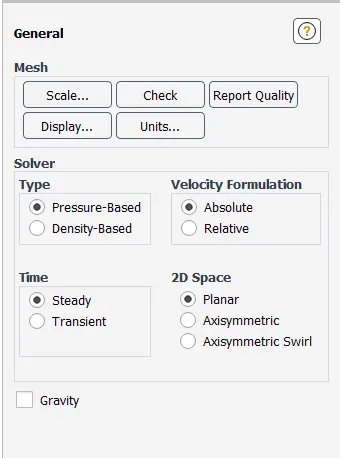
Steady State:
Solver -> Pressure-Based
Velocity Formulation -> Absolute
Time -> Steady
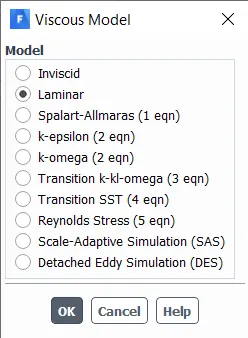
Viscous Model:
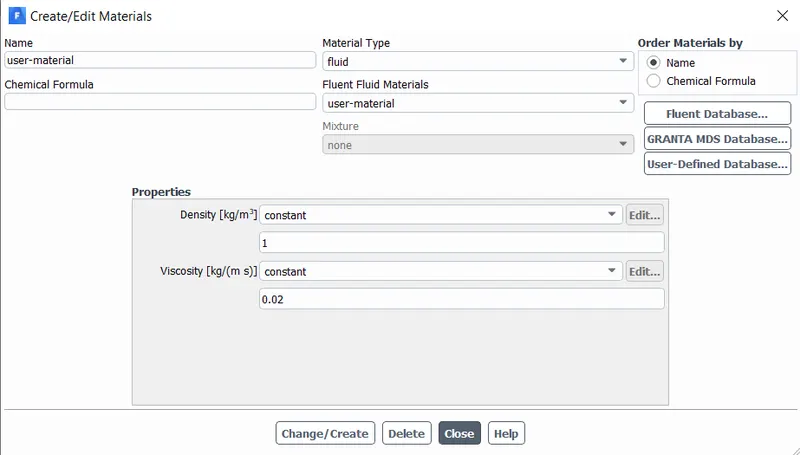
Material:
Fluent Fluid Materials -> user-material
where Density = 1 and Viscosity = 0.02
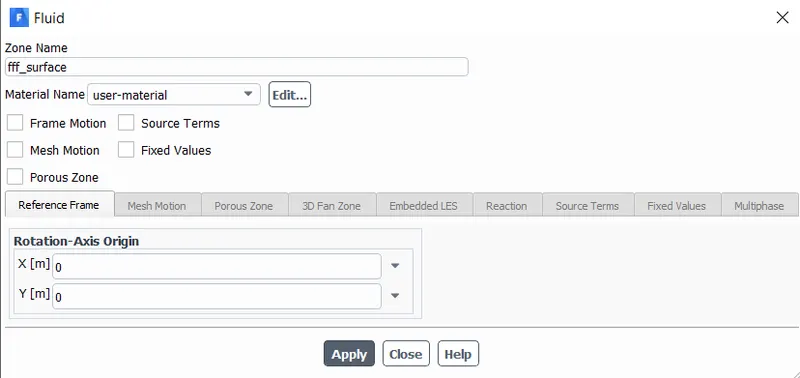
Cell Zone:
Material Name -> user-material
Boundaries:
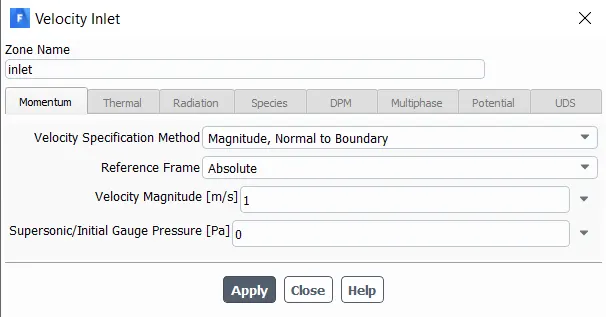
Velocity Inlet:
Velocity Magnitude -> 1 m/s
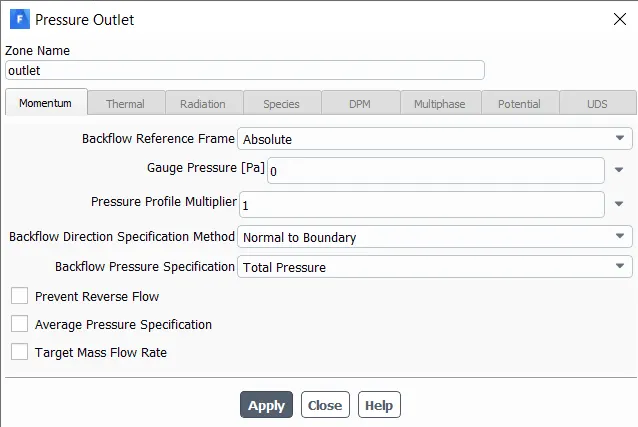
Pressure Outlet:
Gauge Pressure -> 0 pas
Wall:
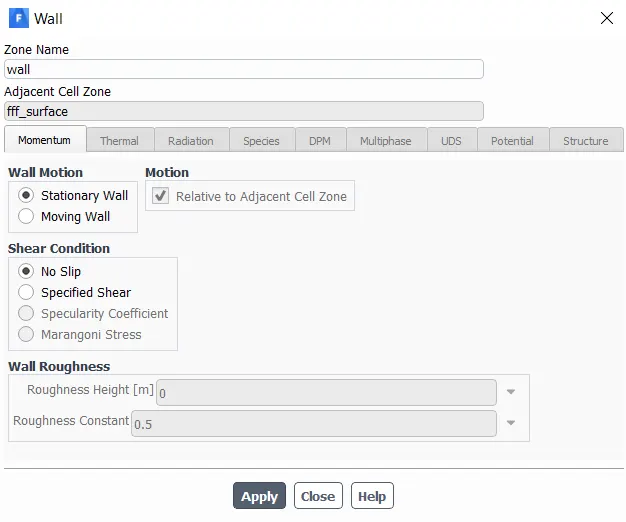
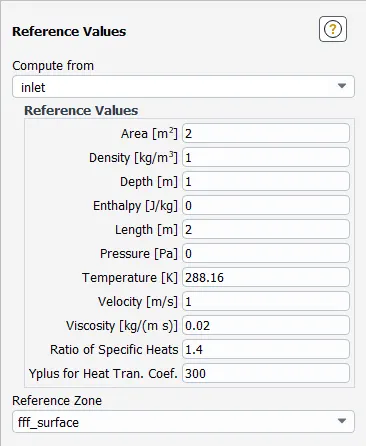
Reference Values:
In the case of 2D,
Depth is considered unity = 1m
So Projected Area = Diameter * Depth = Diameter
Length = Diameter
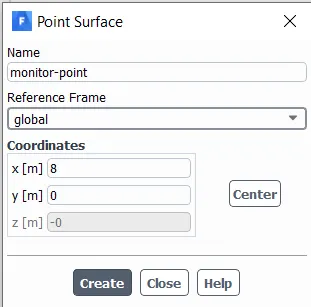
Monitor point:
Coordinate x [m] -> 8
Coordinate y [m] -> 0
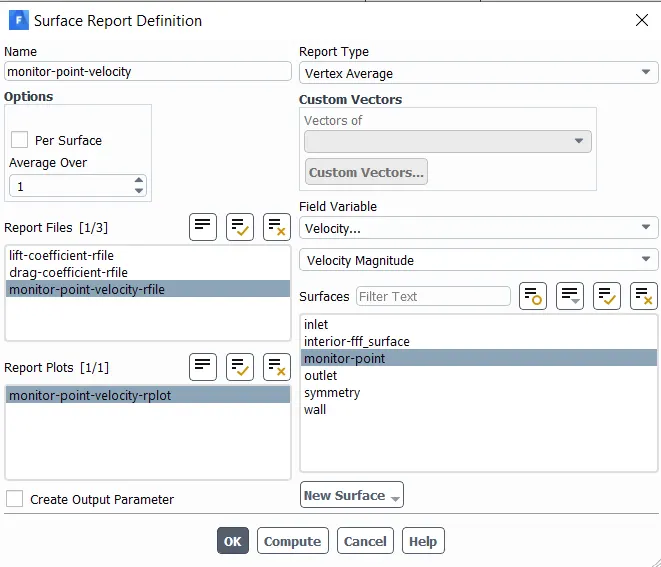
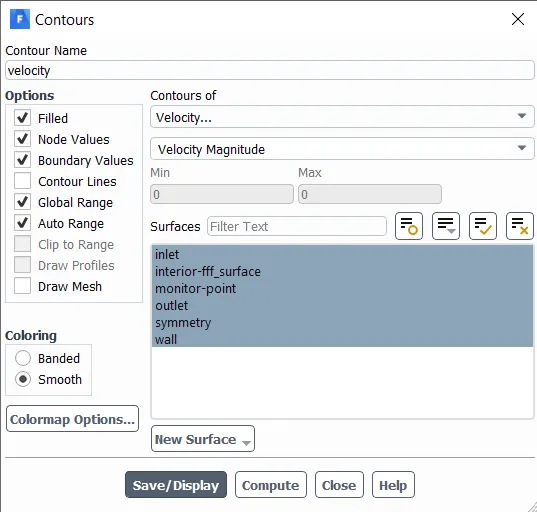
Velocity Countour:
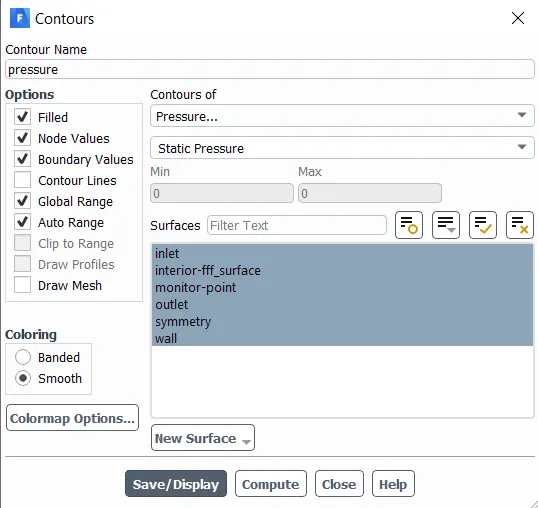
Pressure Contour:
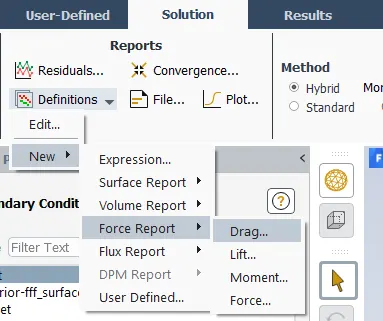
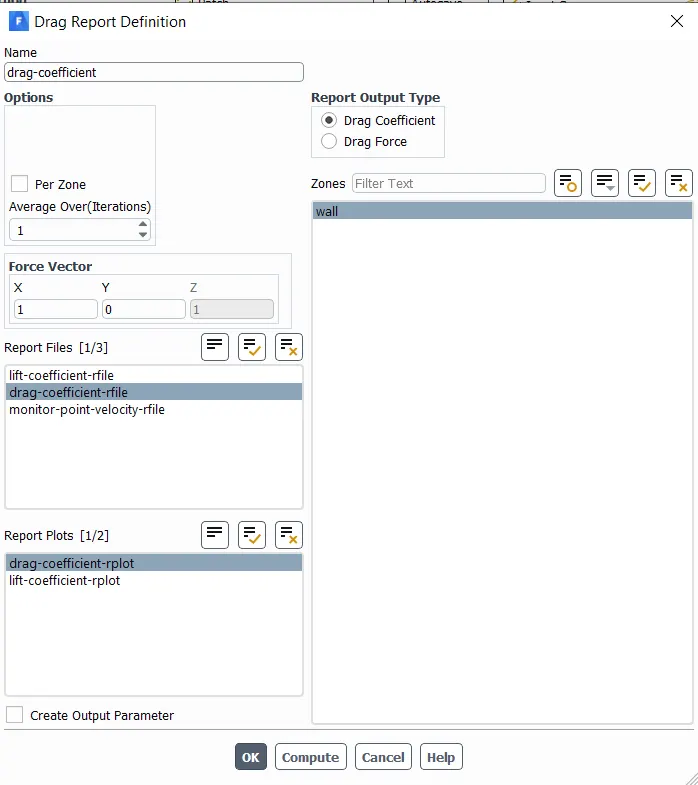
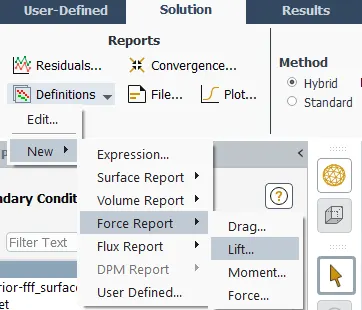
Drag Coefficient:
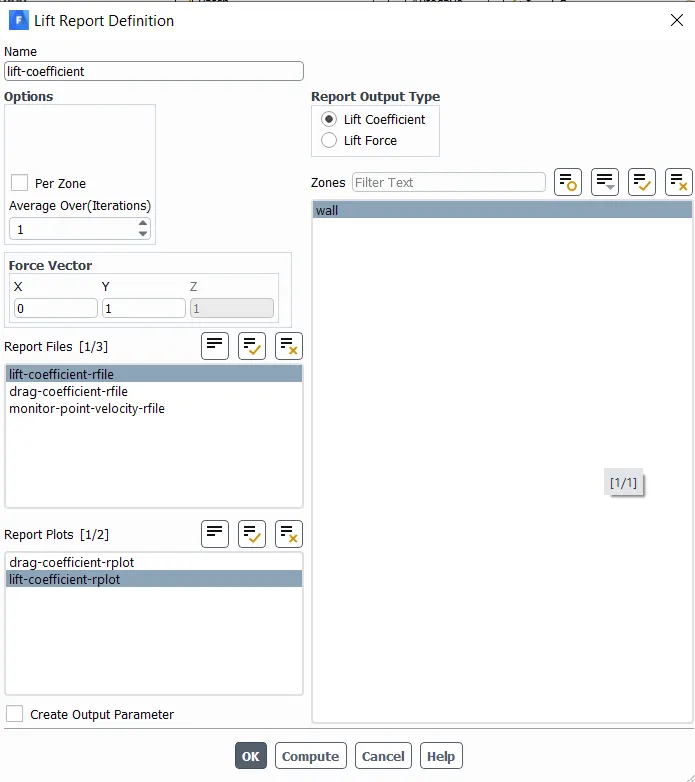
Lift coefficient:
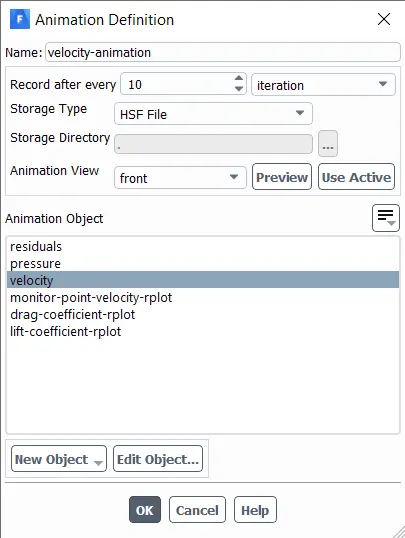
Velocity Animation:
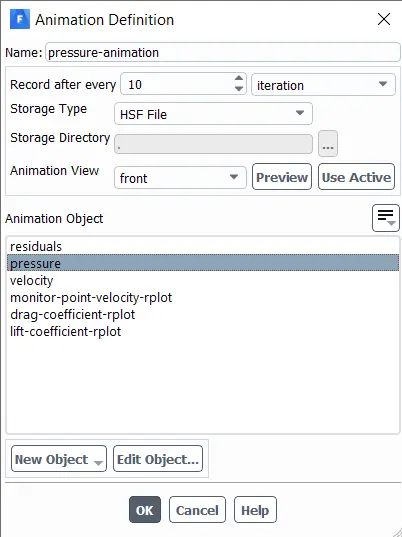
Pressure Animation:
Solution Initialization:
Method -> Hybrid
Results:
Residual Plot:
Vertex Average of Velocity Magnitude Plot:
Coefficient of Drag Plot:
Coefficient of Lift Plot:
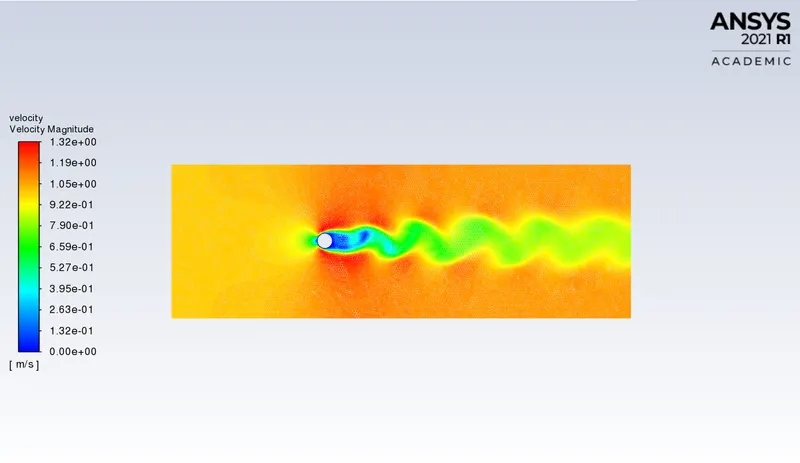
Velocity Contour Plot:
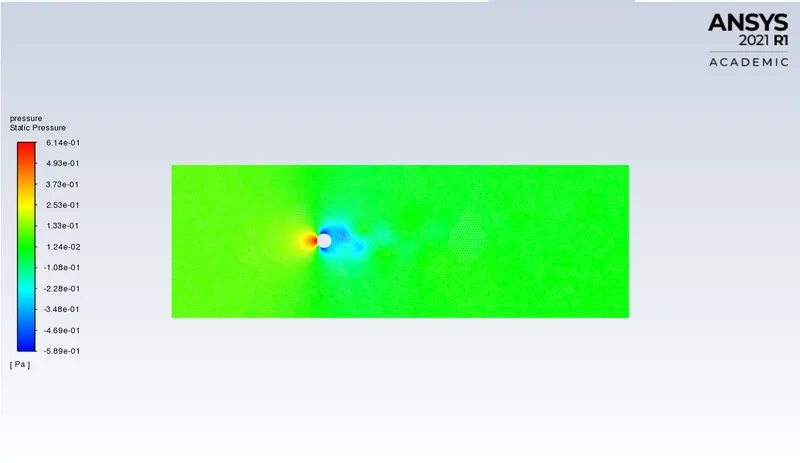
Pressure Contour Plot:
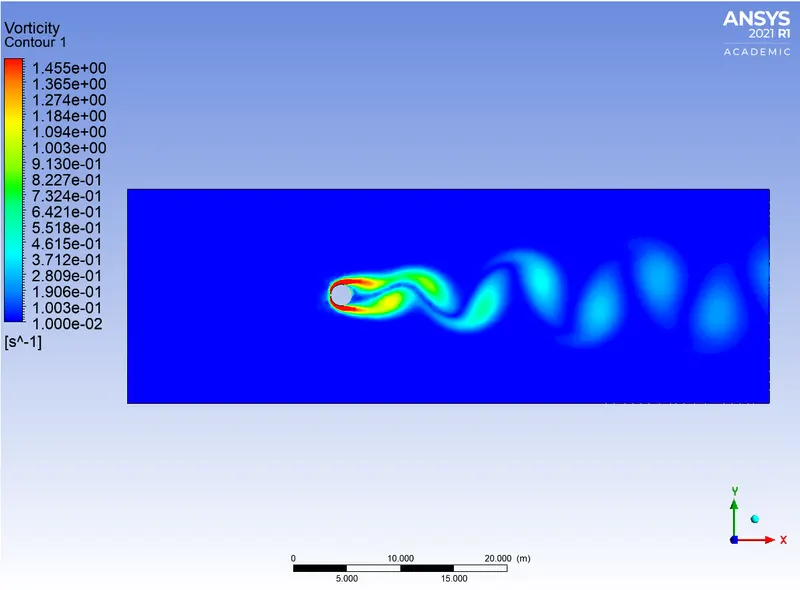
Contour Plot showing vortex shedding behind the cylinder:
(b) Flow simulation with the unsteady case for Re = 100
Setup:
Solver Type -> Pressure Based
Velocity Formulation -> Absolute
Time -> Unsteady
Viscous Model -> Laminar
Solution Initialization: >Standard Initialization
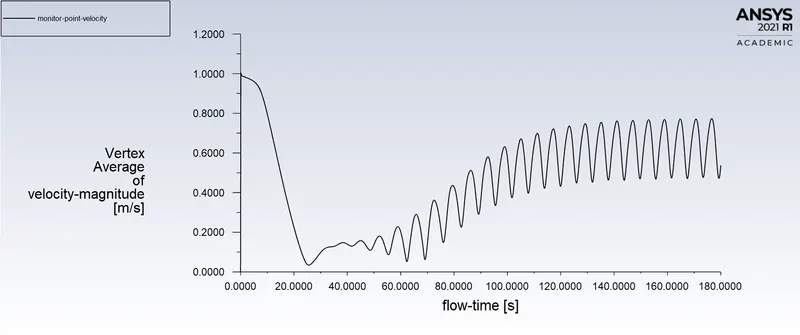
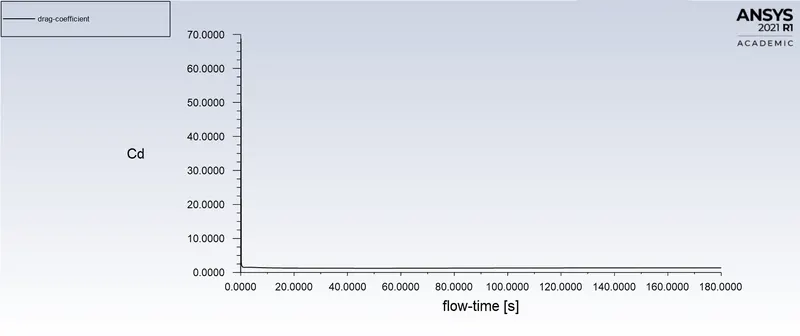
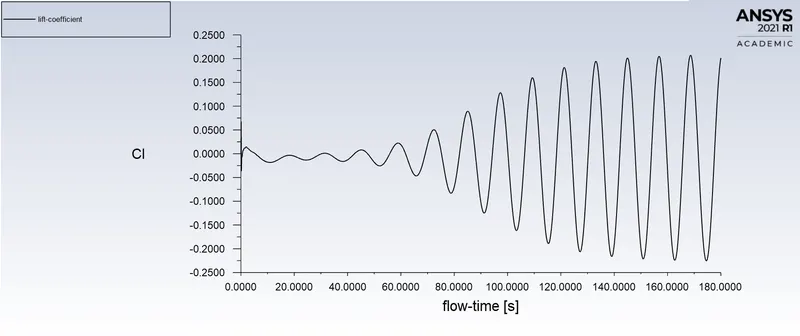
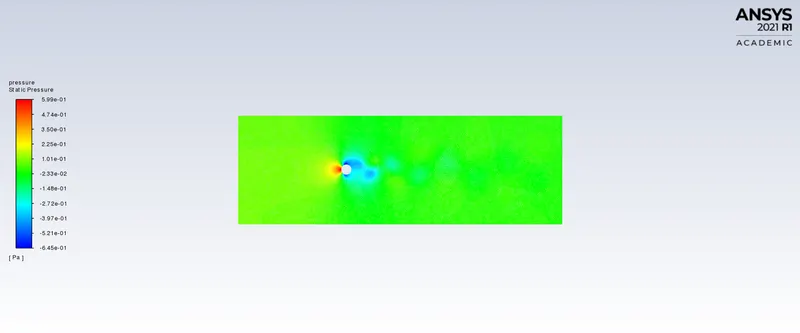
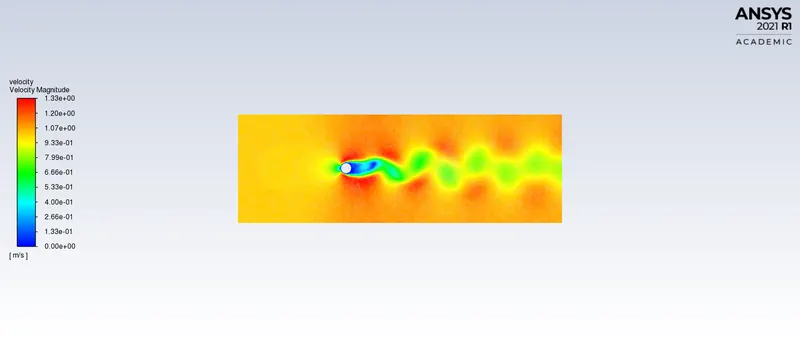
For an unsteady state with Re = 100 and inlet velocity = 1m/s the simulation is done at a time step size of 0.1 sec with 1800 number of time steps which gives us a simulation time of 180 sec.
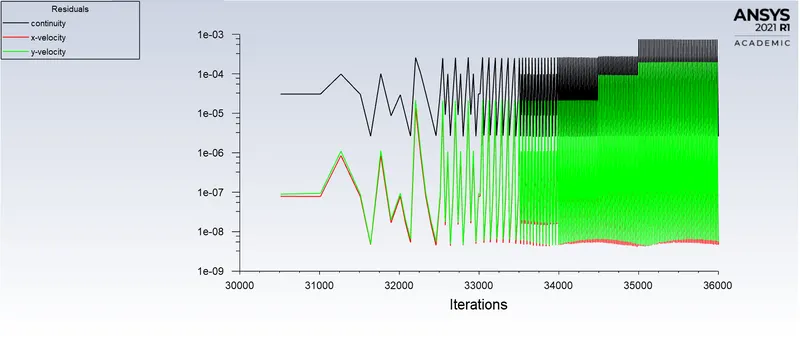
Residual Plot:
Vertex Average of Velocity Magnitude Plot:
Coefficient of Drag Plot:
Coefficient of Lift Plot:
Pressure Contour Plot:
Velocity Contour Plot:
Vorticity Contour Plot showing vortex shedding behind the cylinder:
Convergence Analysis:
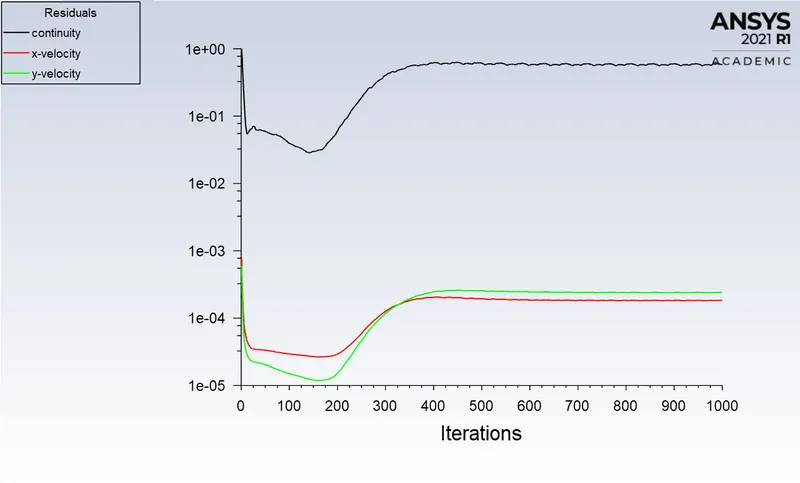
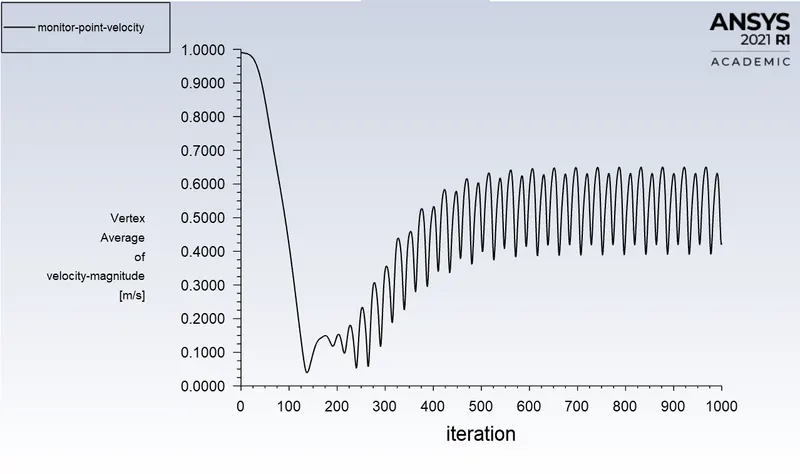
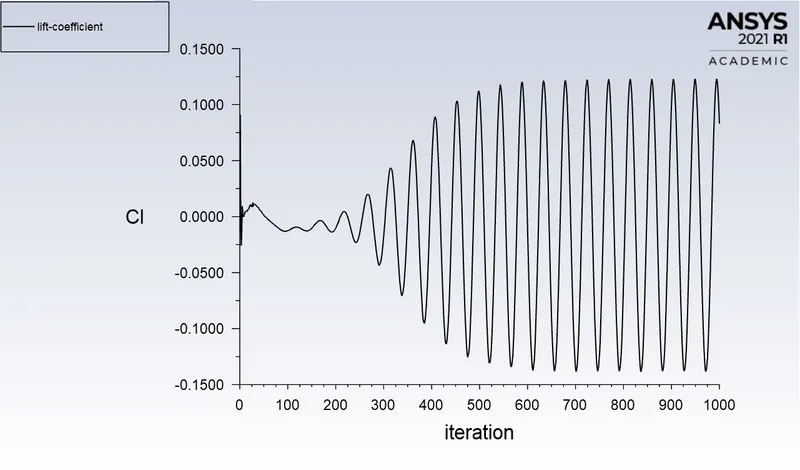
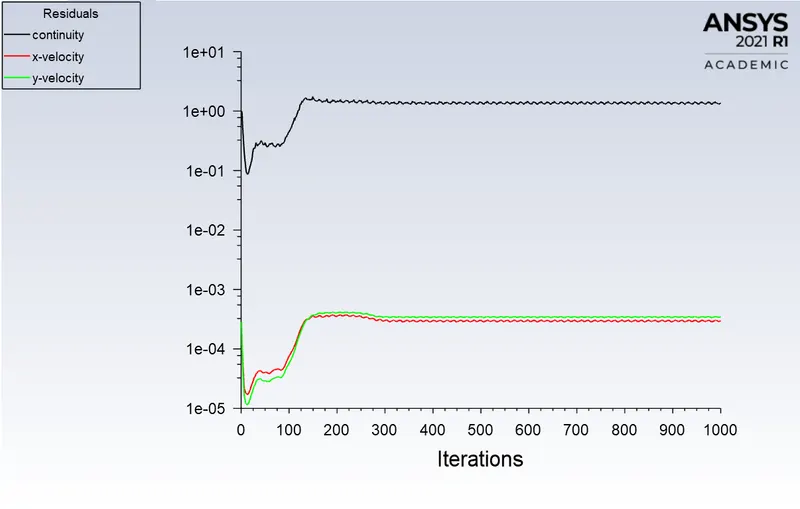
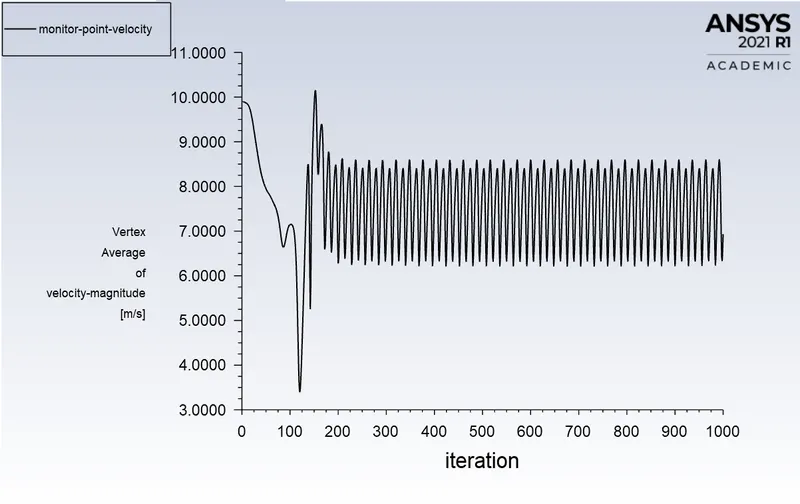
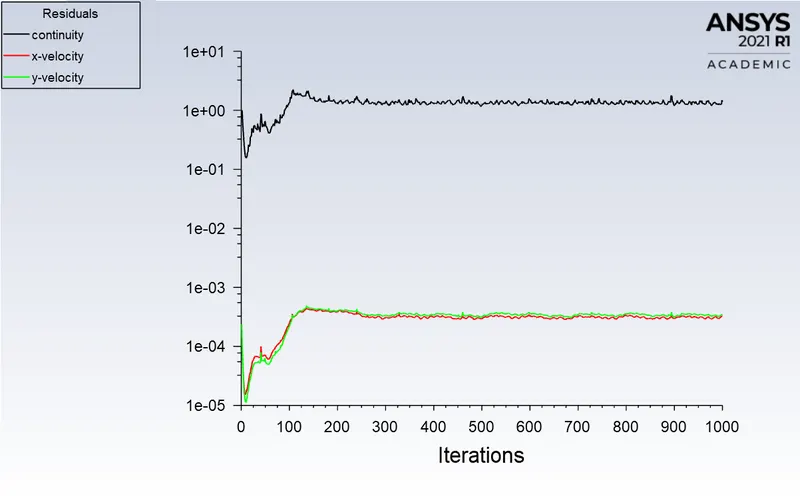
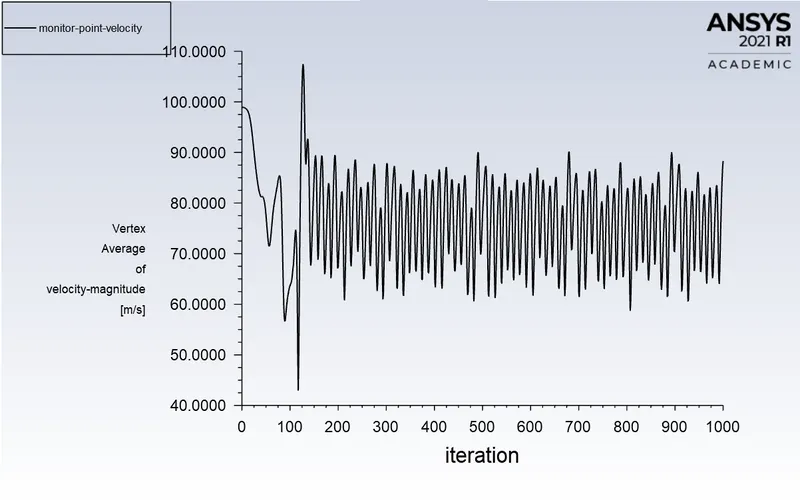
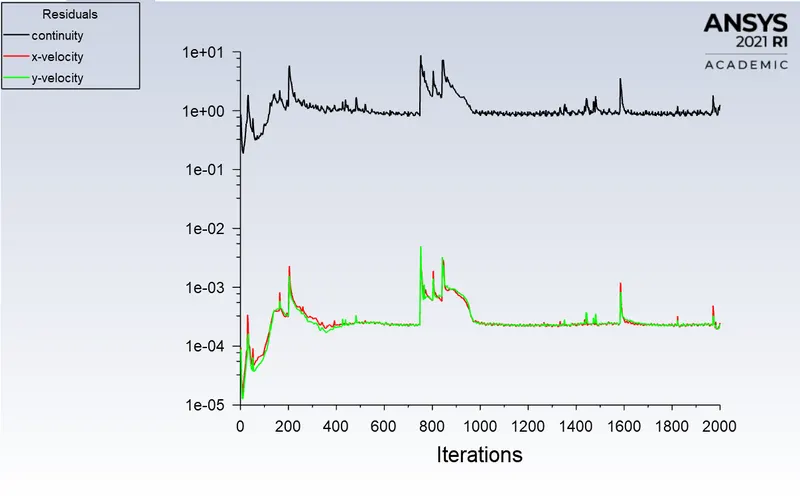
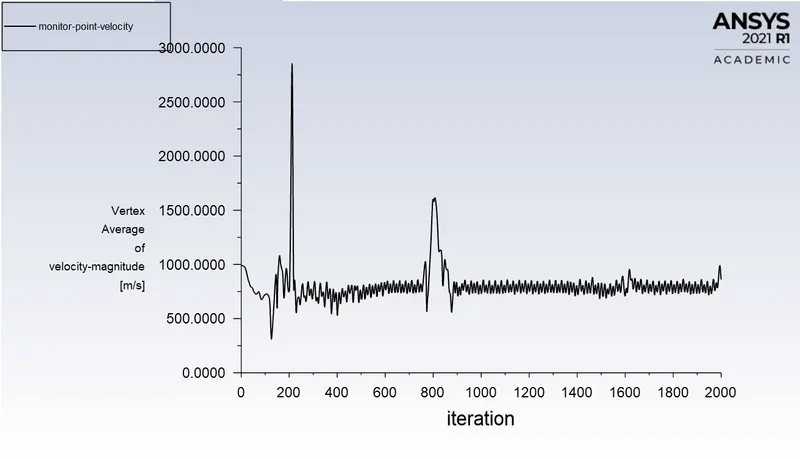
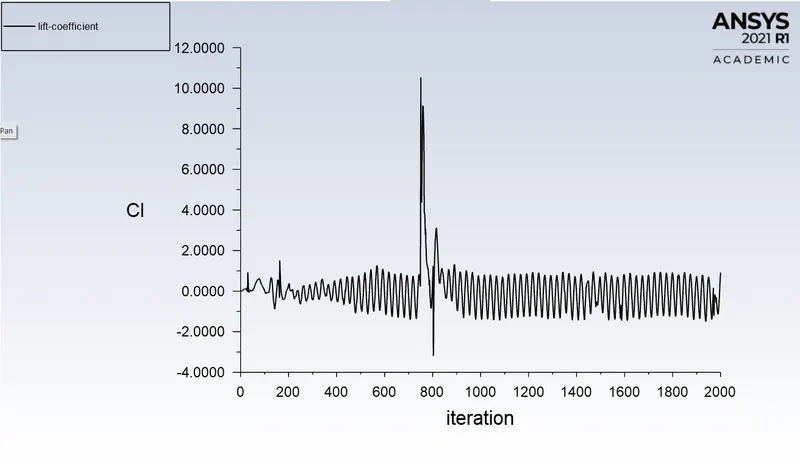
The convergence can be determined easily by monitoring the residual plot. However, due to the presence of periodic oscillations in the velocity and lift coefficient plot, the convergence is captured by monitoring the velocity and the lift coefficient plot. The stability of the amplitude of oscillation indicates the convergence of the solution.
Steady-state is performed to check the end result of the solution. But in transient or unsteady cases all the computed data take place with respect to time. A major difference can be seen in residual plots of both cases, the solution converges much faster in steady-state than in the transient case. In the transient case, we can see peaks appears growing very slowly with time, and after some iteration, it seems to be repeating its patterns. This repetition of residual after some iterations can also be considered that the solution has converged.
Computed Data from the above simulations:
| Case | Vertex Average of Velocity Magnitude (m/s) | Average Coefficient of Drag | Average Coefficient of Lift |
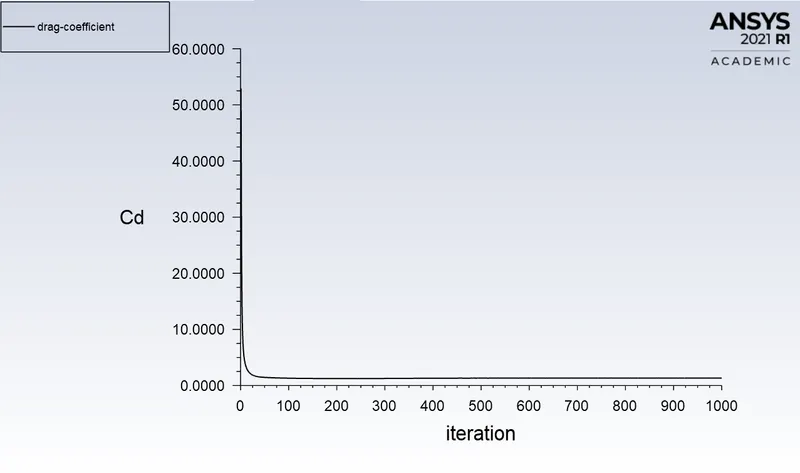
| Steady | 0.42452058 | 1.3319977 | 0.083112968 |
| Unsteady | 0.53760457 | 1.3499378 | 0.20147519 |
Calculation of The Strouhal Number:
As in the steady-state approach, the solution is not dependent on the time step, so we can not find the frequency of vortex for any particular period of time. So it is not possible to evaluate the Strouhal Number.
Strouhal Number calculation is only possible in the case of transient simulation as the frequency changes with respect to time.
Strouhal Number for Transient or Unsteady State:
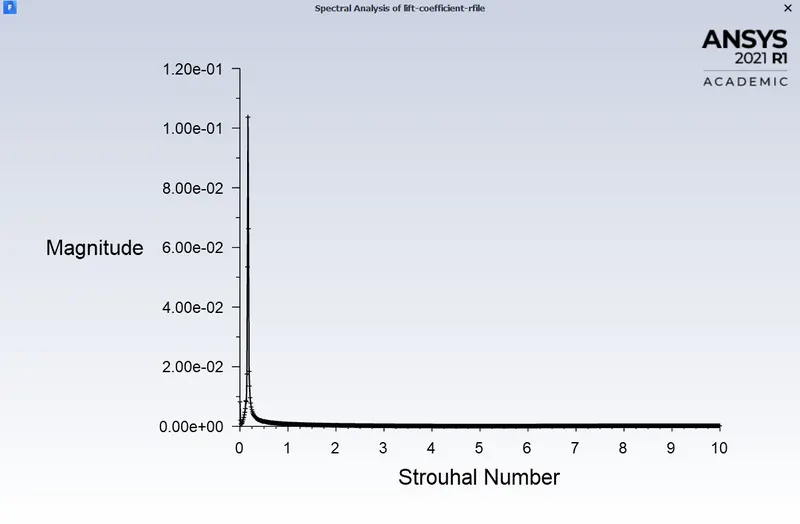
FFT data extracted from FLUENT:
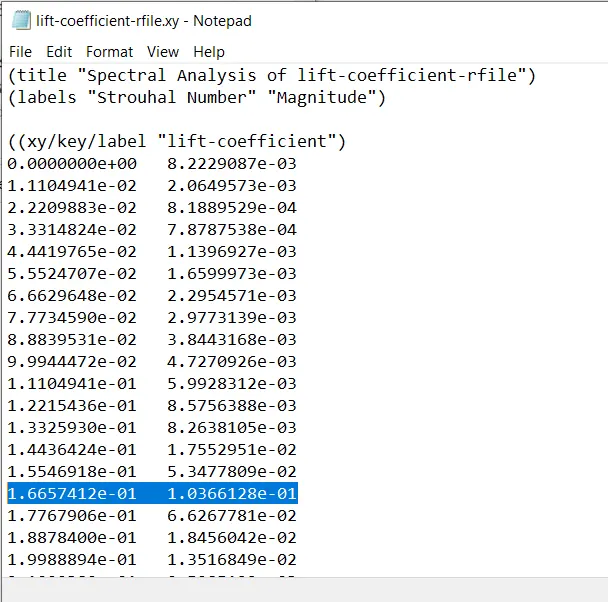
The above data provide the Strouhal Number, In the above case of unsteady-state simulation, the Strouhal number is 0.166.
SOLUTION:
PART 2.
- Calculate the coefficient of drag and lift over a cylinder by setting the Reynolds number to 10, 100, 1000, 10000, and 100000. (Run with steady solver)
- Discuss the effect of Reynolds number on the coefficient of drag.
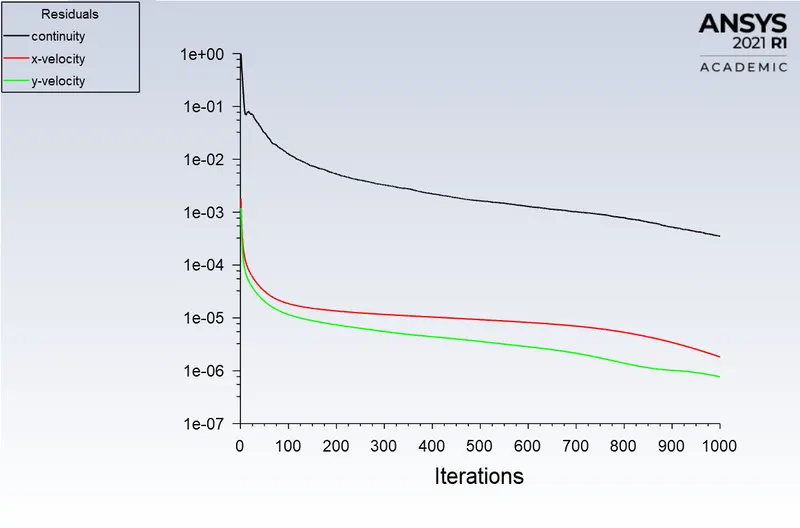
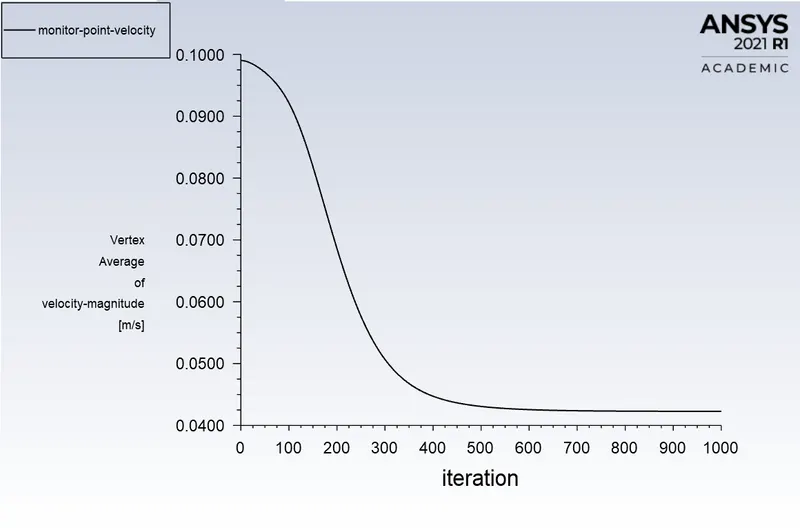
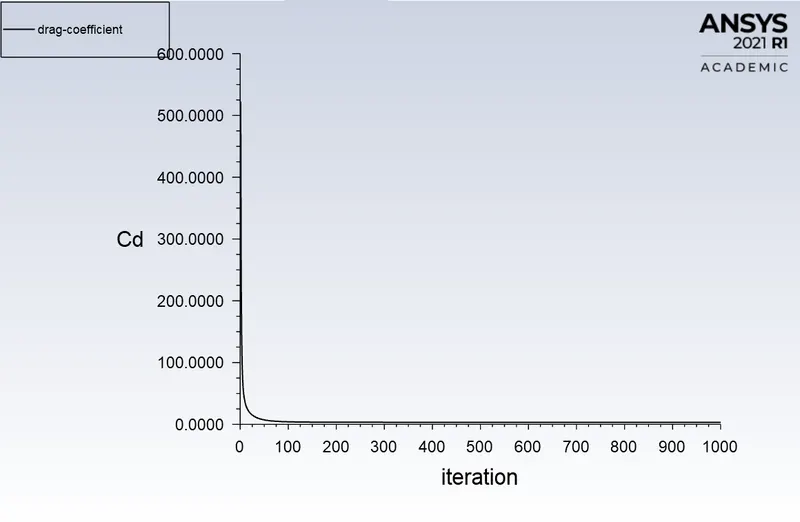
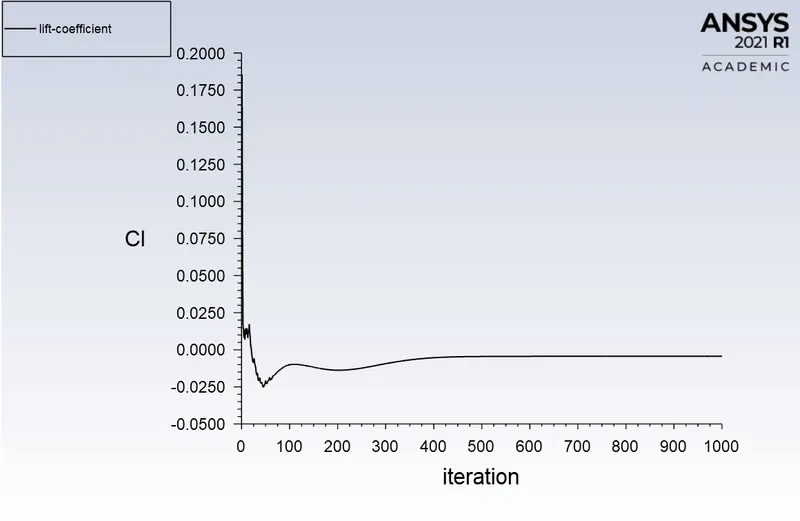
Case 1:
Reynolds Number = 10
Viscosity = 0.02
Velocity = 0.1
Residual Plot:
Vertex Average of Velocity Magnitude Plot:
Coefficient of Drag Plot:
Coefficient of Lift Plot:
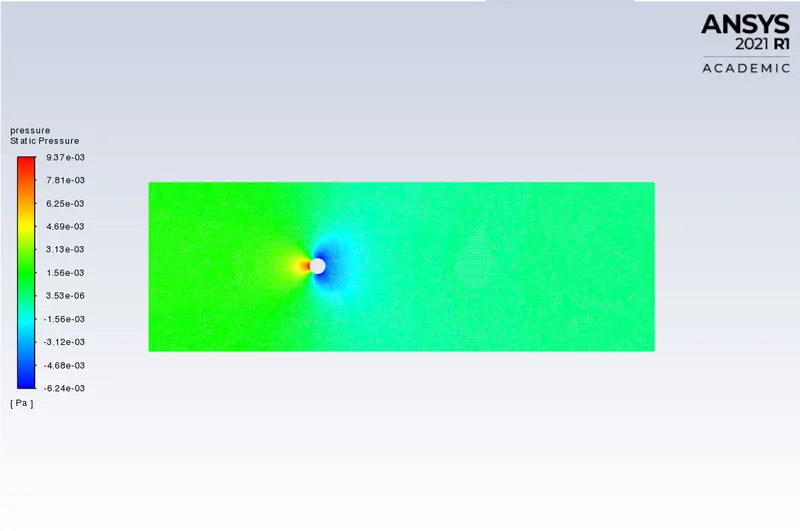
Pressure Contour Plot:
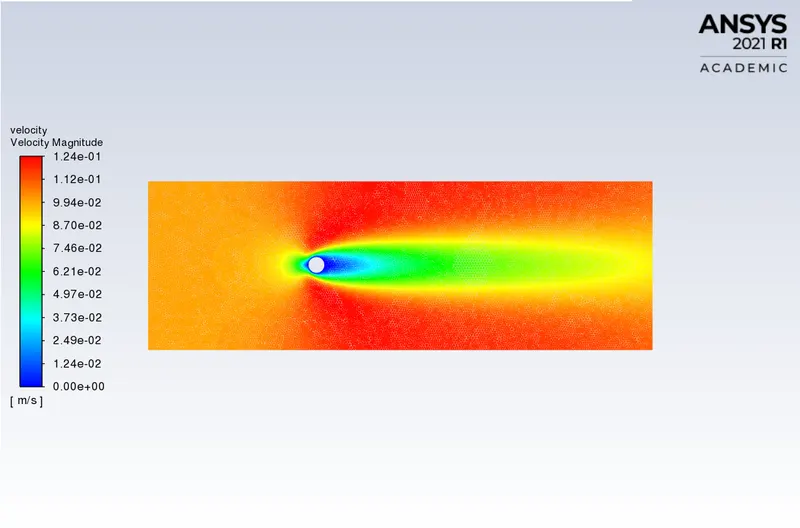
Velocity Contour Plot:
Case 2:
Reynolds Number = 100
Viscosity = 0.02
Velocity = 1
Residual Plot:
Vertex Average of Velocity Magnitude Plot:
Coefficient of Drag Plot:
Coefficient of Lift Plot:
Pressure Contour Plot:
Velocity Contour Plot:
Contour Plot showing vortex shedding behind the cylinder:
Case 3:
Reynolds Number = 1000
Viscosity = 0.02
Velocity = 10
Residual Plot:
Vertex Average of Velocity Magnitude Plot:
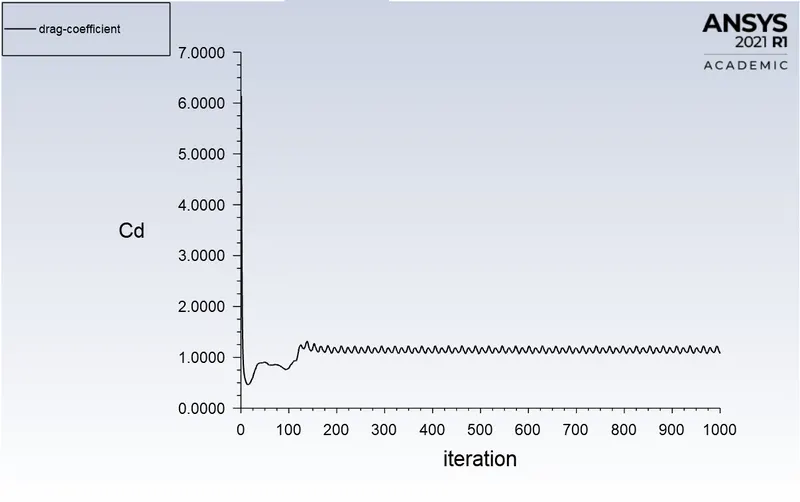
Coefficient of Drag Plot:
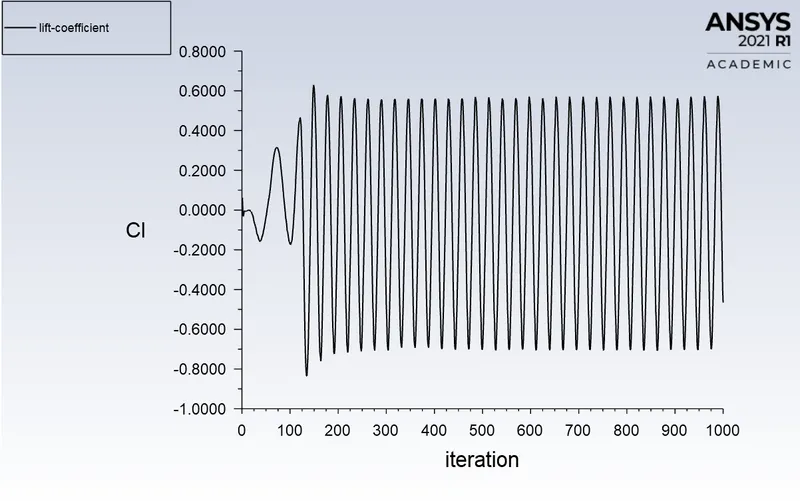
Coefficient of Lift Plot:
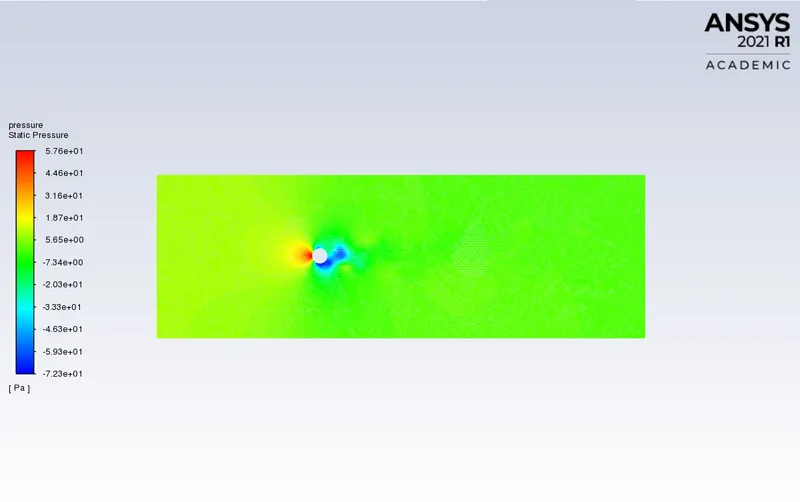
Pressure Contour Plot:
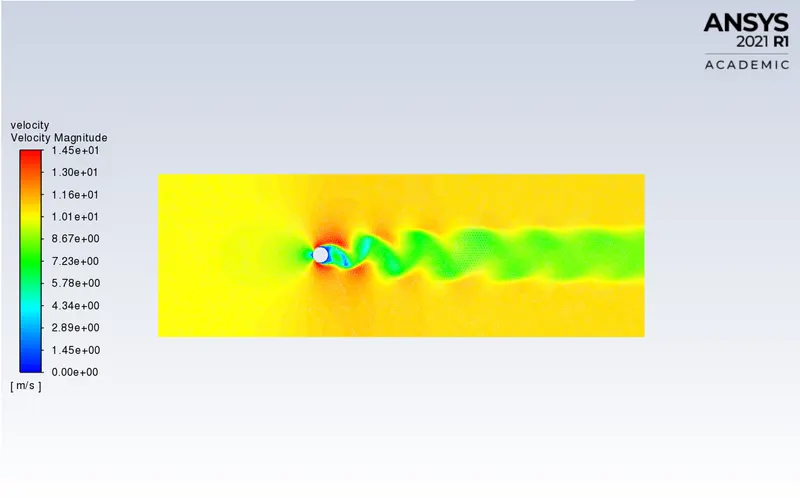
Velocity Contour Plot:
Contour Plot showing vortex shedding behind the cylinder:
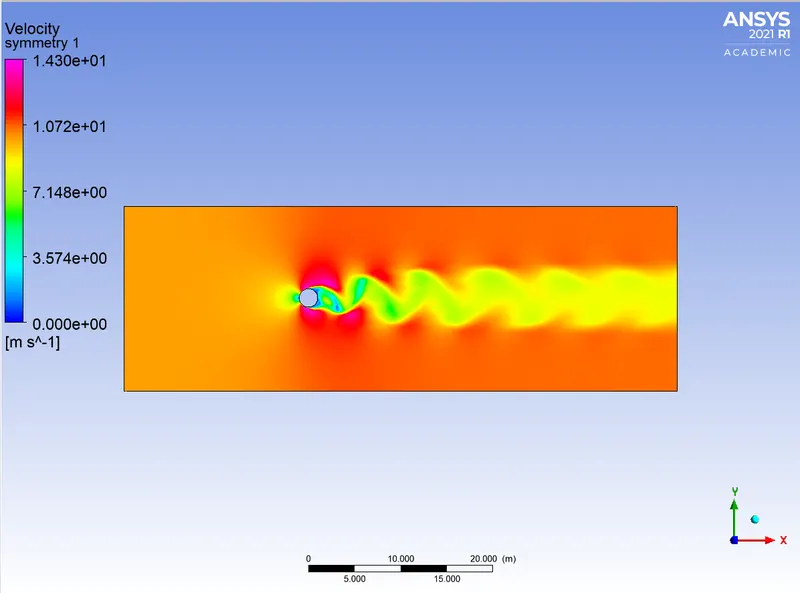
Case 4:
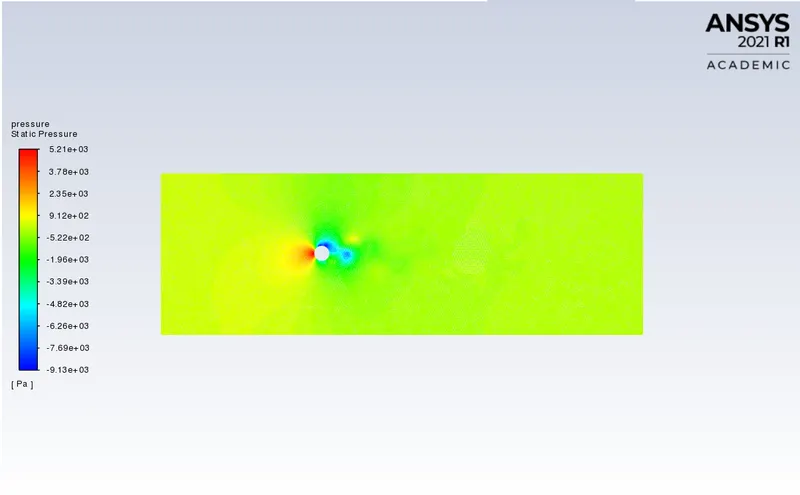
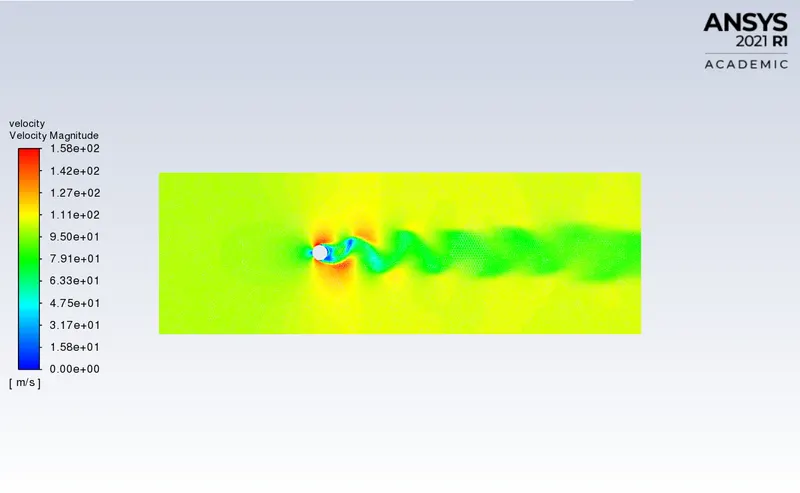
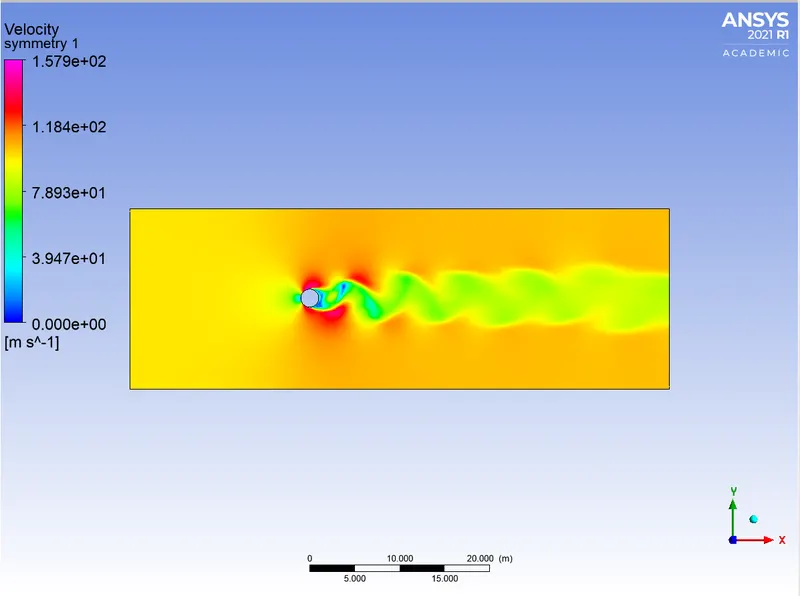
Reynolds Number = 10000
Viscosity = 0.02
Velocity = 100
Residual Plot:
Vertex Average of Velocity Magnitude Plot:
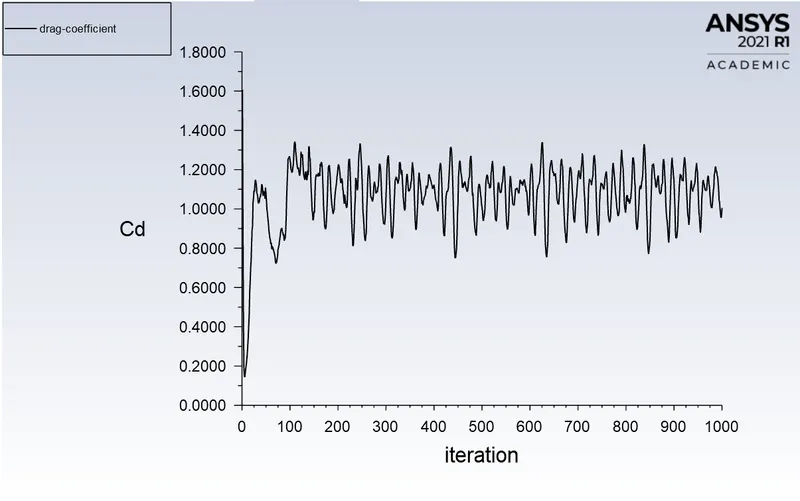
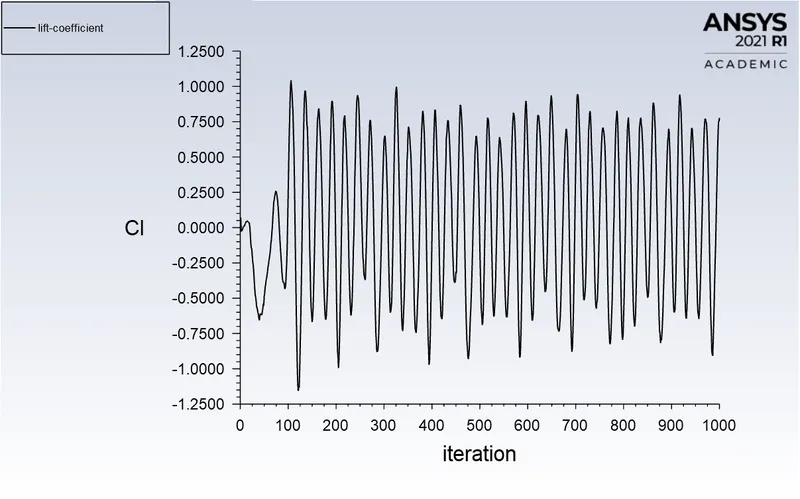
Coefficient of Drag Plot:
Coefficient of Lift Plot:
Pressure Contour Plot:
Velocity Contour Plot:
Contour Plot showing vortex shedding behind the cylinder:
Case 5:
Reynolds Number = 100000
Viscosity = 0.02
Velocity = 1000
Residual Plot:
Vertex Average of Velocity Magnitude Plot:
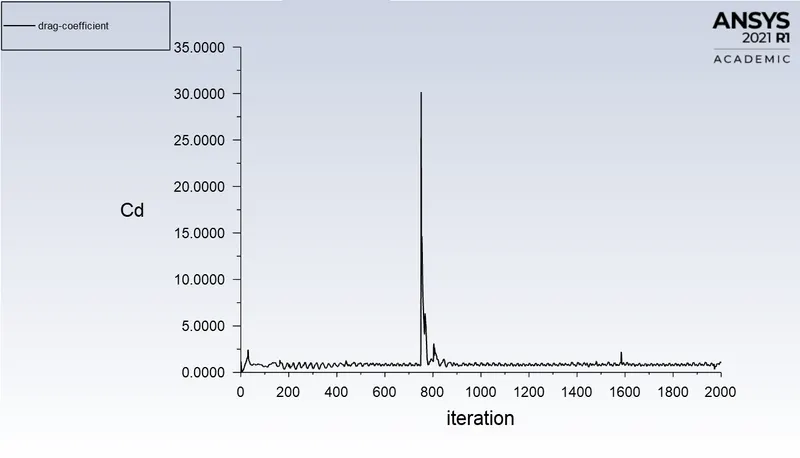
Coefficient of Drag Plot:
Coefficient of Lift Plot:
Pressure Contour Plot:
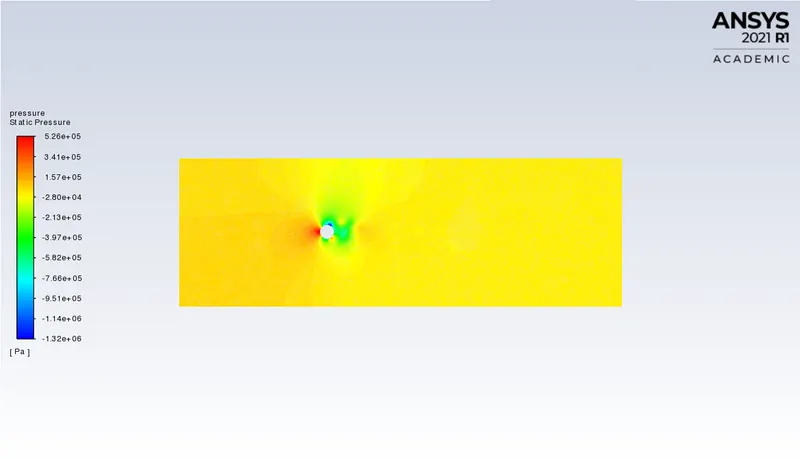
Velocity Contour Plot:
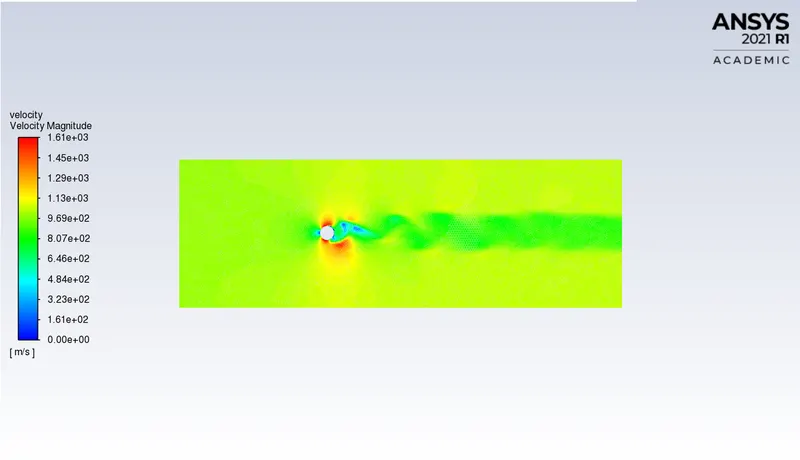
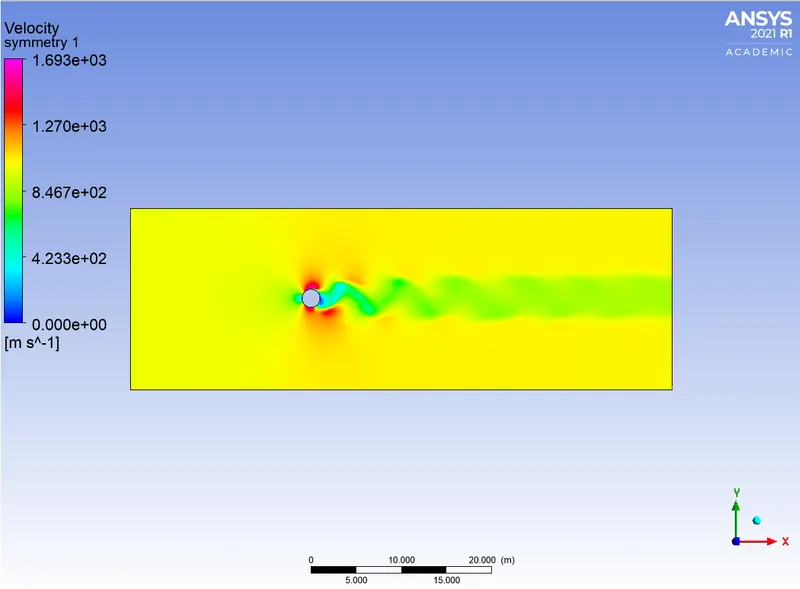
Contour Plot showing vortex shedding behind the cylinder:
Calculated Drag coefficient and lift over a cylinder:
| Reynolds Number | Average Coefficient of Drag | Average Coefficient of Lift |
| 10 | 3.3249909 | -0.0043311986 |
| 100 | 1.3319977 | 0.083112968 |
| 1000 | 1.0742261 | 0.4654907 |
| 10000 | 1.0047883 | 0.77738633 |
| 100000 | 1.0033868 | 0.91458123 |
The Effect of Reynolds Number on the Coefficient of Drag:
It is seen in the above table that as Raynolds number is increasing the Coefficient of Drag is decreasing and the coefficient of lift is increasing. This is happening because with increasing Reynolds number, the boundary layer gets thinner which results in lower drag. Increased surface friction will create a thinner boundary layer. And because of this drag get decreases and lift get increases. The negative coefficient of lift indicates the force is acting downwards.
The increase in Reynolds number leads to vortex shedding. At the lower Reynolds number, there is no formation of a vortex.
References:
https://www.yumpu.com/en/document/read/3866488/simulation-of-cross-flow-induced-vibration
https://www.sciencedirect.com/science/article/pii/S0307904X08000243
Some NPTEL lectures on Karman Vortex Street.