Week 2 - Flow over a Cylinder.
AIM:-Simulate the flow over a cylinder and explain the phenomenon of Karman vortex street.
Theory:
The Reynolds number is the ratio of inertial forces to viscous forces. The Reynolds number is a dimensionless number used to categorize the fluids systems in which the effect of viscosity is important in controlling the velocities or the flow pattern of a fluid. Mathematically, the Reynolds number, NRe, is defined as
where
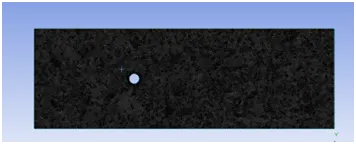
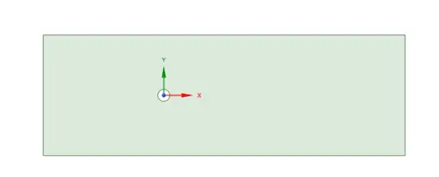 We create two dimensional geometry of cylinder dia 2m and length of the concentrated aria is 60m and 20m.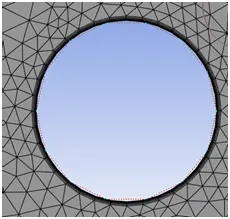
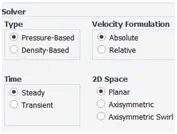
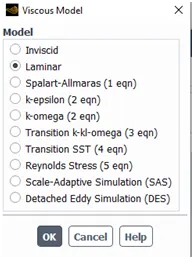 Here set the solver in pressure based and steady state mode and the viscuse model in the form of lamminar
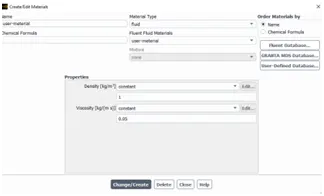 Then create a user-define meterial, because we have to change the dynametic viscocity to change the reynolds number.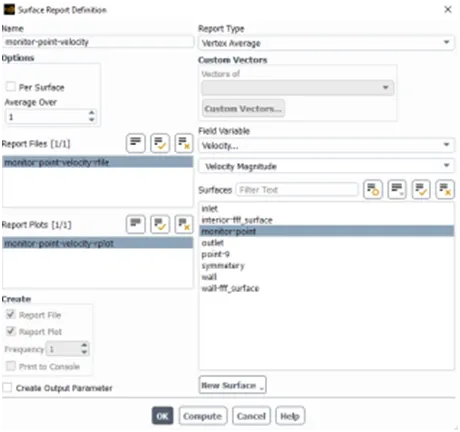
Create a velocity and pressure contour for velocity, pressure distribution over the surface.
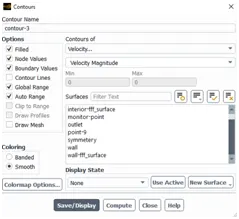
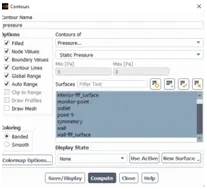
postprocecessing>>countour>>new
And creat animation to chenge of flow in the conure
syntax: solution>> activity>>Animation>>solution animation
a.For Reynolds no of the 100 and steady process
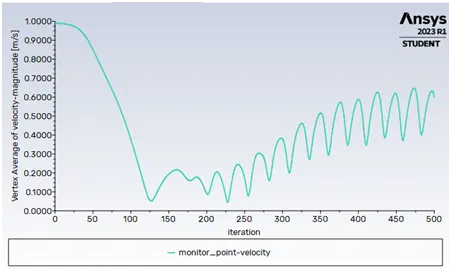
This is the graphe in between velocity magnitued at monitoring point and no itrration ,here velocity was flactuating in a coctand frequency ,but frequency was not able to find because the time was not define and the velocity flactuation stable after 500 iteration.
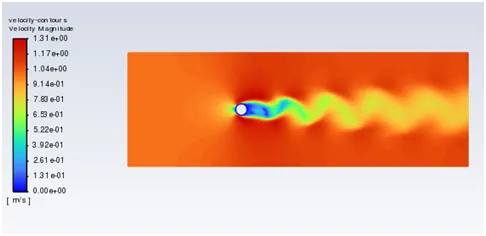 This is the velocity contour which is showing the weak region created .this is happen after 125 iteration .
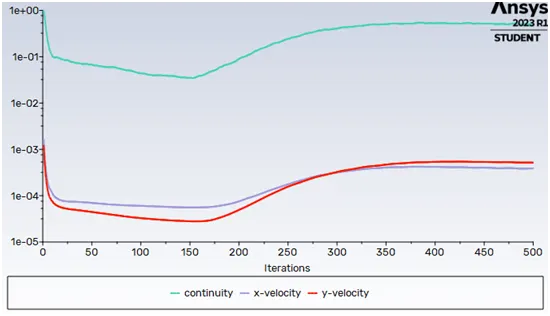 Here the flow was stady, so change of the value vleocity and mass is smooth .
b.For Reynolds no of the 100 and Unsteady process
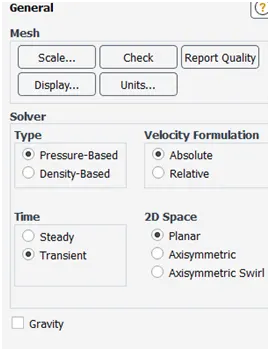 Now this is time related so change the solver in transient .
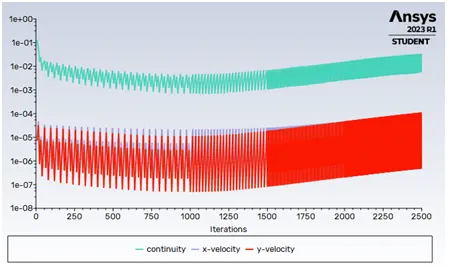 Here the values are changing with time so the grhap was is zig-zag in manner .But the values increasing smoothly with iteration.
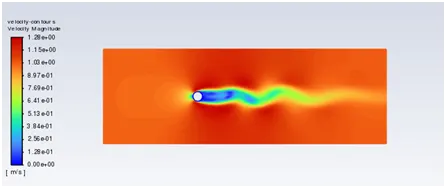
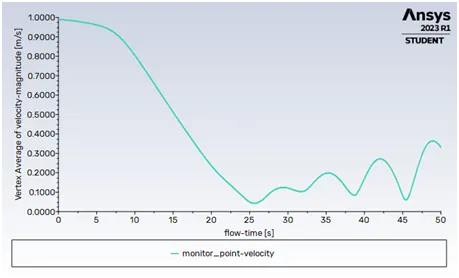
Here velocity at monitor point gradualy decreasing with every iteration till 25s ,then it moves toward creating vertex in costand frequancy but velocity flactuation increase with time .
Here the values are changing with time so the grhap was is zig-zag in manner .But the values increasing smoothly with iteration.
Here velocity at monitor point gradualy decreasing with every iteration till 25s ,then it moves toward creating vertex in costand frequancy but velocity flactuation increase with time .
c.For Reynolds no of the 10 and steady process:
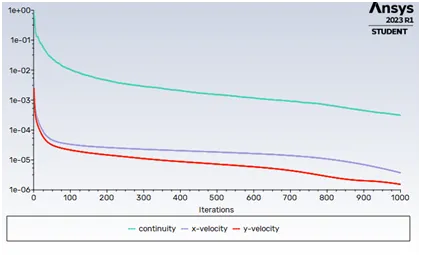
Here Reynolds no was very low so mass flow reate and velovity decreases and constand after 1000 iteration.
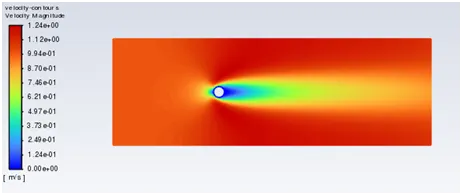
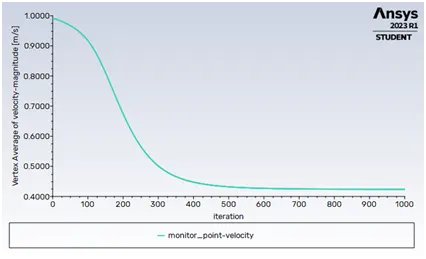
Here Reynolds no was low, so the flow was stable laminaer,the velocity at the monitor point is constand after 500 iteration.
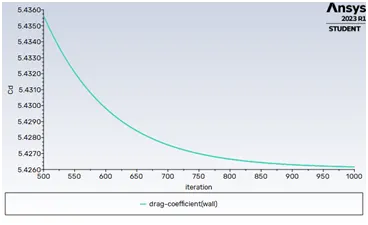 Here flow was laminar so the drag force also get stable after 1000 iteration.
d.For Reynolds no of the 1000 and steady process:
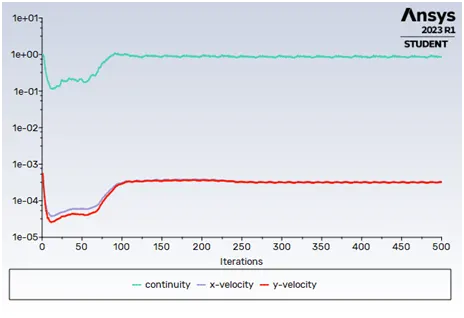 Here after 100 iteration velocity and continuty values are stabule with very small flactuation.
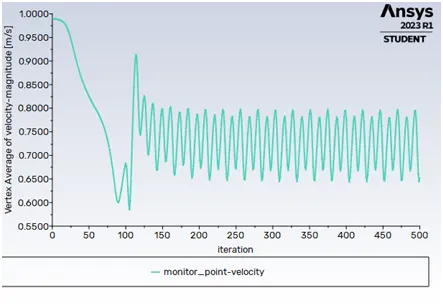
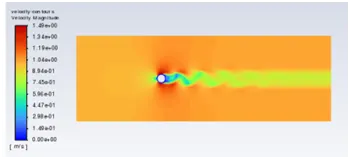
In this point vertex creation was started fequency was low, here velocity at the monitor point was stable at constand flactuation after 150 iteraton.
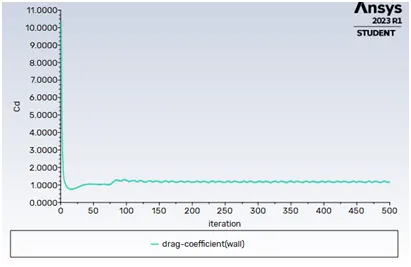
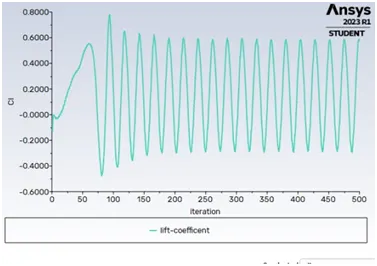
Drag coefficient was 1.000 with very low flactuation and lift coefficent was flactuating around -0.4 to 0.4.
e.For Reynolds no of the 10000 and steady process
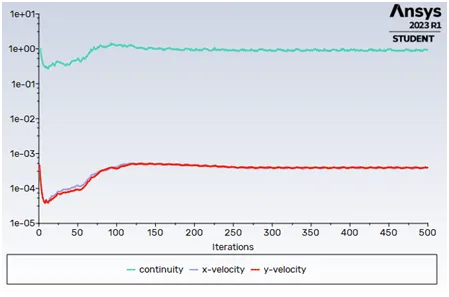 Here after 100 iteration velocity and continuty values are stabule with very small flactuation.
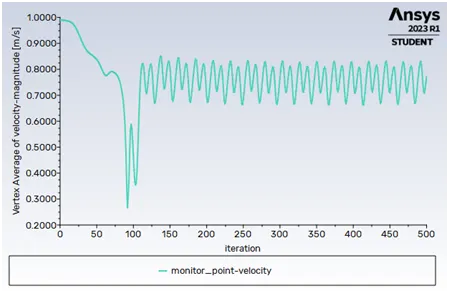
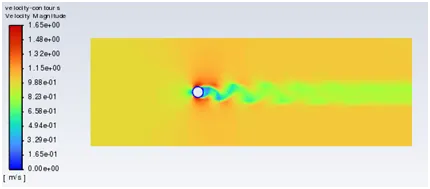
In this point vertex creation was started fequency was increses, here velocity at the monitor point was stable at constand flactuation after 120 iteraton.
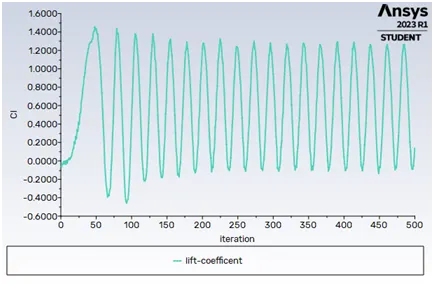
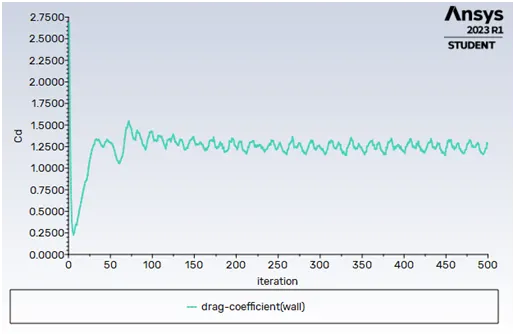
Drag coefficient was 1.25 with very low flactuation and lift coefficent was flactuating around -0.2 to 1.4 .
f.For Reynolds no of the 100000 and steady process
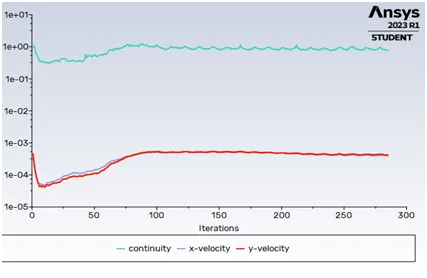 Here after 100 iteration velocity and continuty values are stabule with very small flactuation.
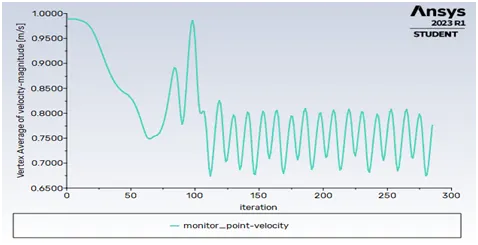
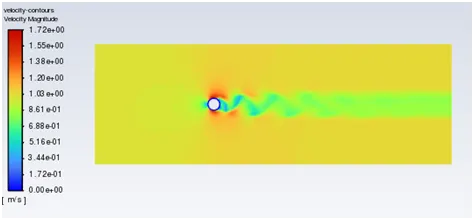
In this point vertex creation was started fequency was high, here velocity at the monitor point was stable at constand flactuation after 100 iteraton.
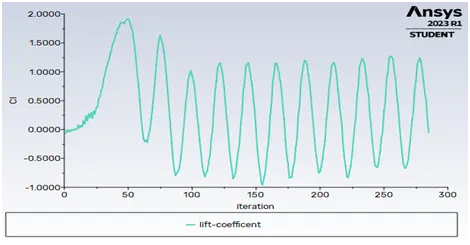
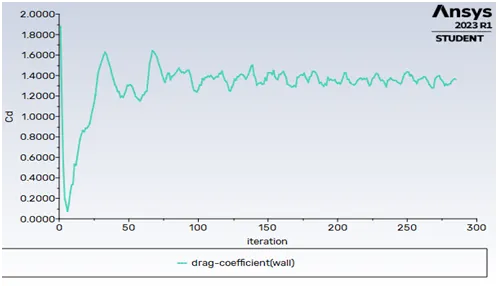
Drag coefficient was 1.4 with very high flactuation and lift coefficent was flactuating around -0.8 to 1 .
Van-karman vertex street:
- When the fluid flow toword the body, flow around the a bluff body producess a regular partten of alternating vertices know as van korman street.
- thus vertex produce a sinusudal force acting on the body perpendicular to the flow .for a cylinderical the frequency w (in Hz) of sheading to the dimeater D and wind speed v(m/s)
`s=(w*D)/V`
Conclusion:
- If we increases the Reynold number then frequency got increases,because sinusdal force acting on the body perpendecular to flow is increasing, So creation of vertex increases .
- Lift force flactuation Increase with increase in the reynolds number and Drag force increase with increase in tempreture.