Week 2 - Flow over a Cylinder.
Karman Vortex-
In fluid dynamics, a Karman vortex street is a repeating pattern of swirling vortices, caused by a process known as vortex shedding, which is responsible for the unsteady separation of the flow of fluid around blunt bodies.

A vortex street will form only at a certain range of flow velocities, specified by a range of Reynolds numbers (Re), typically above a limiting Re value of about 90. The Reynolds Number for a flow is a measure of the ratio of inertial to viscous forces in the flow of a fluid around a body or in a channel.
`Re = (U*L)/v_0`
where, U - free stream flow speed
L - characteristic length of the body
`v_0` - free stream kinematic viscosity which is the ratio of reference fluid density and the free stream fluid dynamic viscosity (`v_0 = mu_0/rho_0`)
As a fluid particle flows toward the leading edge of a cylinder, the pressure on the particle rises from the free stream pressure to the stagnation pressure. The high fluid pressure near the leading edge impels flow about the cylinder as boundary layers develop on both sides. The high pressure is not sufficient to force the flow about the back of the cylinder at high Reynolds numbers. Near the widest section of the cylinder, the boundary layers separate from each side of the cylinder surface and form two shear layers that trail aft in the flow and bound the wake. Since the innermost portion of the shear layers, which is in contact with the cylinder, moves much more slowly than the outermost portion of the shear layers, which is in contact with the free flow, the shear layers roll into the near wake, where they fold on each other and coalesce into discrete swirling vortices. A regular pattern of vortices called a vortex street trails aft in the wake.
Strouhal Number -
The Strouhal Number is a dimensionless value useful for analyzing oscillating unsteady fluid flow dynamics problems. The Strouhal Number represents a measure of the ratio of the inertial forces due to the unsteadiness of the flow or local acceleration to the inertial forces due to changes in velocity from one point to another in the flow field.
It cannot be calculated for the steady state as there is no time parameter that is required in frequency calculation and can only be calculated for unsteady state conditions.
The Strouhal Number can be expressed as
`St=(omega*L)/v`
where St = Strouhal Number
ω">ω= oscillation frequency
L = characteristic frequency
v = flow velocity
Fluid Flow (Fluent) -
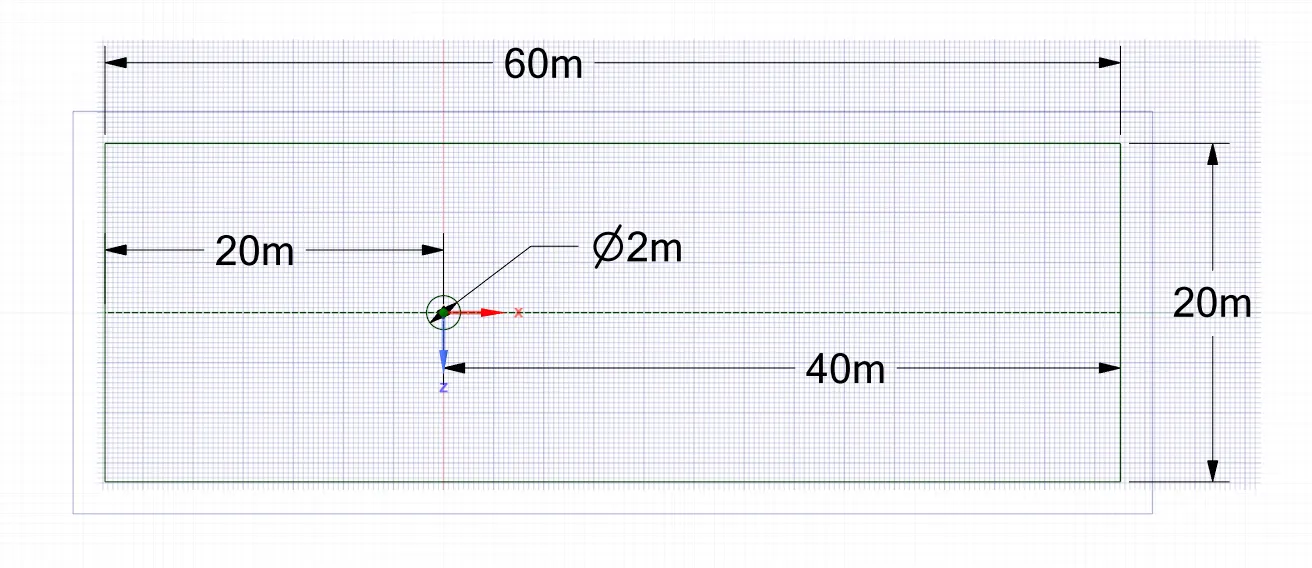
2D Geometry with dimensions from SpaceClaim -
Meshing -
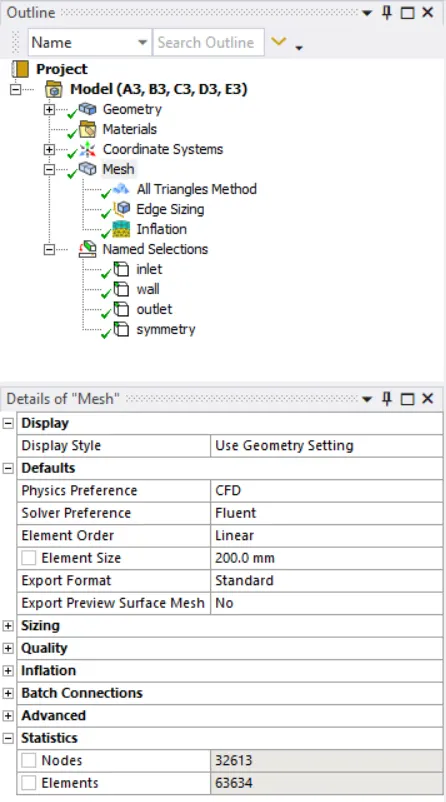
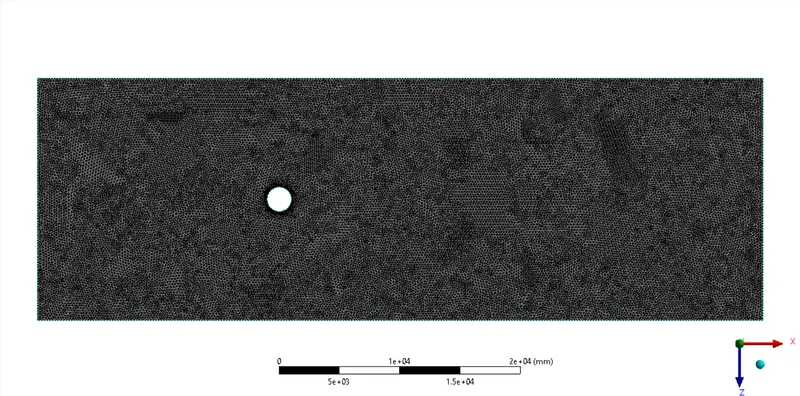
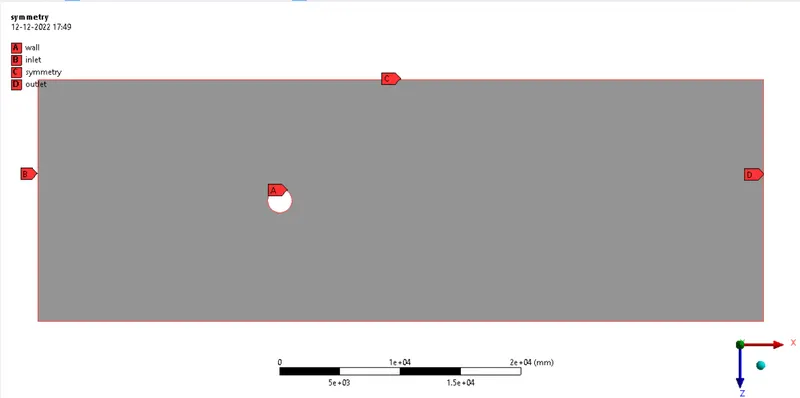
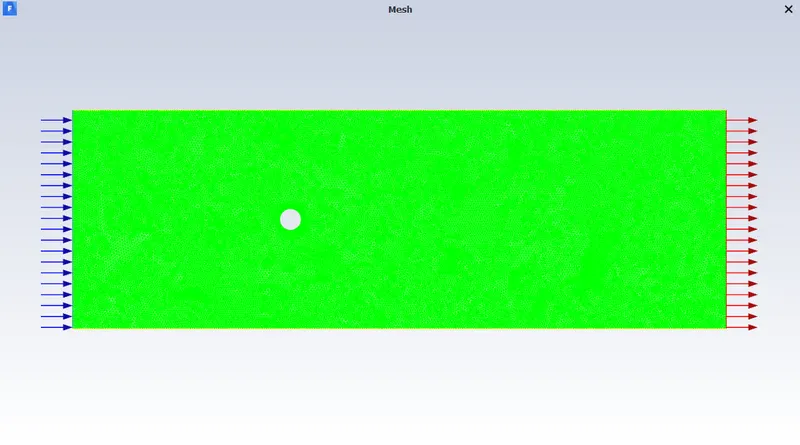
In the mesh, we set the mesh size as 0.25m and insert the meshing method as Triangles. For edge sizing of the cylinder edge, we set the number of divisions to 72 and give 10 inflation layers with a first layer height of 0.005m and a growth rate of 1.2. Named selection is also done with edges named inlet, symmetry, outlet, and wall.
Fluent Setup -
It is always good to run a check mesh to find any kind of errors in the geometry.
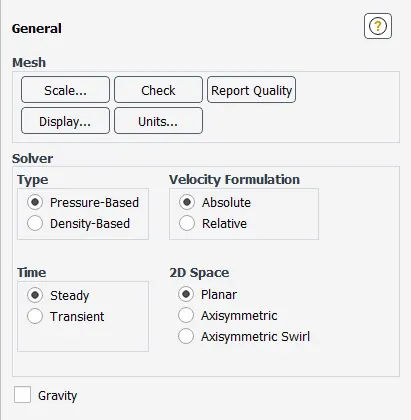
General:
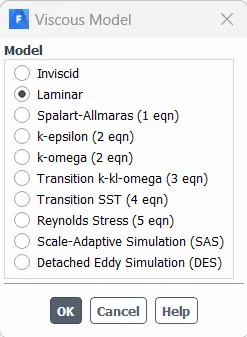
Models:
Materials:
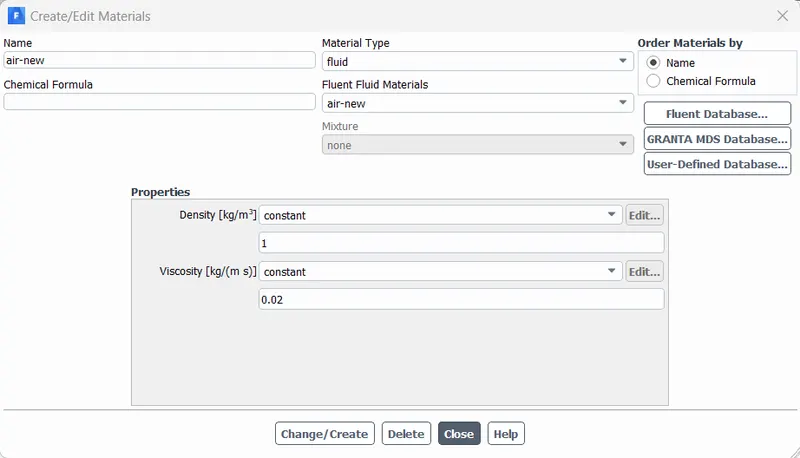
Creating a copy from a fluent database of fluid air and making changes to density and viscosity.
Cell Zone Conditions:
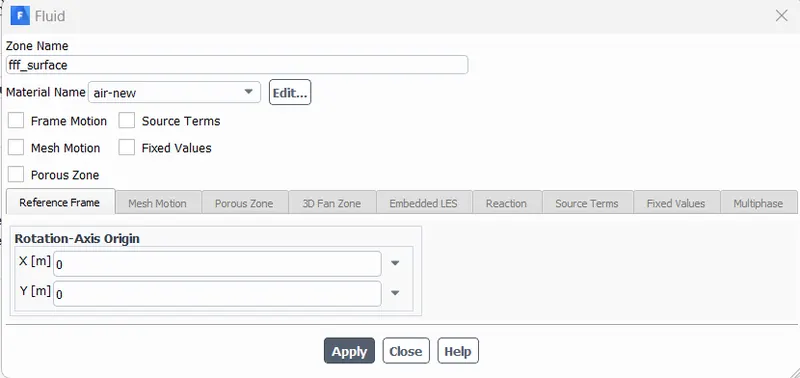
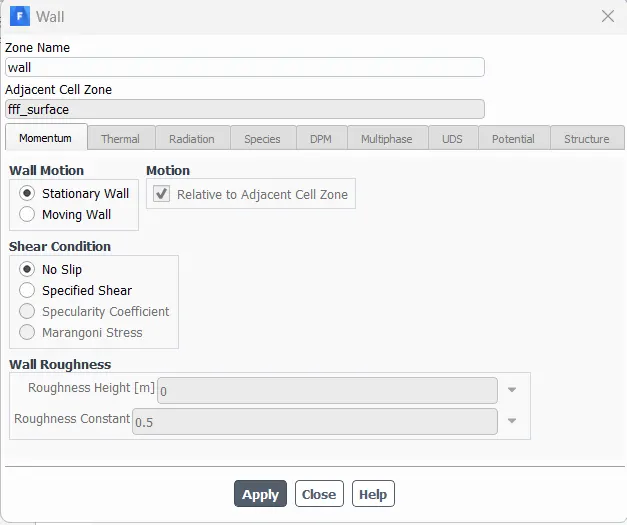
Boundary Conditions:
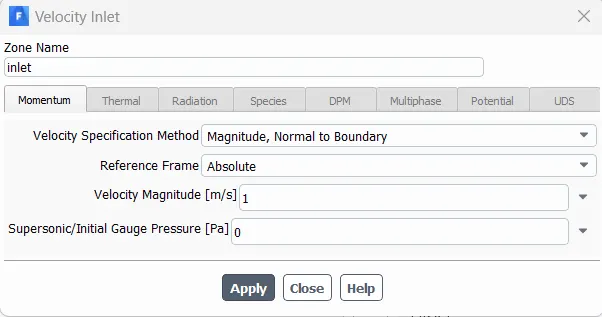
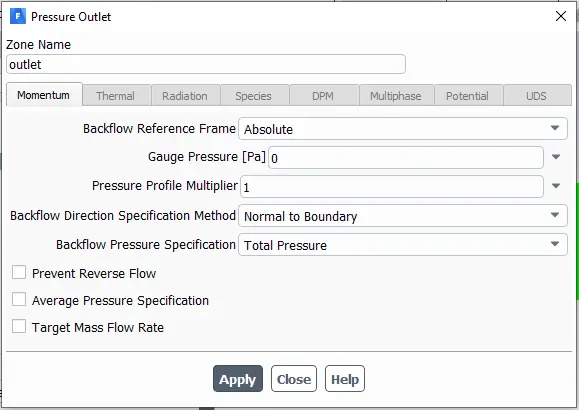
Boundary conditions are automatically assigned to named selections, we just need to change inlet velocity.
Inlet- Velocity Inlet
Velocity Magnitude- for Re = 10--->0.1 m/s
for Re = 100--->1 m/s
for Re = 1000--->10 m/s
for Re = 10000--->100 m/s
for Re = 100000--->1000 m/s
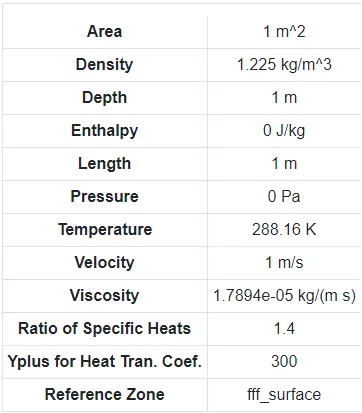
Reference Values:
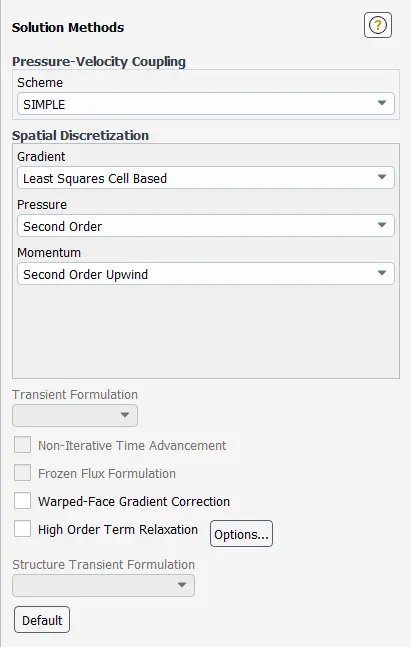
Solution Methods:
Setting solution method scheme to SIMPLE.
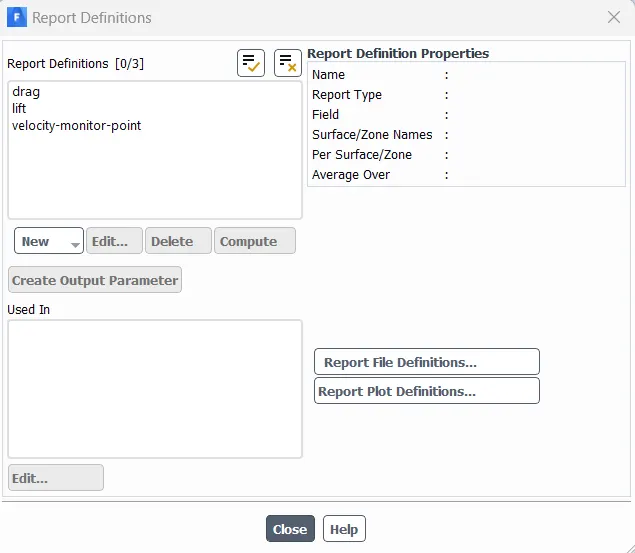
Report Definitions:
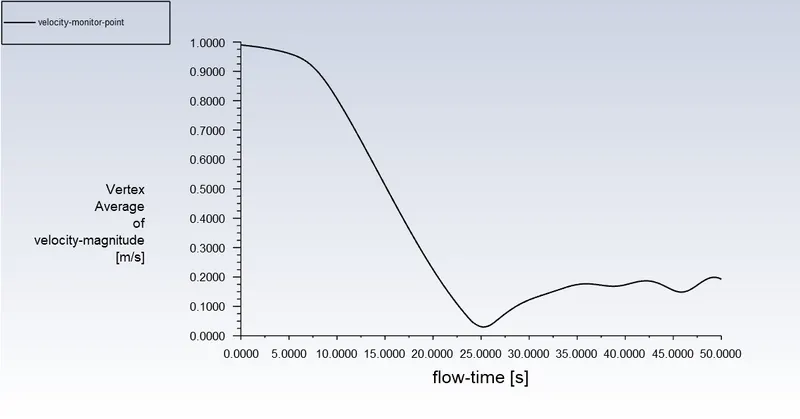
Create a Vertex average of velocity magnitude using a surface report at a monitor point 8m away from the center of the cylinder to the right of the cylinder along the X-direction. Also, add drag and lift from Force Report on the wall.
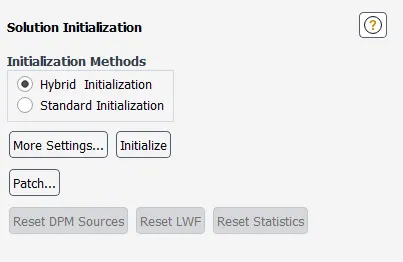
Solution Initialization:
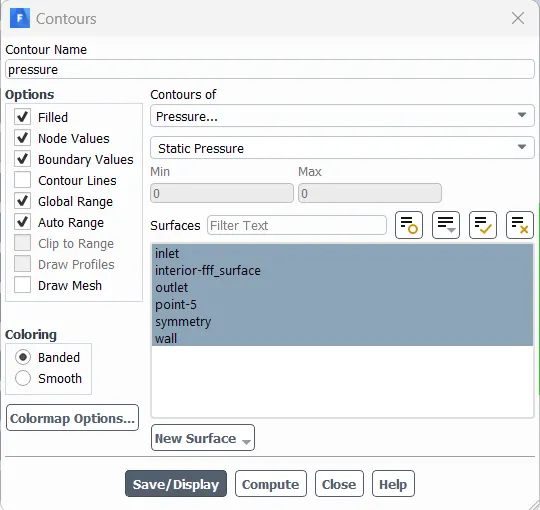
Contours:
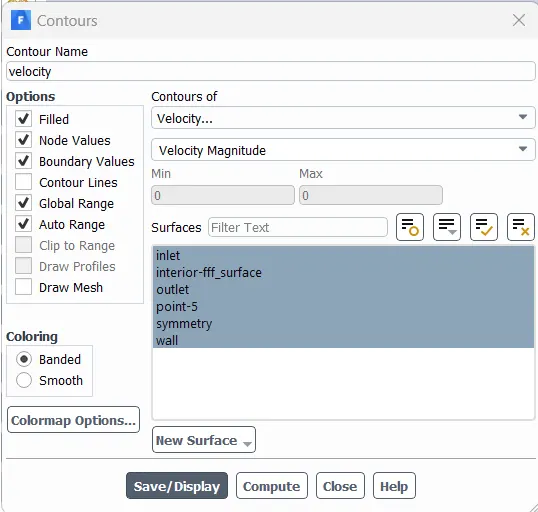
Calculation:
Steady- Number of Iterations=800
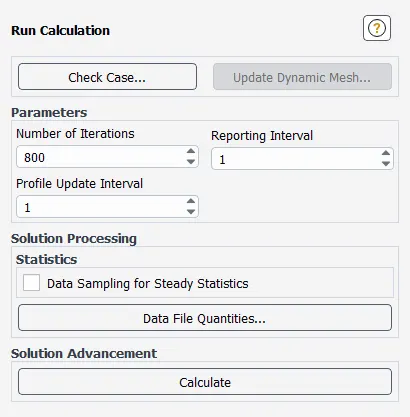
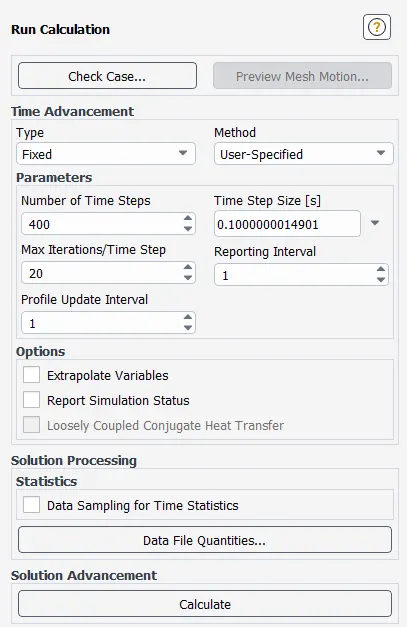
Transient- Number of Time Steps=400 & Time Step SIze=0.1
PART 1-
Steady-state for Re=100
Residuals:
Vertex Average Velocity:
Drag:
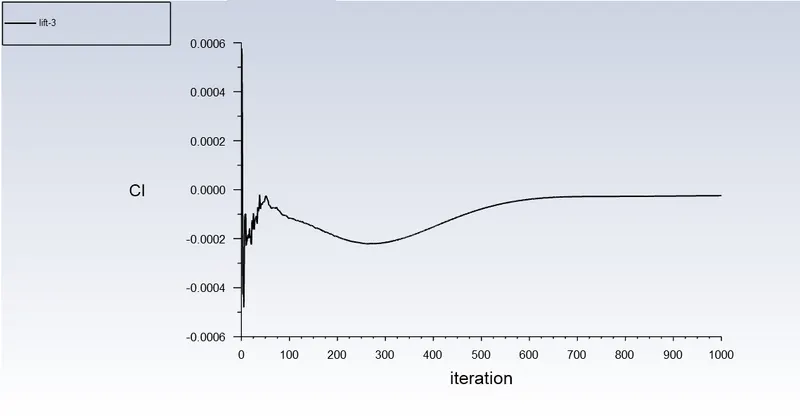
Lift:
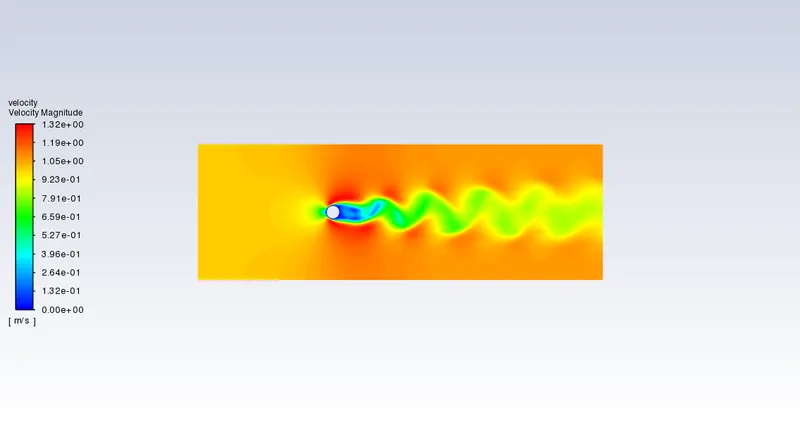
Velocity contour:
Pressure Contour-
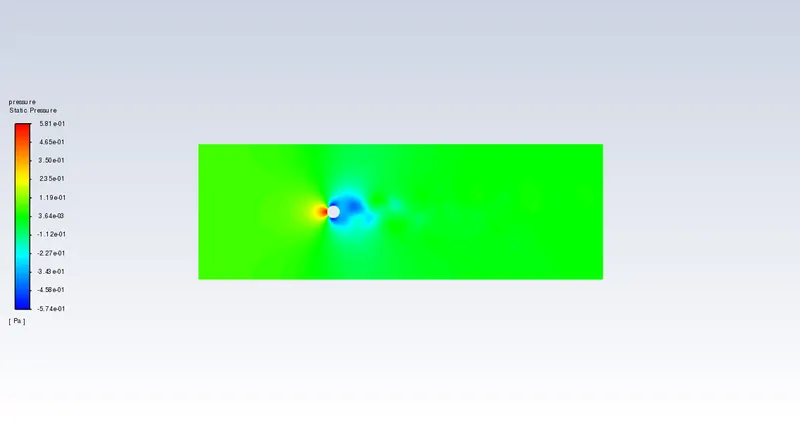
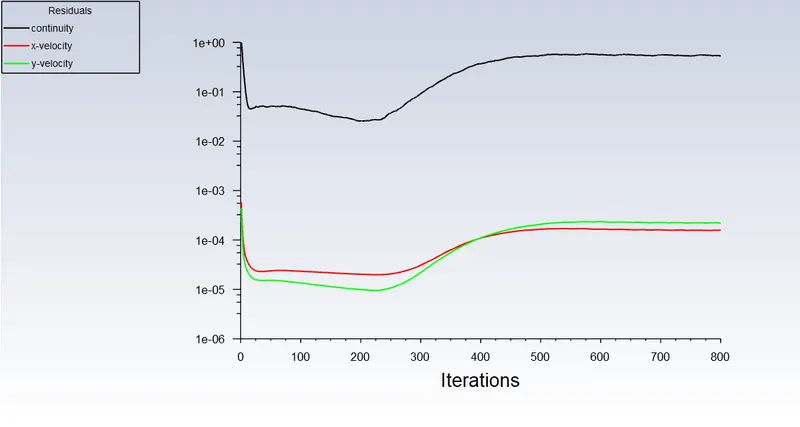
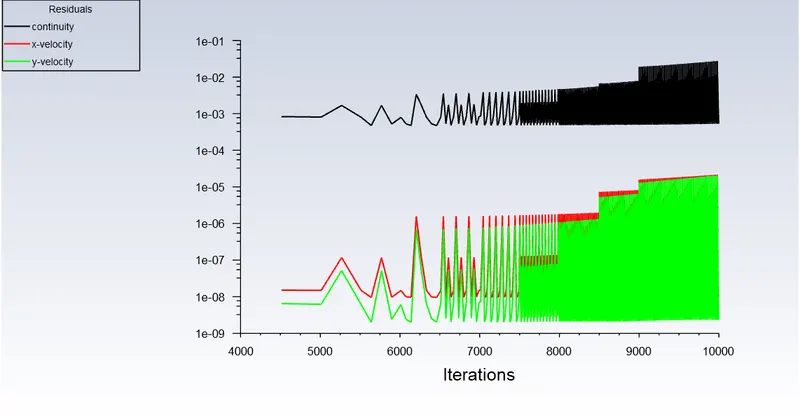
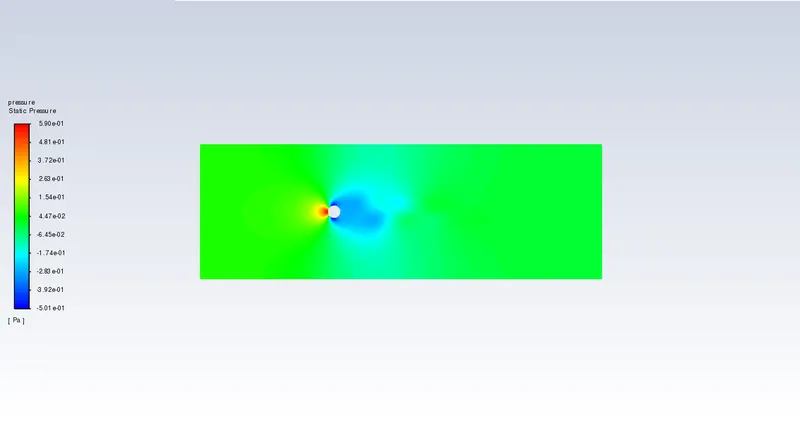
The above results show that the flow has reached a steady state as all the residuals are steady and in a straight line.
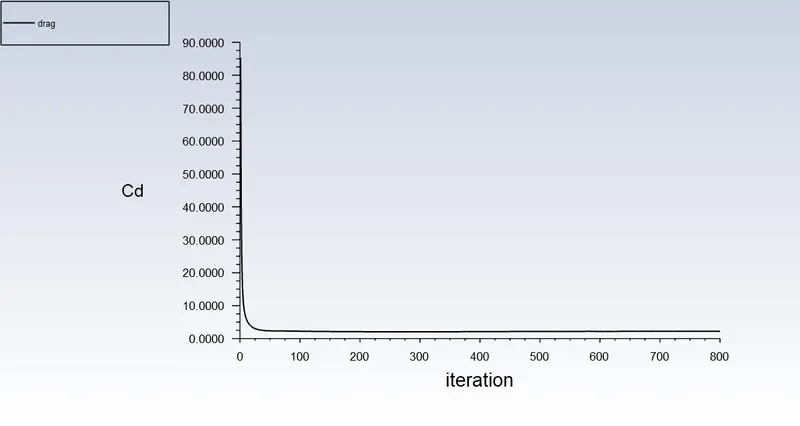
The recorded values of the drag coefficient and lift coefficient from the Ansys Fluent Simulation Report are:
Drag Coefficient = 2.198311
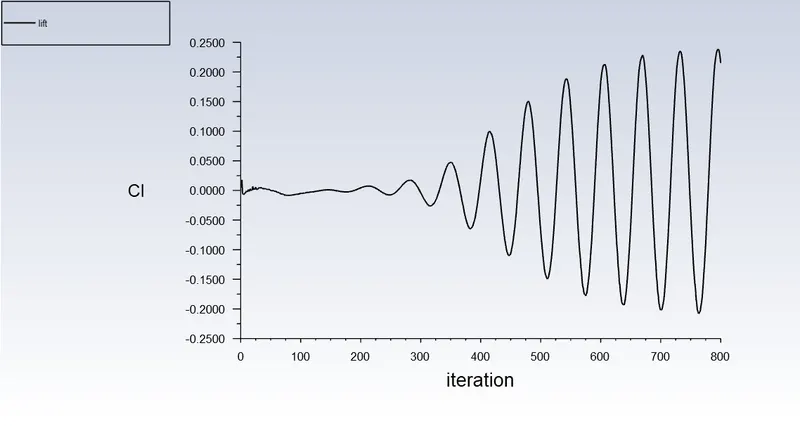
Lift Coefficient = 0.2150426
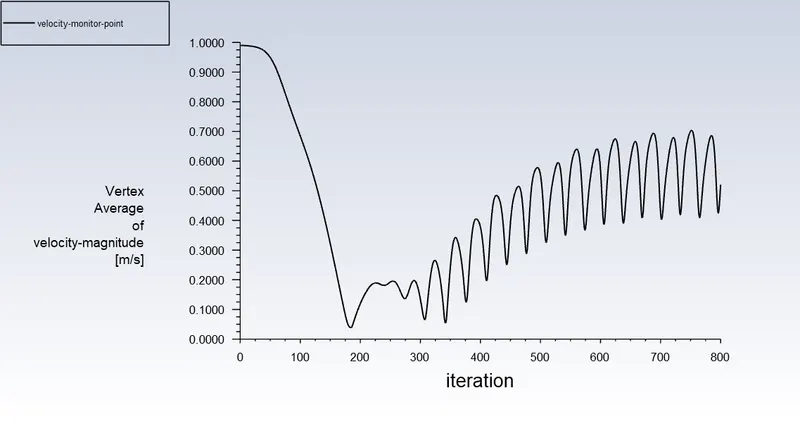
Velocity at Monitor Point = 0.5204914 m/s
Transient-state for Re=100
Residuals:
Vertex Average Velocity:
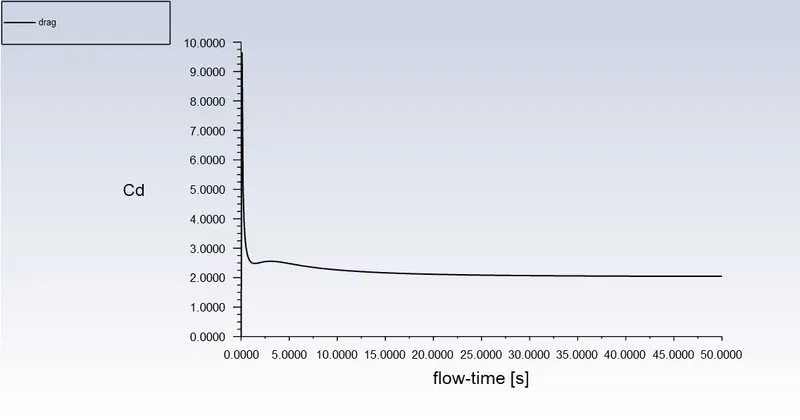
Drag:
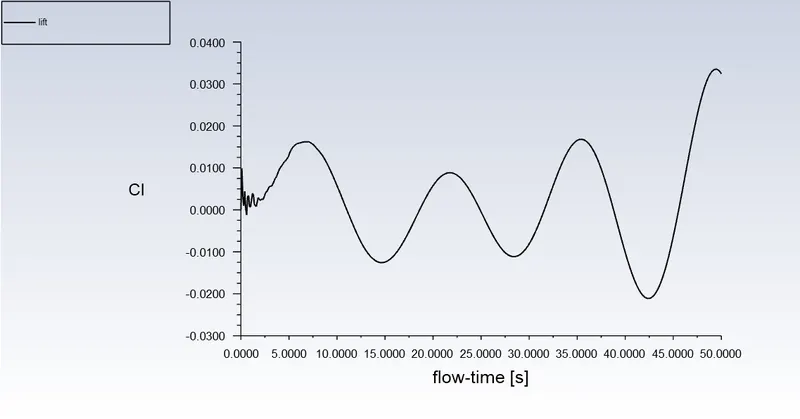
Lift:
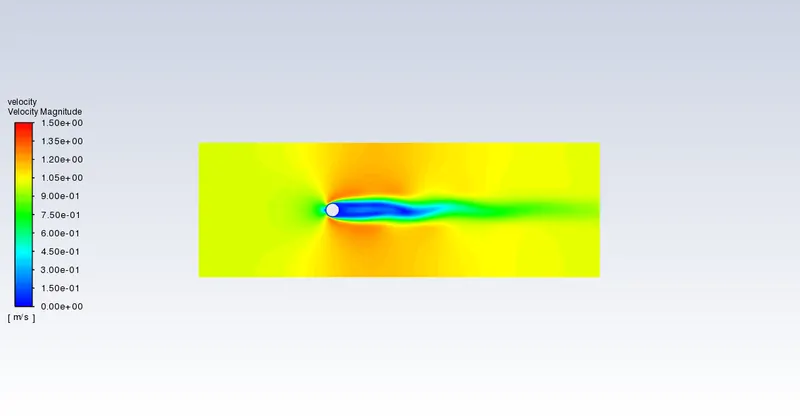
Velocity contour:
Pressure contour:
The recorded values of the drag coefficient and lift coefficient are:
Drag Coefficient = 2.04719
Lift Coefficient = 0.0324237
Velocity at Monitor Point = 0.1926321 m/s
Flow Time = 50sec
Strouhal Number, `St=(1.5*2)/1=0.3`
where ω=">ω=No.of peaks/Flow time = 3/20 = 1.5Hz
Part 2-
Steady-state for Re=10
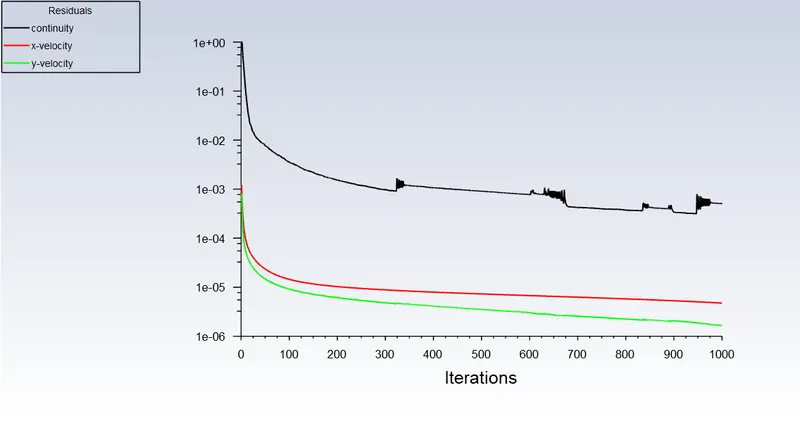
Residuals:
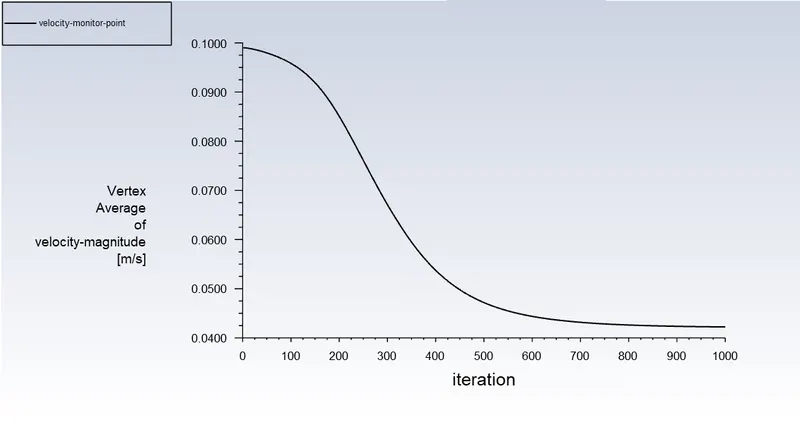
Vertex Average Velocity:
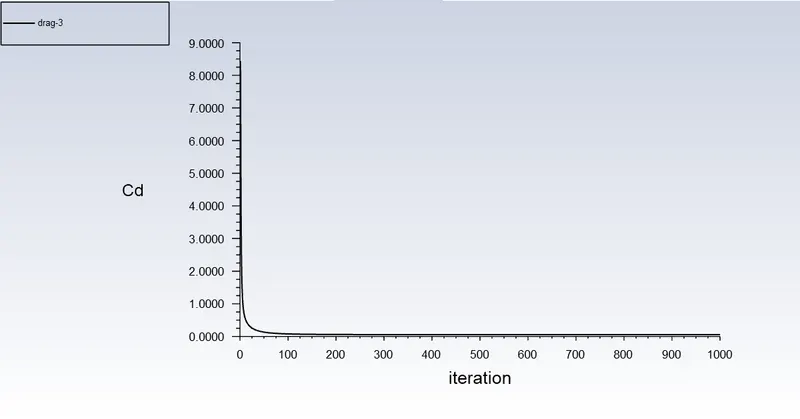
Drag:
Lift:
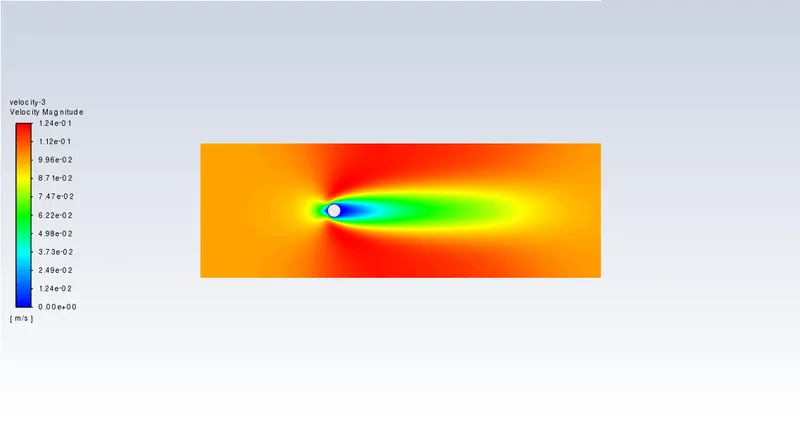
Velocity contour:
Pressure Contour-
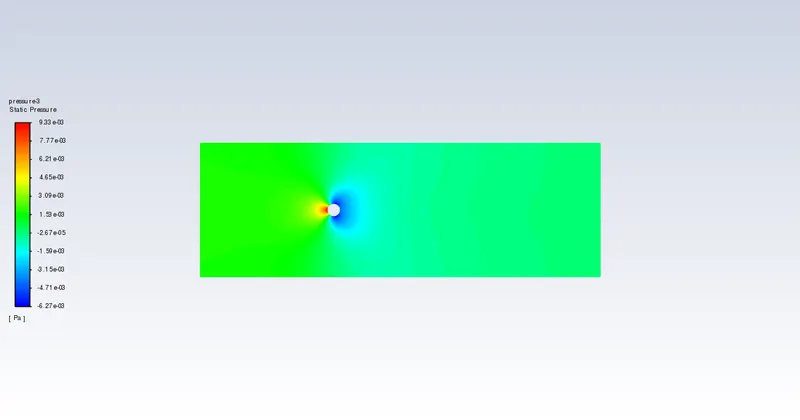
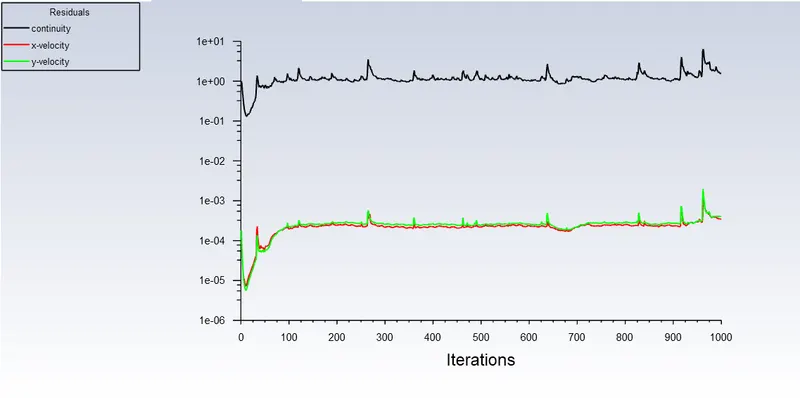
The above results show that the flow has reached a steady state as all the residuals are steady and in a straight line.
The recorded values of the drag coefficient and lift coefficient from the Ansys Fluent Simulation Report are:
Drag Coefficient = 0.05445583
Lift Coefficient = -2.425663e-05
Velocity at Monitor Point = 0.04222853 m/s
Steady-state for Re=1000
Residuals:
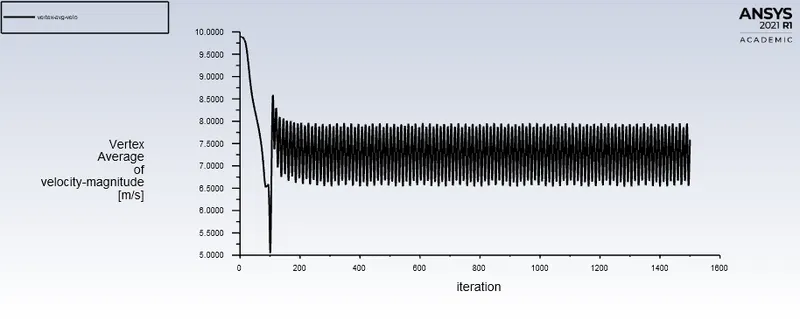
Vertex Average Velocity:
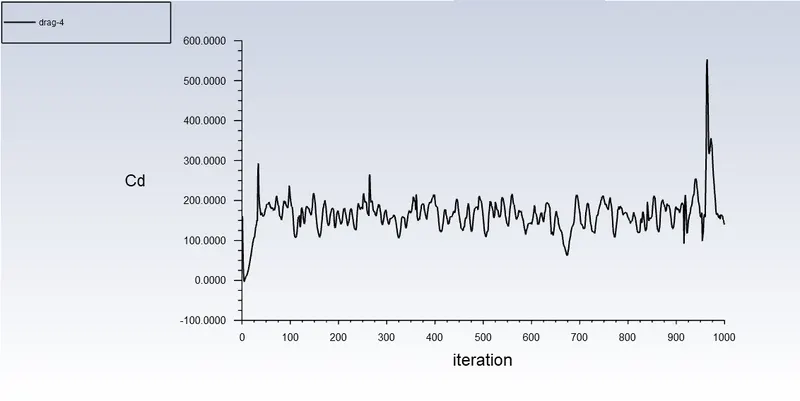
Drag:
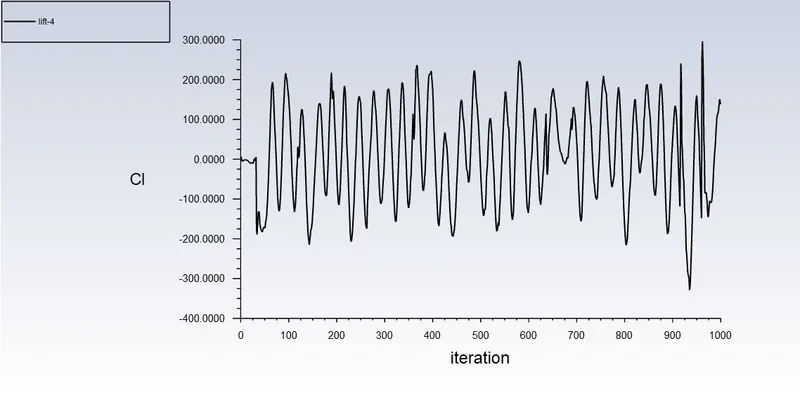
Lift:
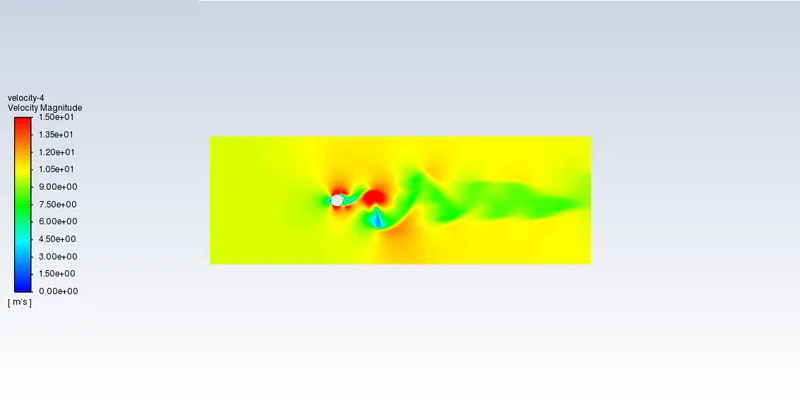
Velocity contour:
Pressure Contour-
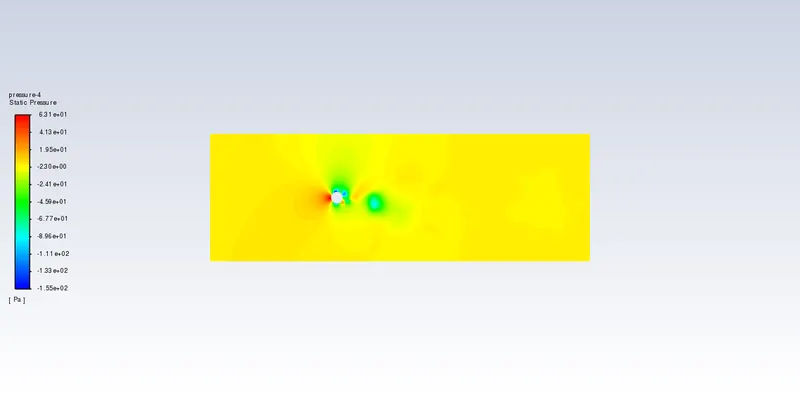
The above results show that the flow has reached a steady state as all the residuals are steady and in a straight line.
The recorded values of the drag coefficient and lift coefficient from the Ansys Fluent Simulation Report are:
Drag Coefficient = 0.73401042 139.6238
Lift Coefficient = 0.73401042 138.0911
Velocity at Monitor Point = 8.865969 m/s
Steady-state for Re=10000
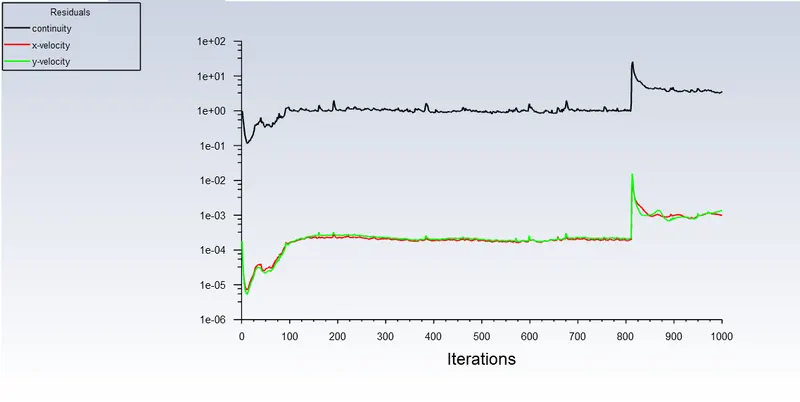
Residuals:
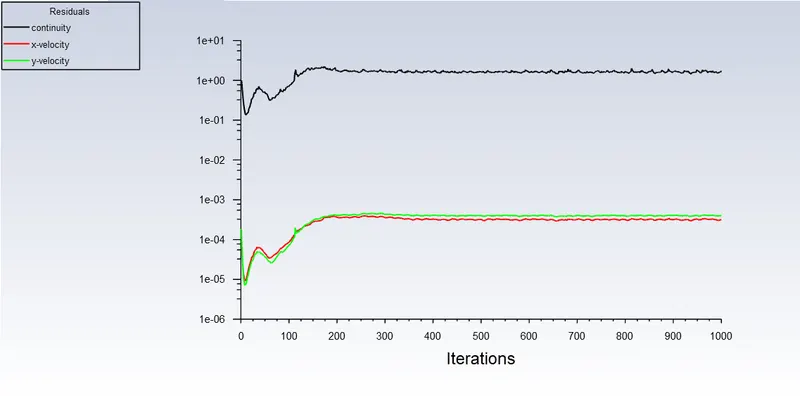
Vertex Average Velocity:
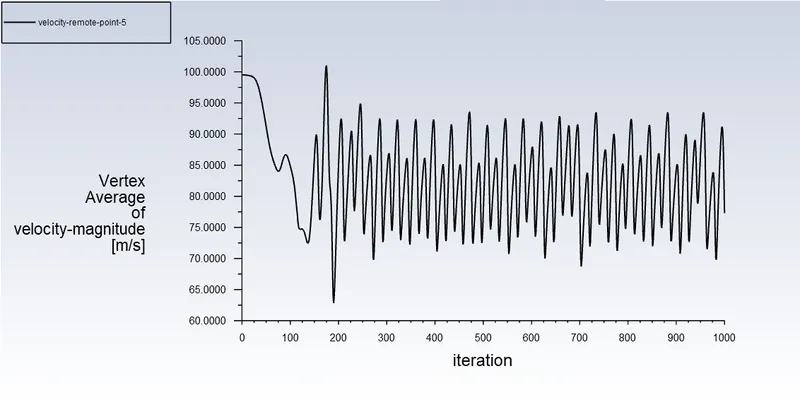
Drag:
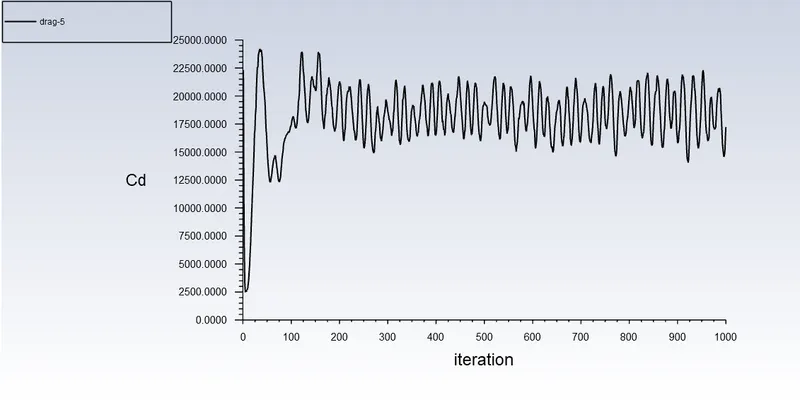
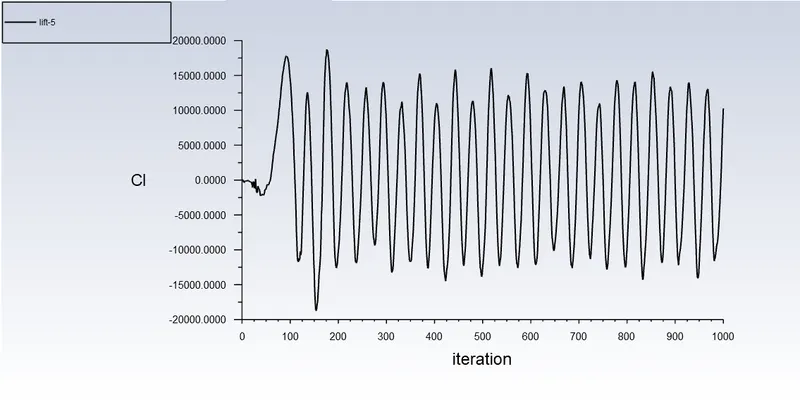
Lift:
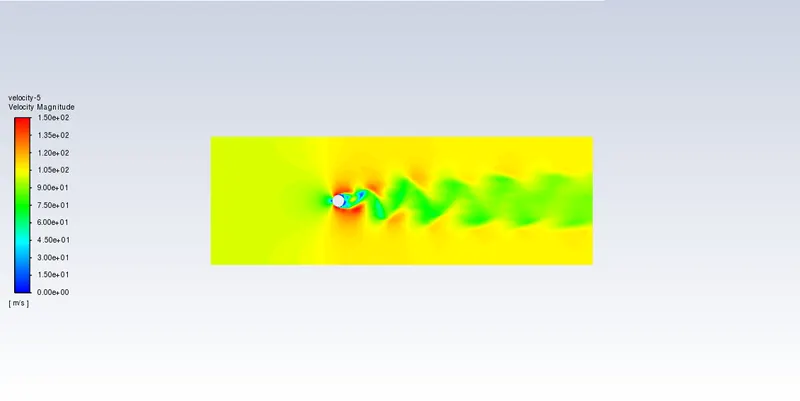
Velocity contour:
Pressure Contour-
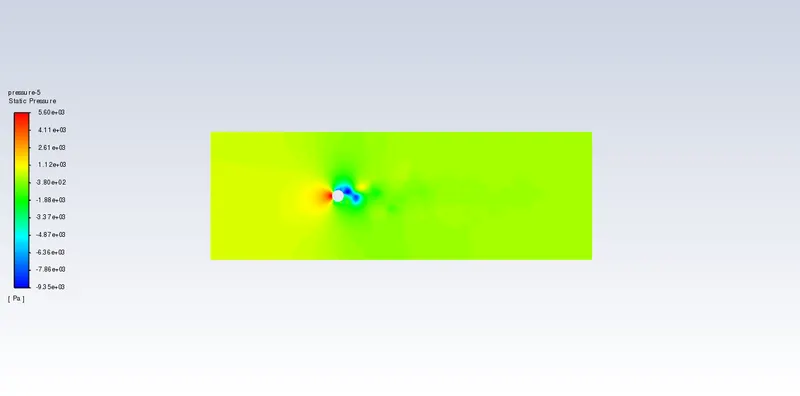
The above results show that the flow has reached a steady state as all the residuals are steady and in a straight line.
The recorded values of the drag coefficient and lift coefficient from the Ansys Fluent Simulation Report are:
Drag Coefficient = 17228.89
Lift Coefficient = 10264.61
Velocity at Monitor Point = 77.30149 m/s
Steady-state for Re=100000
Residuals:
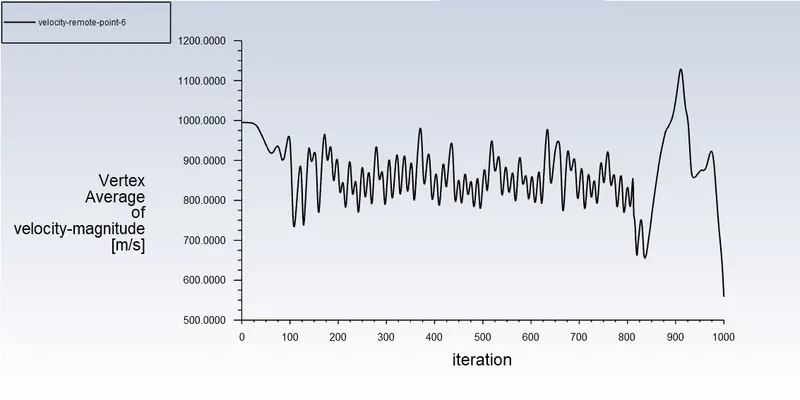
Vertex Average Velocity:
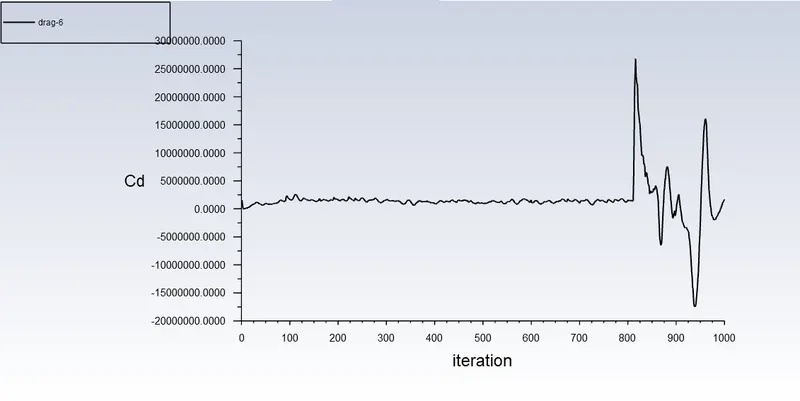
Drag:
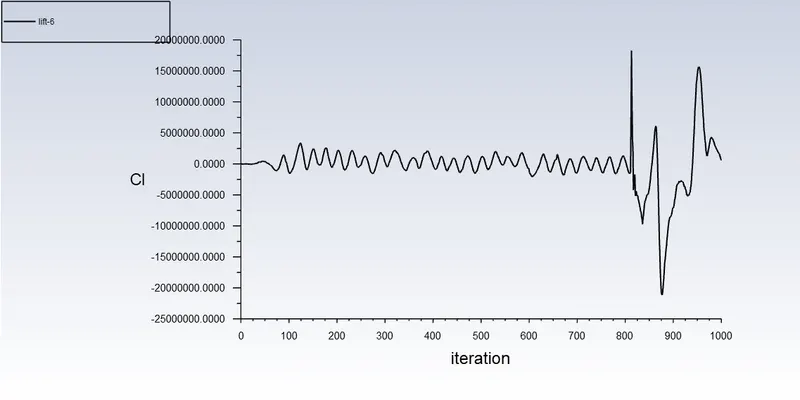
Lift:
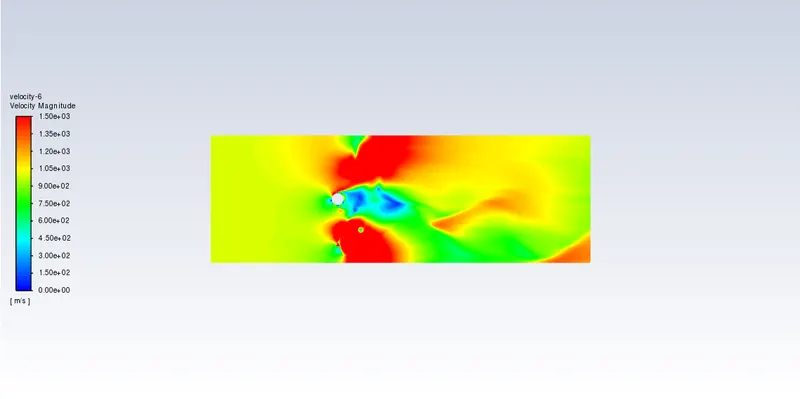
Velocity contour:
Pressure Contour-
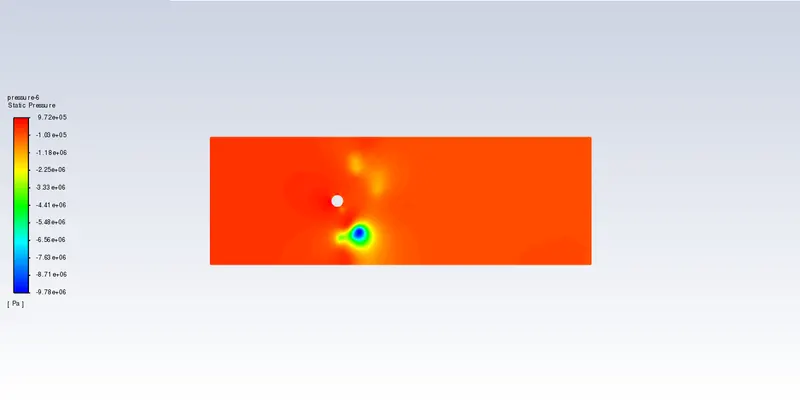
The above results show that the flow has reached a steady state as all the residuals are steady and in a straight line.
The recorded values of the drag coefficient and lift coefficient from the Ansys Fluent Simulation Report are:
Drag Coefficient = 1682619
Lift Coefficient = 575820.4
Velocity at Monitor Point = 558.4987 m/s
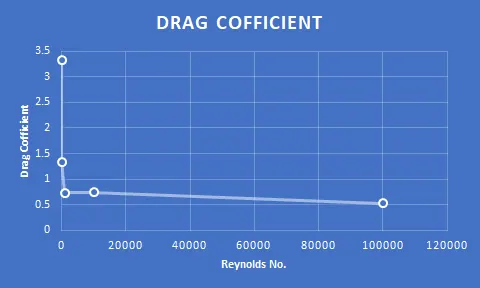
Effect of Reynolds Number on Drag Coefficient-
The above-recorded data is obtained from simulation for variation in Reynolds no. . Results show that as Reynolds no. increases the drag coefficient decreases. Only for case Re = 10000 drag coefficient slightly increase by 0.01.