Week 2 - Flow over a Cylinder.
:- Aim of this challange is to Simulate the flow over a cylinder and explain the phenomenon of Karman vortex street.
Theory:- When there is interation between solid body and a moving fluid, there shear stress and pressure acting along and normal to the interacating solid surface. Due to this shear force and pressure drag and lift force acting along normal to the upstreem velocity of fluid.
`F_d=1/2C_d*rho*A*v^2`
`F_l=1/2C_l*rho*A*v^2`
here Cd and Cl are drag and lift force. Drag force produce resitance to upstream and produce adverse presure gradient which is cause of flow seperation.
Here in our this challange a cylindercal body come in flow region, as in the cylinder curved surface are symetrical so net lift is zero.
Flow seperation :- when a fluid is flow over a curved surface at very high speed, because of the friction between fluid and solid interface there is an adeverse presure gradient (ie. negative pressure gradient ) produce at tralling edge, due to this flow is seperatetd and the region of the -ve pressure called as wake region.
Von Karman vortex street :- when fluid is flowing around bluf bodya regular pattern of alternating swirling vortices is produces which is known as vortex shedding, which is responsible for the unsteady flow seperation.A vortex street will form only at a certain range of flow velocities, specified by a range of Reynolds number(Re), which is ratio of inertial force to viscous fource.
`Re=(rhoUL)/mu`
here, mu= 0.05
rho=1 kg/m^3
L=2m
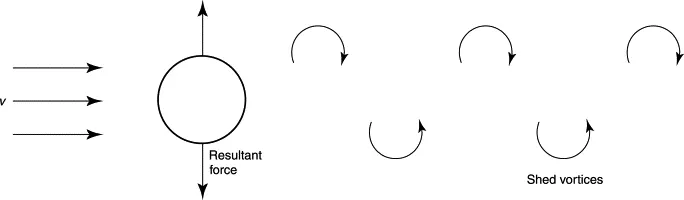
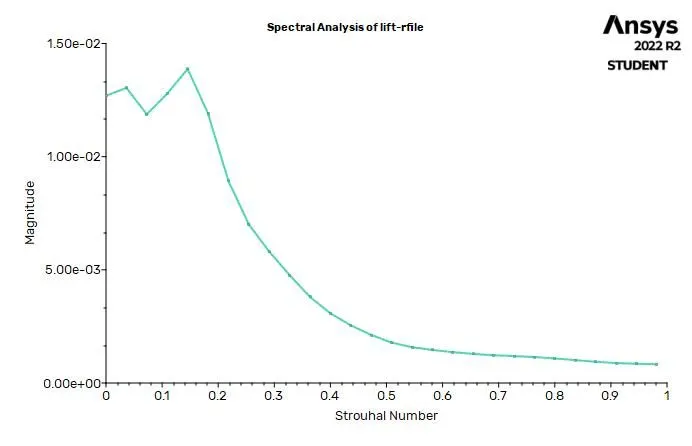
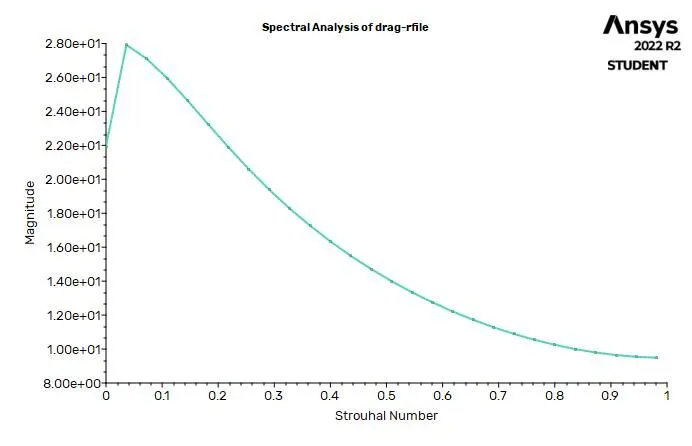
These vortices produce a sinusoidal force acting on the body perpendicular to the flow. For a cylinder, the frequency ω (in Hz) of the shedding is related to the diameter D(m) and wind speed v (ms−1) via the shrouhal number which is ratio of inertial force due to loca and convective acceleration
`S=omegaD/U`
If the frequency of the shed vortices is the same as one of the natural frequency of the structure, then large vibrations can result. Although it is possible for this loading to cause the structure to fail through the ultimate load being exceeded, failure is more likely to occur through fatigue.
The effect is exacerbated by an effect known as ‘lock-in’ where the vortex shedding frequency is forced to remain at the critical structural frequency at a range of speeds below and above the critical speed. The design of bridges, chimneys, submarine periscopes, etc. must take this phenomenon into account. Aerodynamic devices are used commonly nowadays to either ensure that the flow remains attached, or to break up the regular formation of the vortexes.
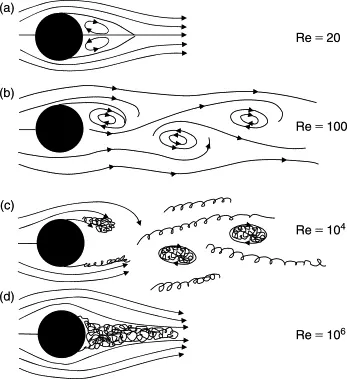
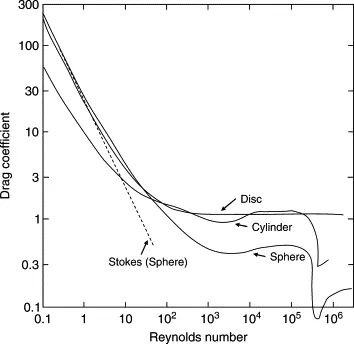
here the drag is varining with reynolds number is given in above graph referenc from link
https://www.sciencedirect.com/topics/physics-and-astronomy/karman-vortex-street
Procdeure in Ansys fluent
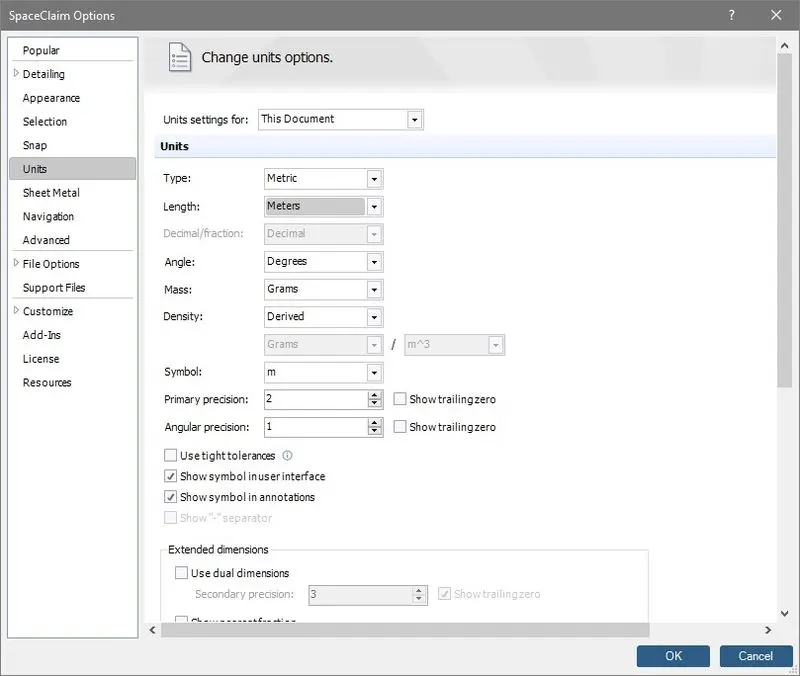
First load Ansys fluent module double click geomerty and open Ansys spacecalm now first change unit system to meter.
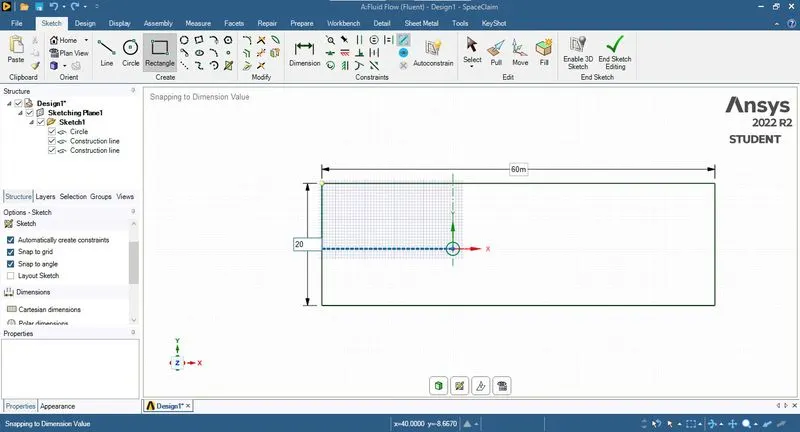
now ceate a circle of diameter 2 m in sketech plane xy, then crate construction line of 40 m in +ve x direction and 20 m in -ve x direction, then crate a line 10 m in y direction , now crate a rectangle of size 60 by 20 with help of these construction lines as shown in image, after that delete these construction line in model tree. now press pull the gomery and close spacecalm.
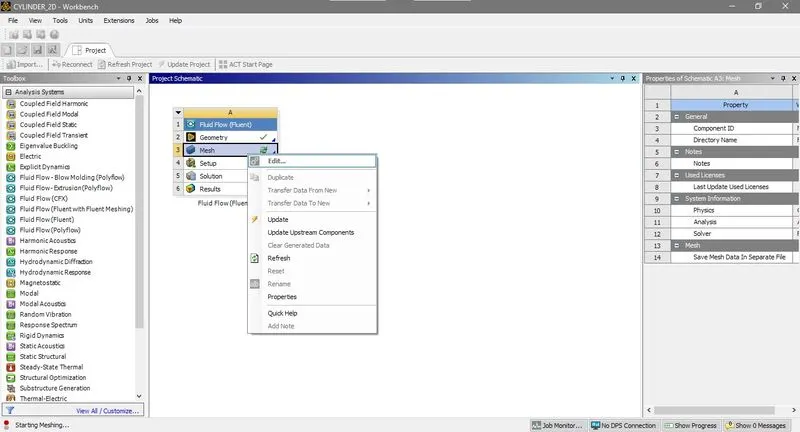
2) Now double click Mesh to open meshing module. now first generate mesh you can see elements are defult qurd.
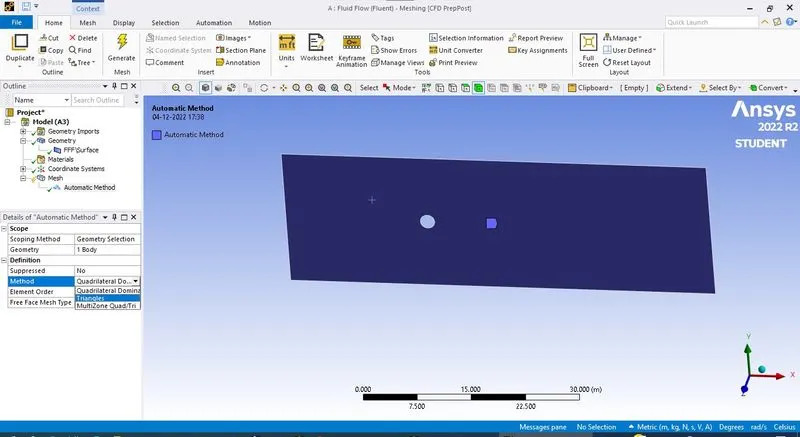
now Right click > insert > method now give the element size 0.5 m.
Right click > insert >Sizing on the edge selection select circle edge
number of division =100
now to capture boundary layer phonima we have to crate inflation layer by first layer meshod
first layer thickness is 5e-3
layers 15
growth factor 1.2
now crate boundary name as wall, input ,output and symmetry.
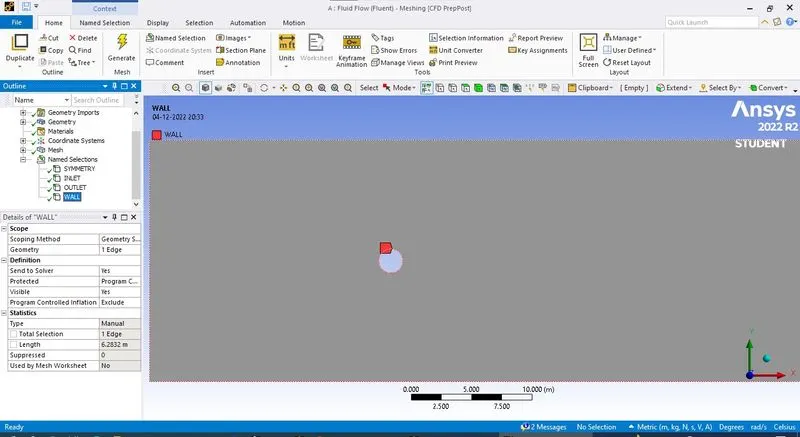
3). Setup
Now come to setup mode first crate new material having viscosity 0.05 kg/ms and density 1 kg/m3
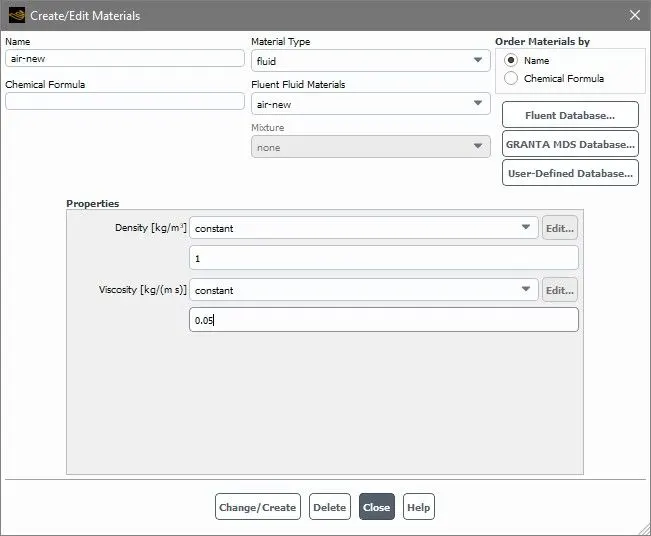
First go to fluient data-base and copy air as air-new and then cahnge it properties.and then go to cell zones select the volume edit and change materal to air-new then delete the privious defined material.
Boundaries conditions
Now come to boundarie edit Inlet and create it as input parameter for parametric study.
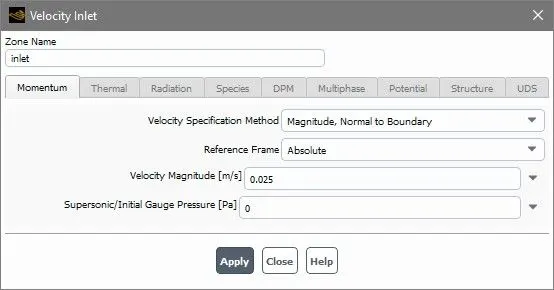
Outlet and wall
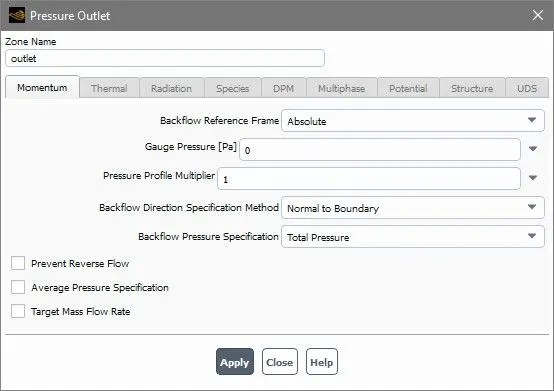
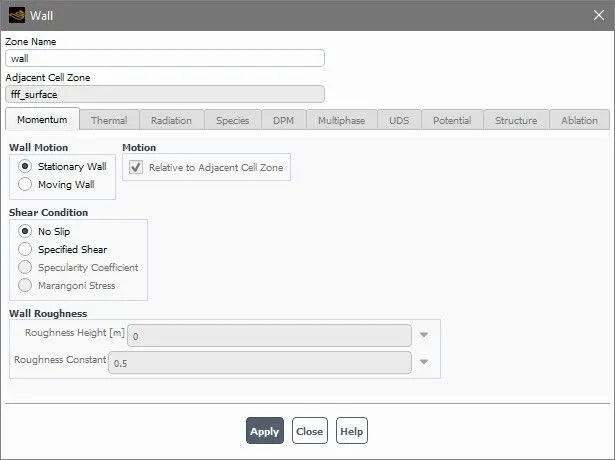
Analysis setup
Select steady state solution
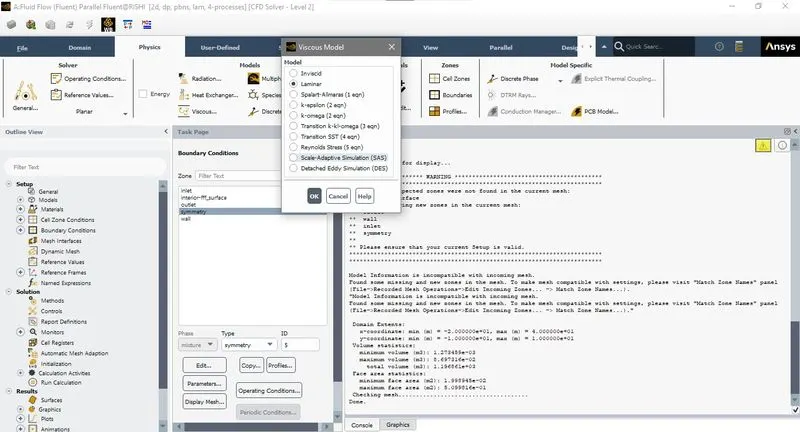
in viscous select laminar model
Output calculate
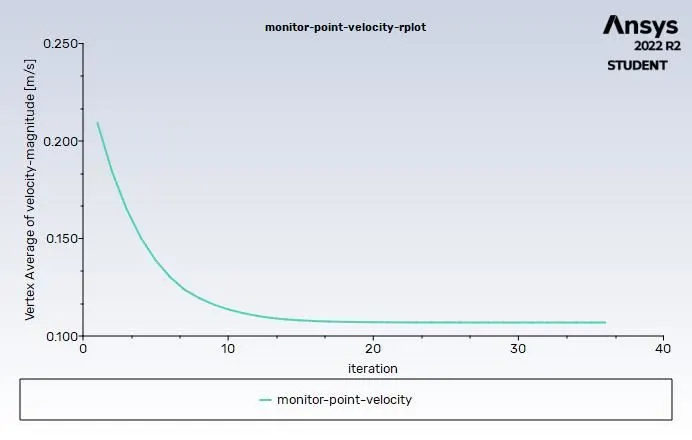
Vortex velocity
First creates monitor points at 4 times of diameter from center to +ve x direction
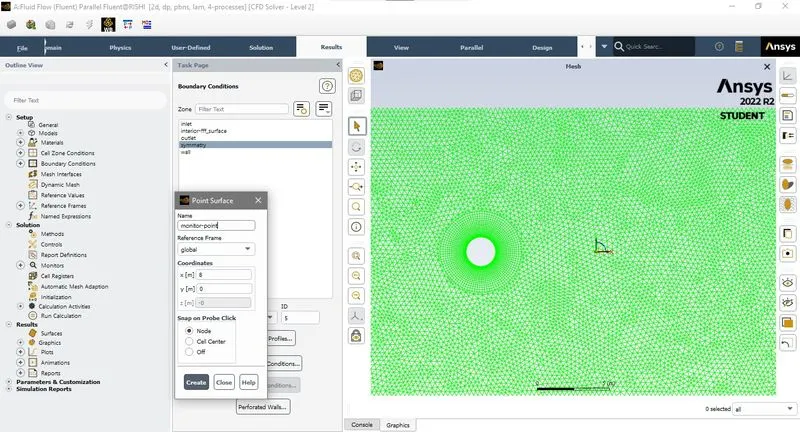
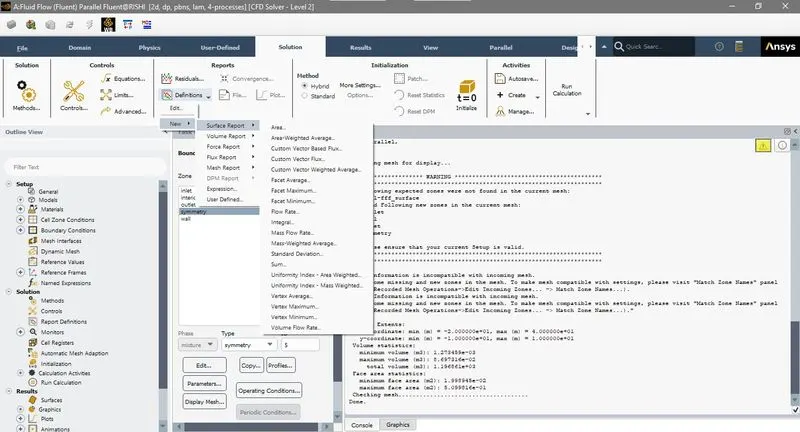
then go to solution>defination>surface report>vertex avg of velocity
Now create drag and lift forces
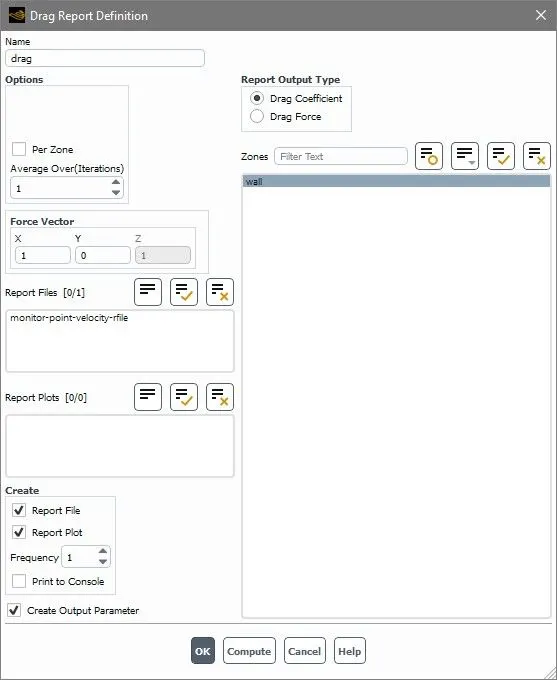
here check the creates output parameter for parametric study
In paramatric study we can diffrenciates our results for different input parameter
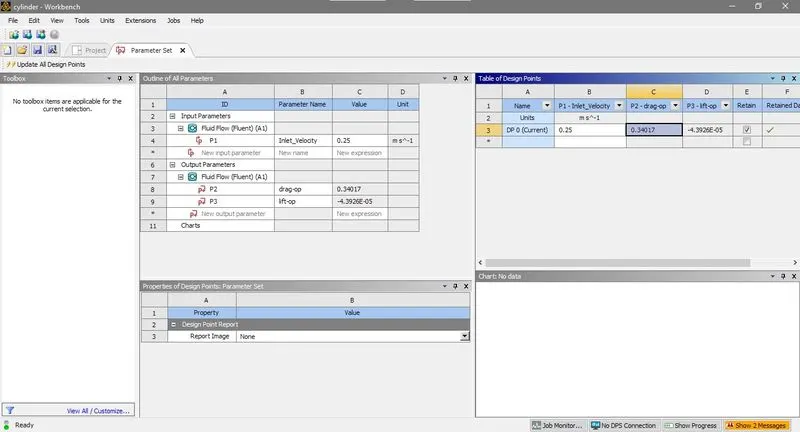
Referance check
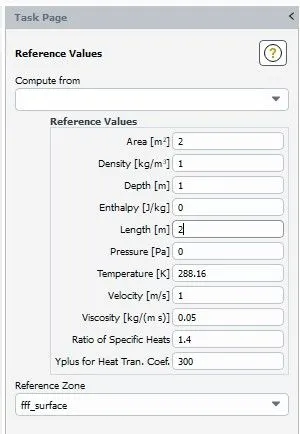
Now go to task page and change reference value
Now run the solution for steady state
Plot Result
Case1 Re=10
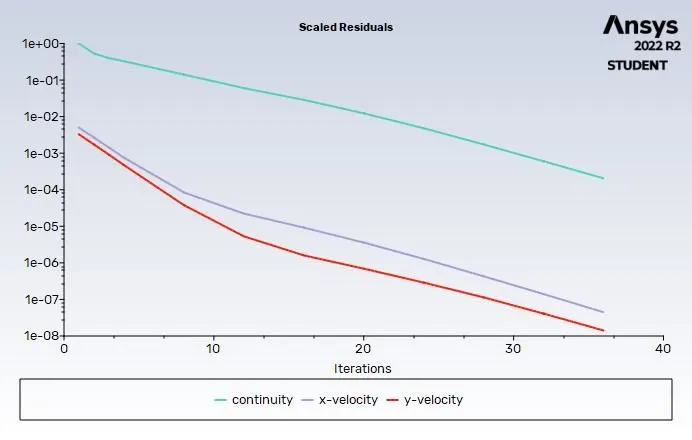
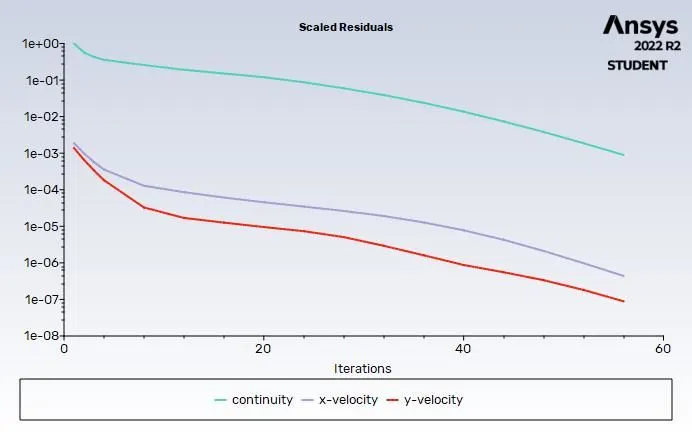
Residual plot
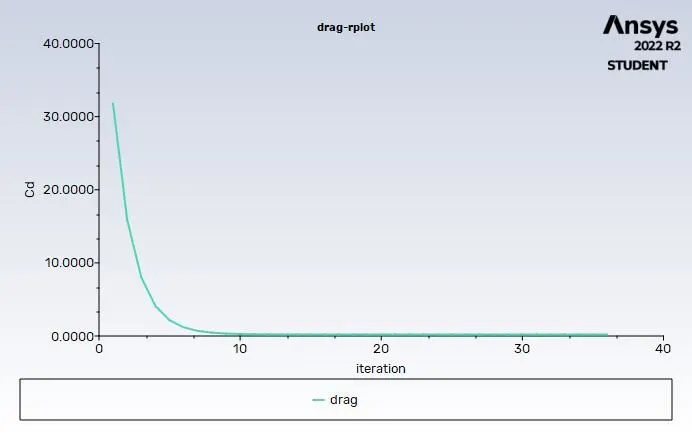
Drag coeffient vs Iteration and lift vs iteration
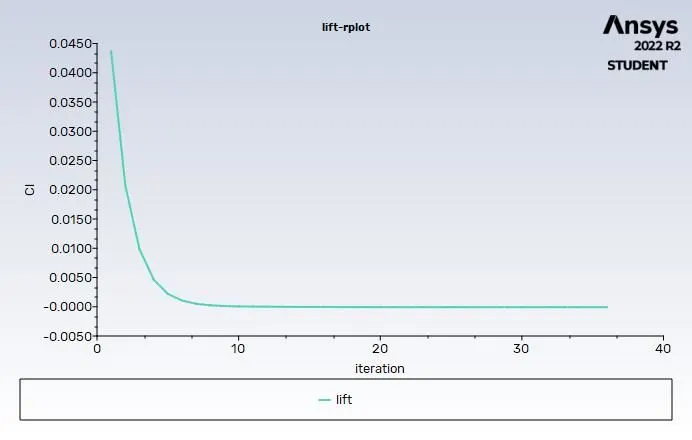
Velocit vs Iteration
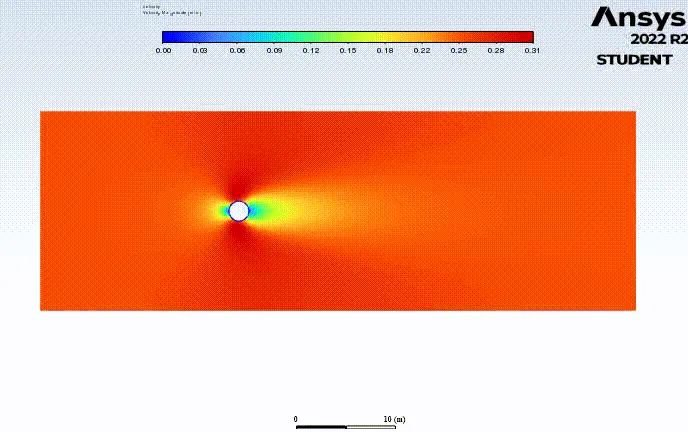
Velocity counture for Re=10
Case 2 Re=100
#Steady state solution
Residual
Drag coeffient vs Iteration and lift vs iteration
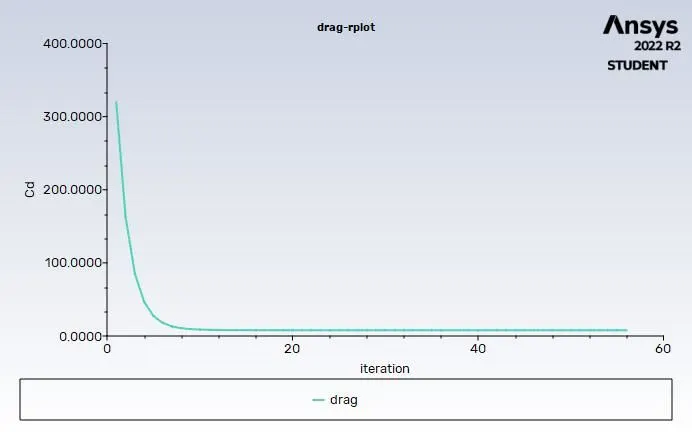
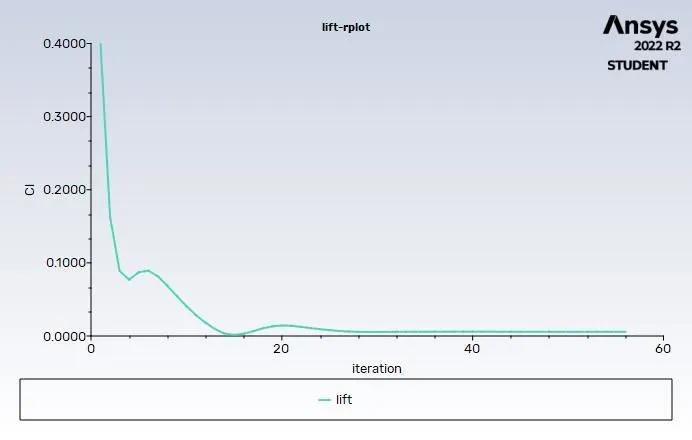
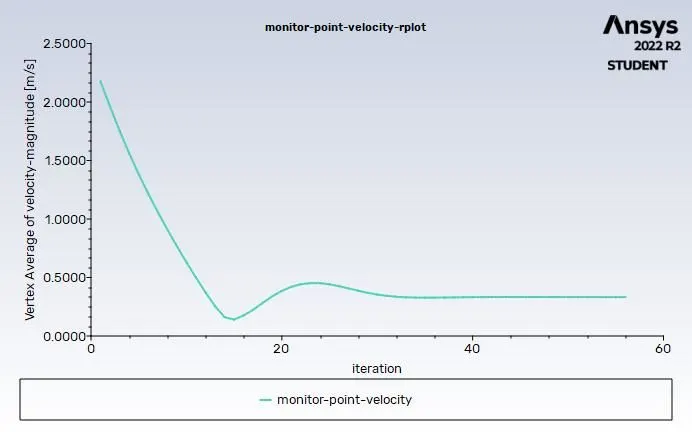
velocity plot
Velocity counture
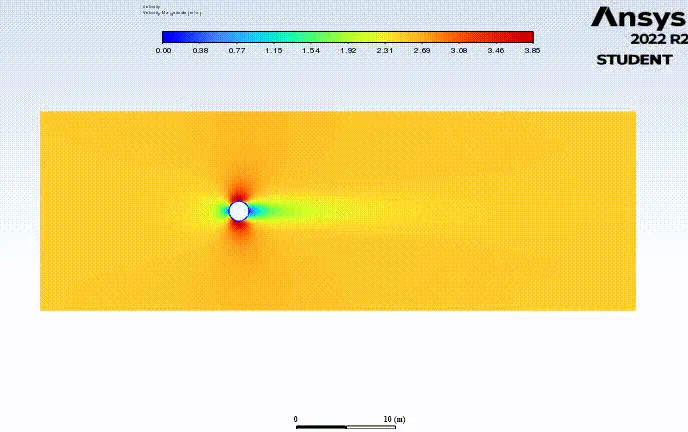
Now if we see the countour plot of velocity for case 2 (and other case also) steady state you may observed that velocity of fluid after it hits the cylider or point where flow sepertion is start (red colour zone in plot) which is higher then free streem velocity. This phenomina can be explain by Bernoullis principles
`P+1/2rhoV^2+rhogh=constant`
where P is static pressure
`1/2 rhoV^2` is Dyanmic pressure
and ρgh is Elevational pressure
Now here if we plot counture of Static,Dyanmic and Total pressure
#ststic pressure
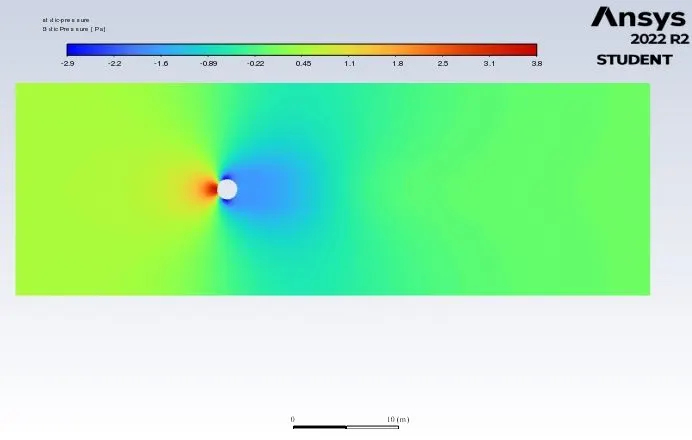
Static pressure after the fluid hit the body is -ve ' This is wake region'
#Total pressure
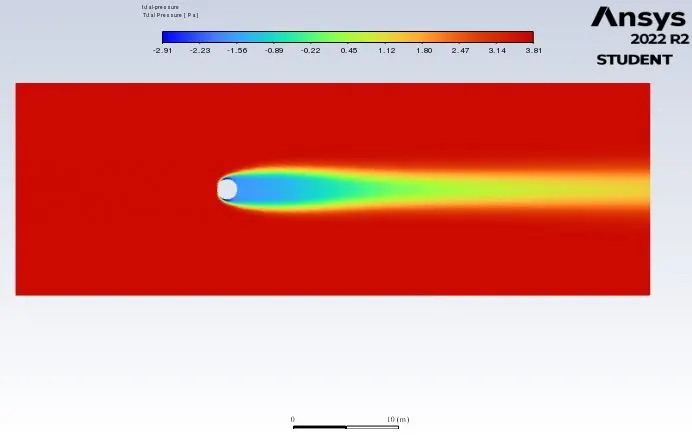
In total pressure countor plot we can observed total pressure at inlet and outlet are same.
#Dyanamic pressure
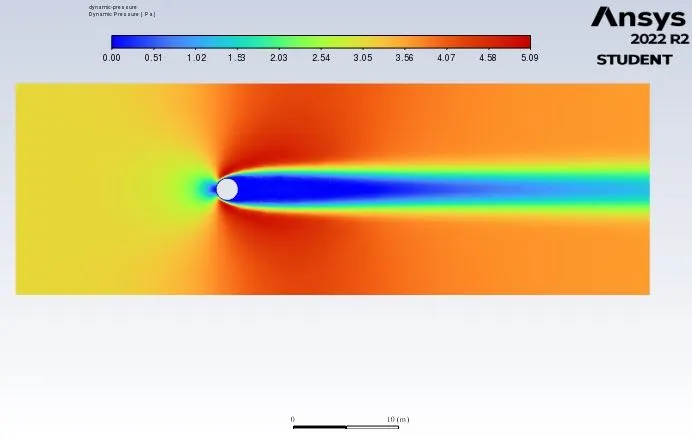
Now you can see dynamic pressure after hit is more.
so we can say that from start to end of sepration staic pressure is convert to dynamic pressure and total pressure is balancing.
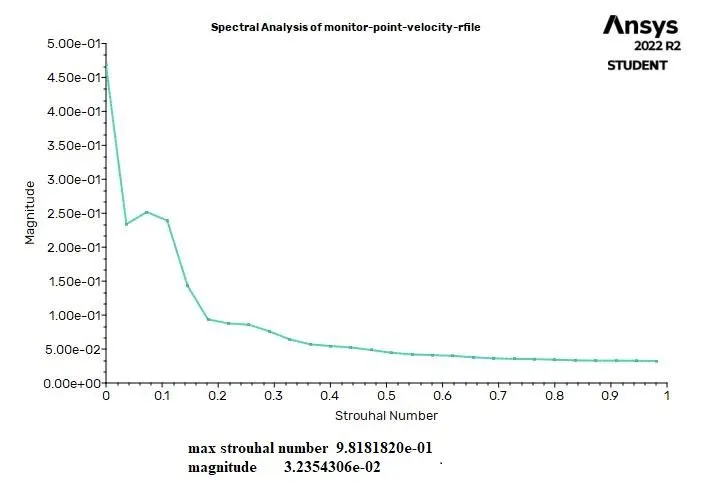
# Strouhal Number
#Transient analysis
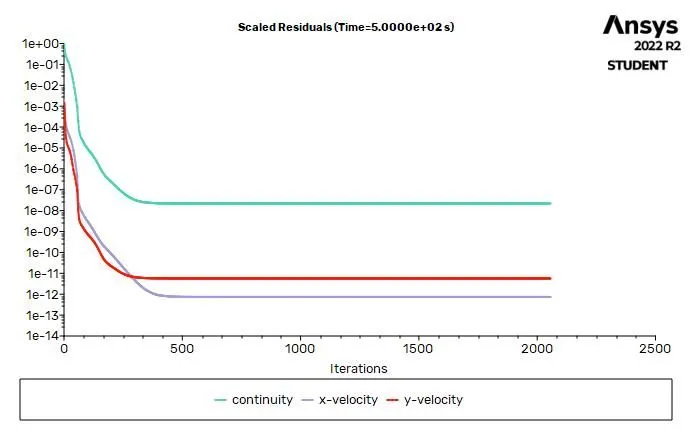
Residuals
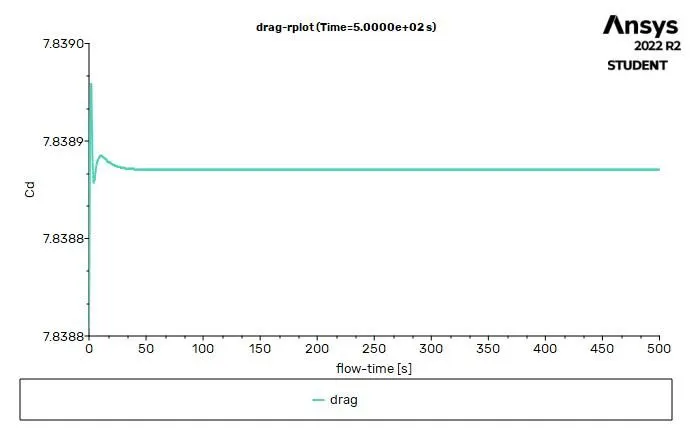
Drag and lift coeficents
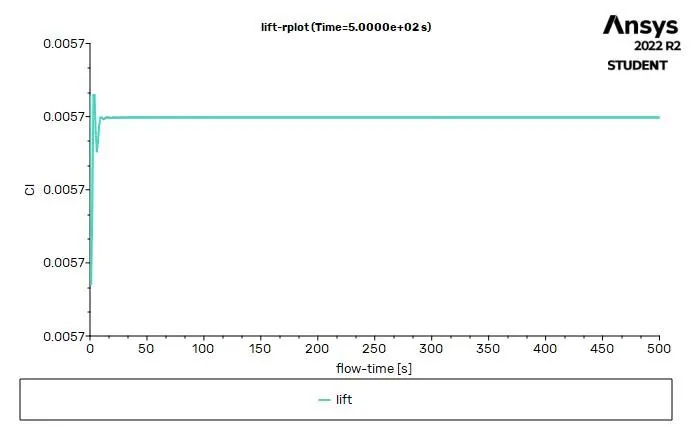
Velocity at monitor point
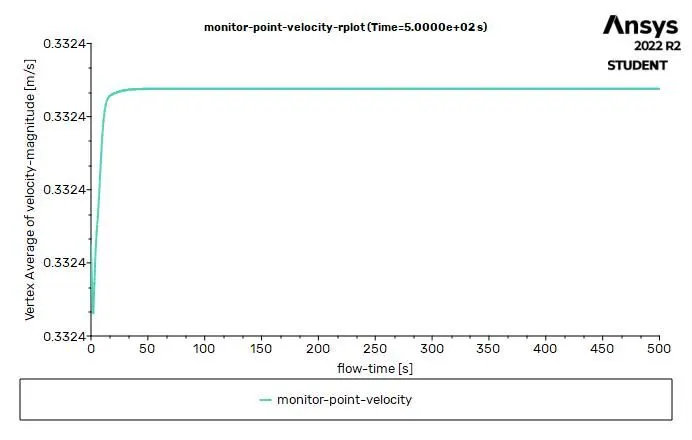
Case 3
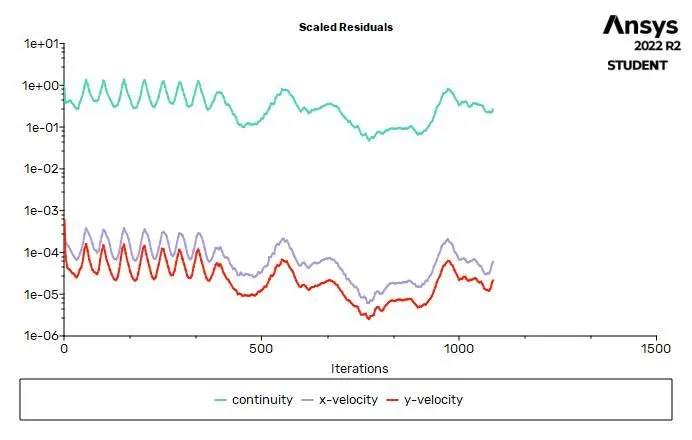
Re =1000 (steady state)
Residuals
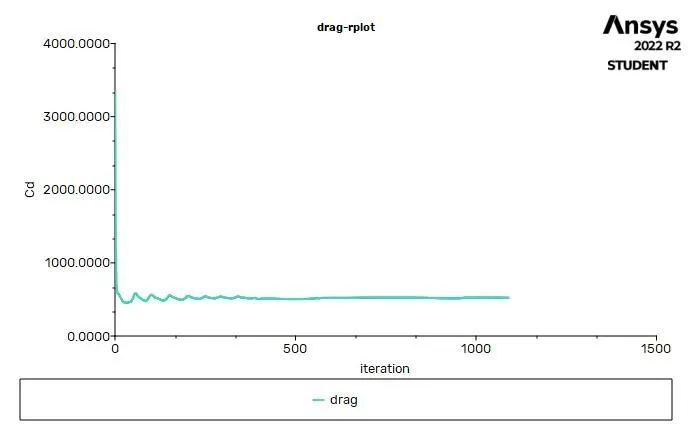
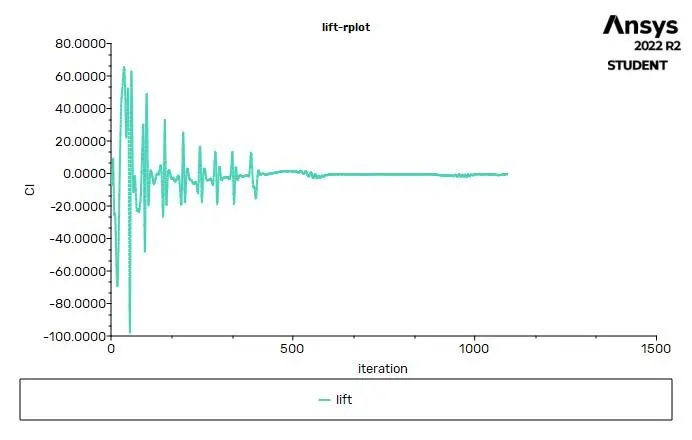
Drag and lift coefficent
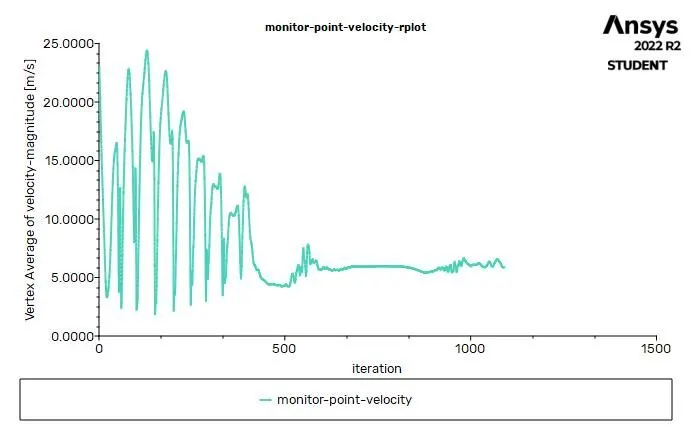
Velocity
Case 4
Re =10000 (steady state)
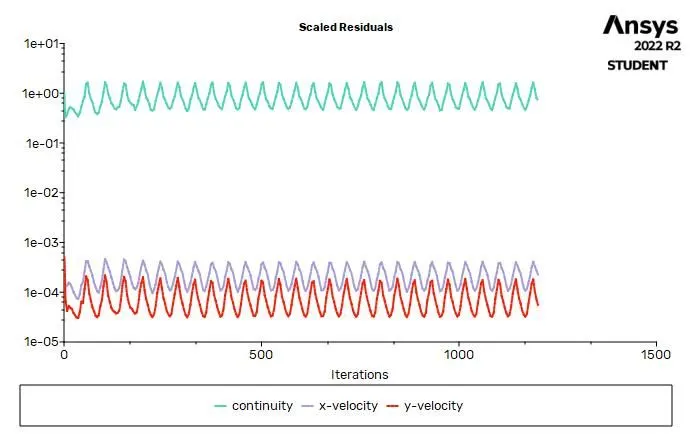
Residuals
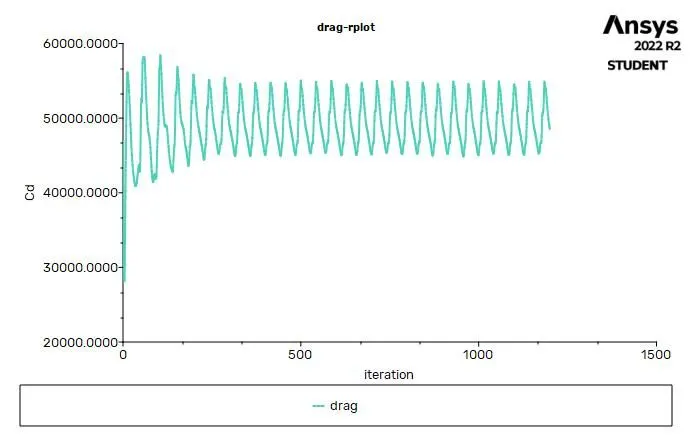
Drag and lift coefficent
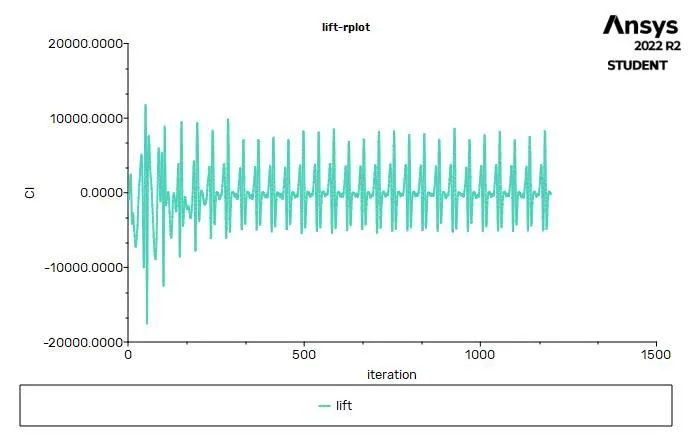
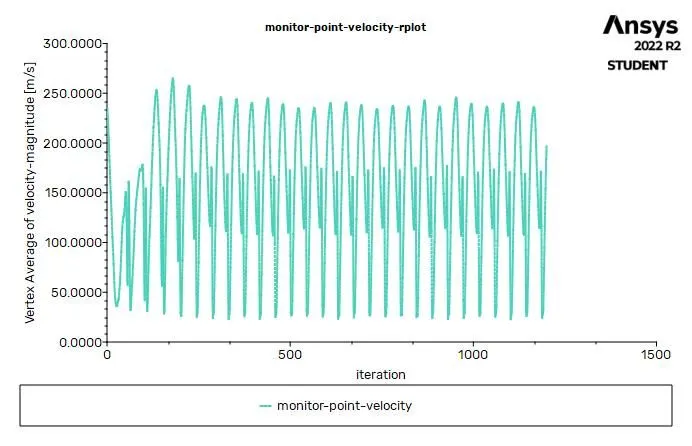
Vleocity
Case 5
Re =100000 (steady state)
Residuals
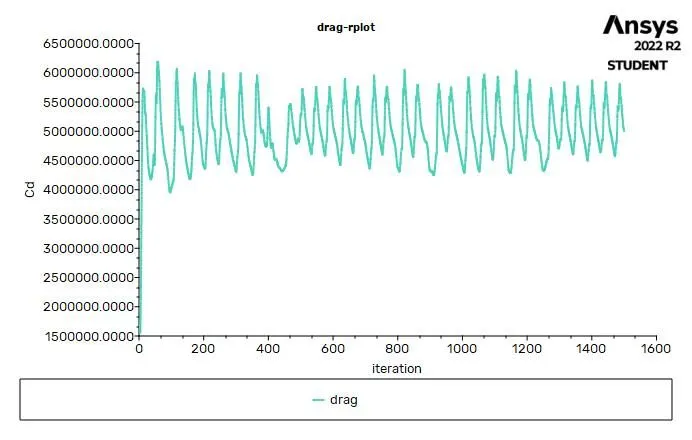
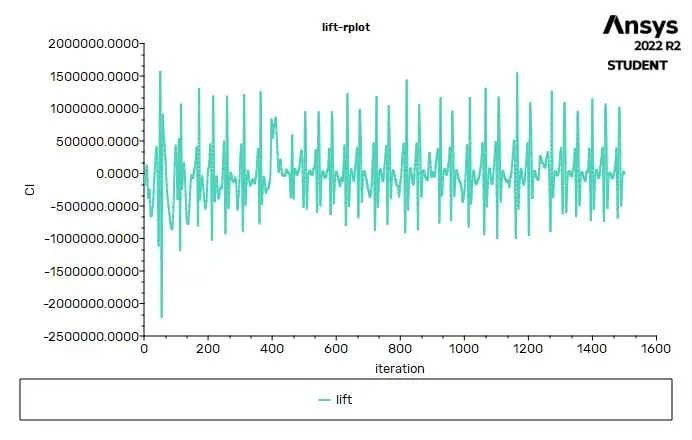
Drag and lift coefficent
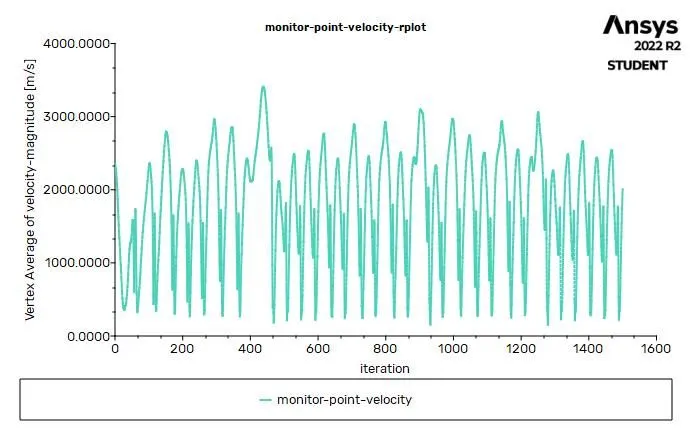
Velocity
Conclusion
- With increase in Re number of iterration to converage solution also increase.
- For higher Re fluction in drag and lift is high.
- for higher Re fluction in vortex velocity is also high.
- Vortex shading is more in higher Re model.
- Vortex shading occures in both steady state and transient anlysis.
- Strouhal Number calculation for case2 (Re=100) of transient simulations as the frequency changes with respect to time.