Week 2 - Flow over a Cylinder.
Aim - Simulate the flow with the steady and unsteady case and calculate the Strouhal Number for Re= 100.
Reynolds Number (Re):
Reynolds number for a flow is a measure of the ratio of inertial to viscous forces in the flow of a fluid around a body.
Re = rho*V*d/Dynamic Viscosity
The range of Re values will vary with the size and shape of the body from which the eddies are being shed, as well as with the kinematic viscosity of the fluid. Over a large Red range (47<Red<105 for circular cylinders; reference length is d: diameter of the circular cylinder) eddies are shed continuously from each side of the circle boundary, forming rows of vortices in its wake. The alternation leads to the core of a vortex in one row being opposite the point midway between two vortex cores in the other row, giving rise to the distinctive pattern shown in the picture. Ultimately, the energy of the vortices is consumed by viscosity as they move further downstream, and the regular pattern disappears.
Strouhal number (St):
Strouhal number is a dimensionless number describing oscillating flow mechanisms.
The Strouhal number is often given as
St = f*d/u
Where,
f is the frequency of vortex shading,
d is the characteristic length and
u is the flow velocity.
Procedure
Geometry:
A plate with the dimension of 20*60m is created using spaceclaim.
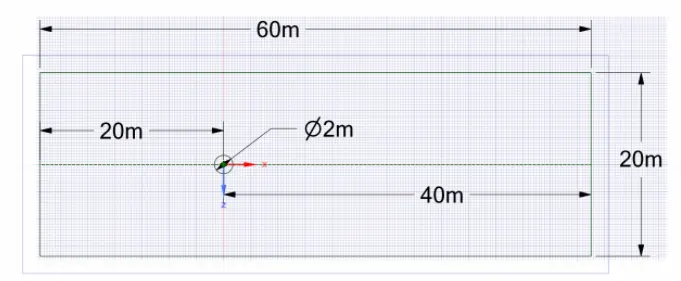
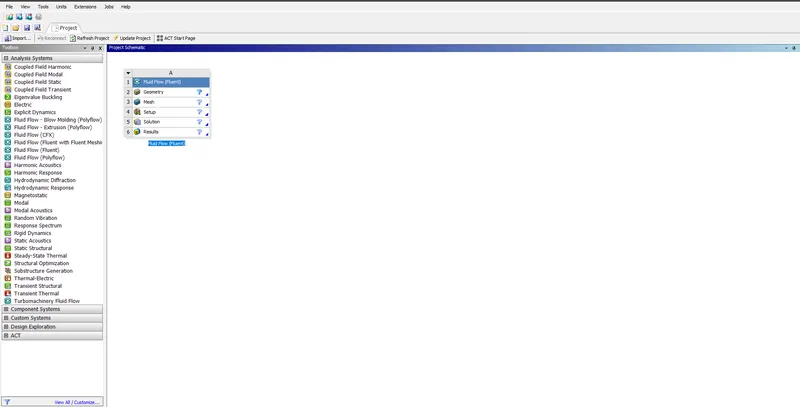
Now create the geometry by using tools in ansys space claim
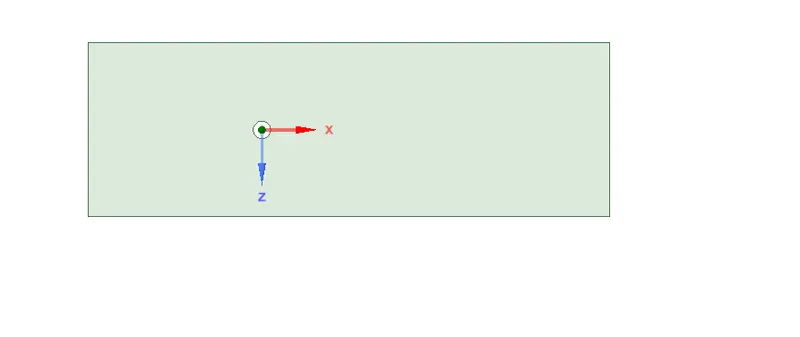
Meshing:
1.select the edges of geometry and named them as inlet,outlet ,wall and symmetry.
2.Now select the body and go to mesh and click on generate mesh with mesh size 0.25 m.To ensure triangular mesh, go to mesh > insert > select triangular mesh type.
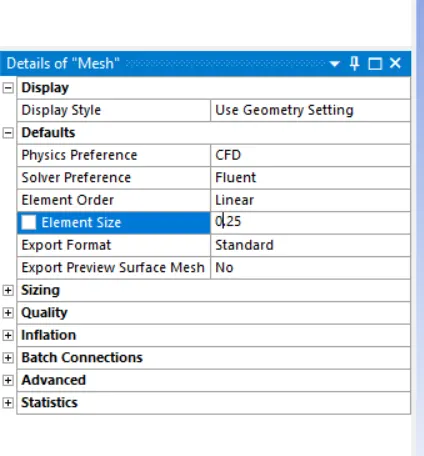
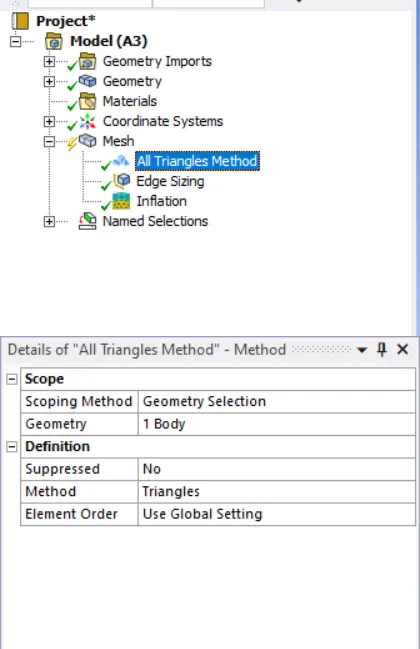
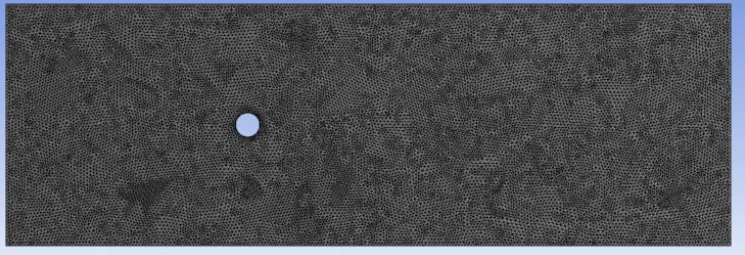
3.After generating mesh,it is seen that size of cirle looks distoreted.
go to mesh > sizing > select circular edge > deffinition >type > no,of divisions >36.
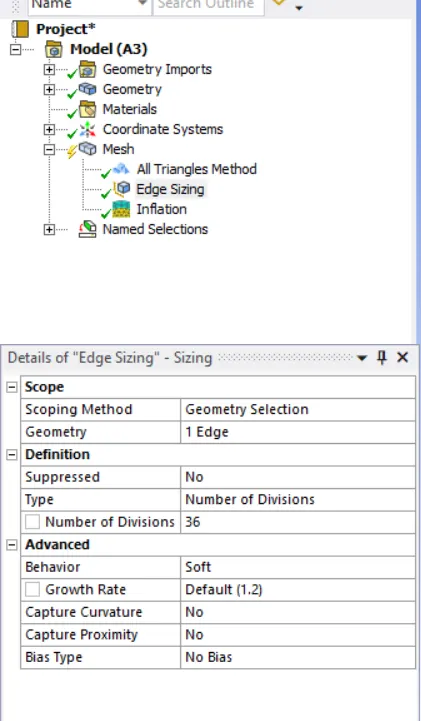
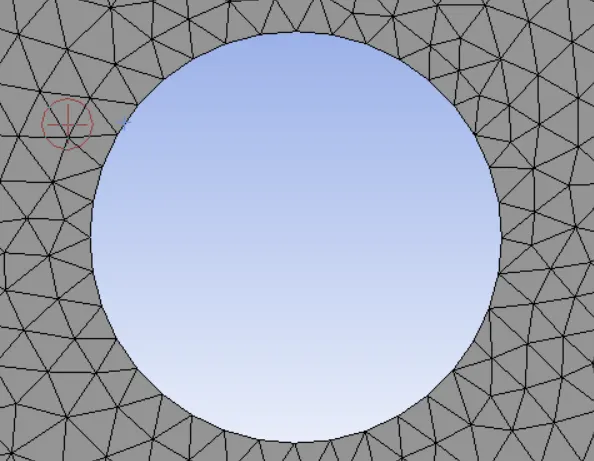
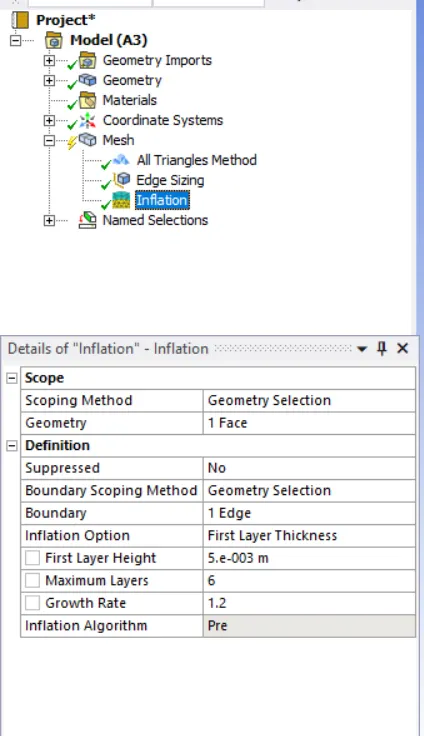
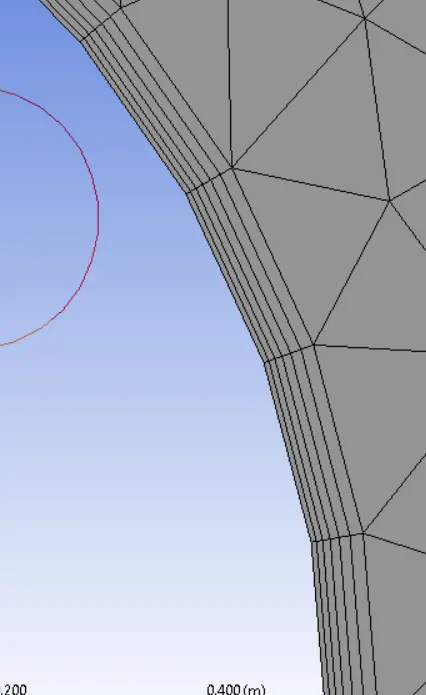
4.To capture better results near cylinder wall, go to mesh > inflation > select the body and edge > inflation option : 1st layer thickness >1 st layer height :5e-3 m >maximum layer :6
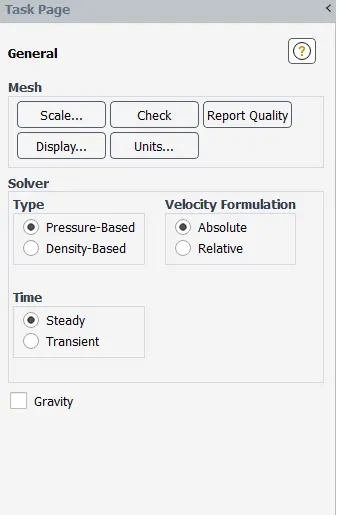
Now Exit mesh and open setup. First, Check mesh, it is throwing no error then only we can proceed further. We are going to do pressure based steady state simulation, so choose these options on task page.
Solving :
1. select laminar flow inside the viscous model.
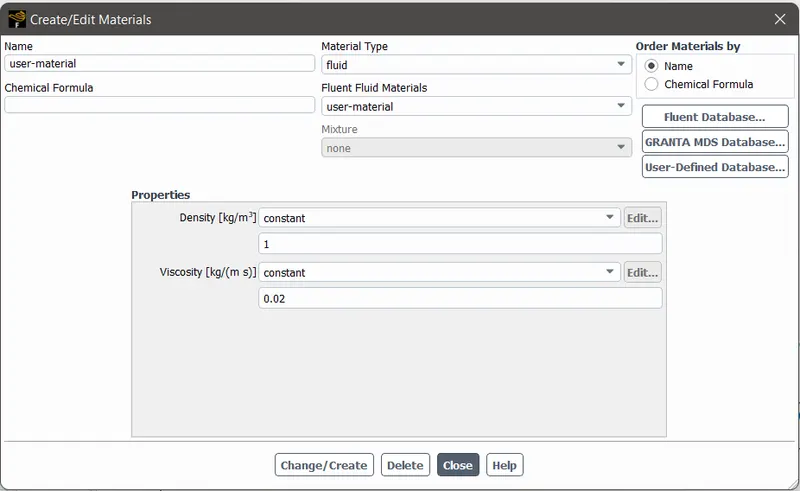
2.As we wanted to customimize material property for simulation, go to materials > fluent database > select the material (air) > copy it> rename the name of material.
Boundary Condition:
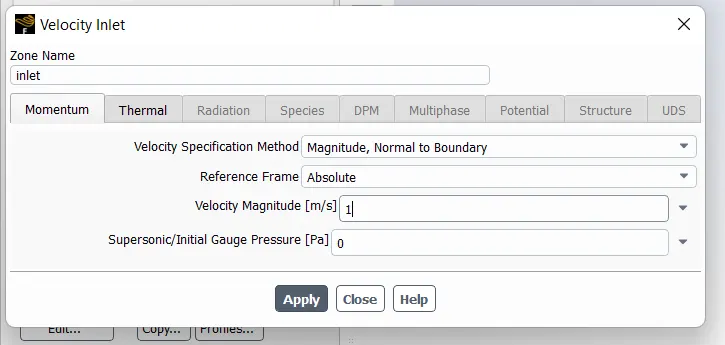
Outlet : gauge pressure = 0 Pa.
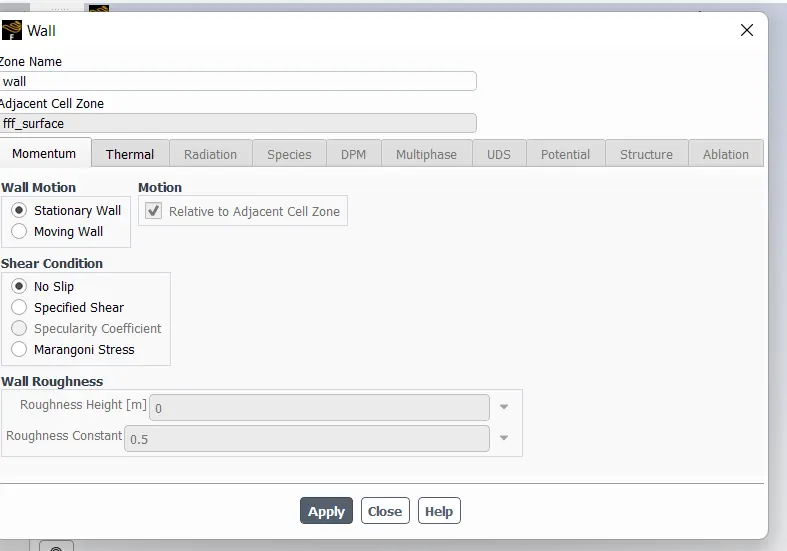
wall : no slip condition.
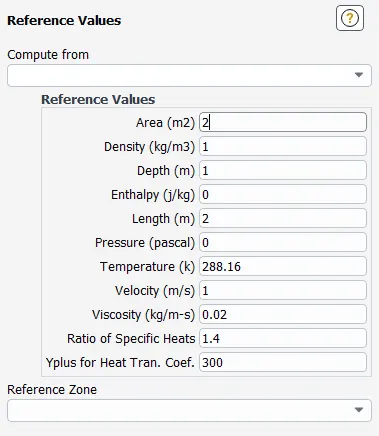
Refference values:
Steady state simulation:
1.Reynolds number = 10.
velocity = 1 m/s.
density = 1 kg/m3.
viscosity = 0.02 Pa-s.
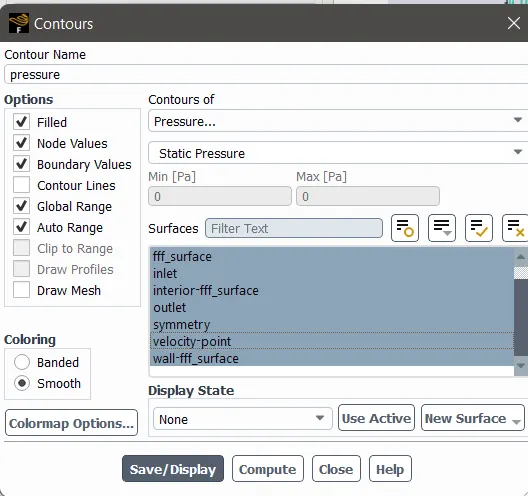
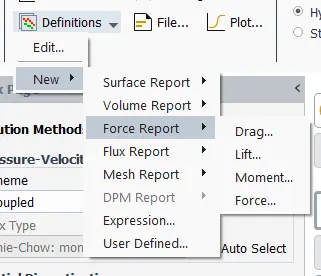
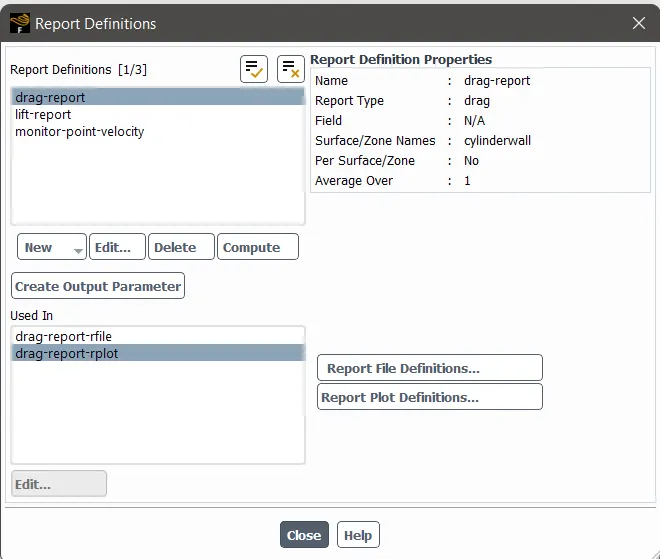
created reports are
luent details/procedure:
a. laminar model
b. fluid: Air
c. Method of discretization: Simple
d. Density/kinematic viscosity: 1/0.02
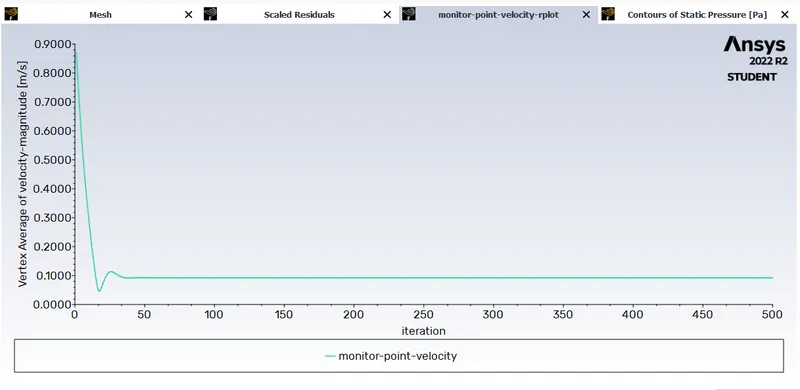
e. Creating a monitor point behind the cylinder by selecting point under surfaces in the results bar.
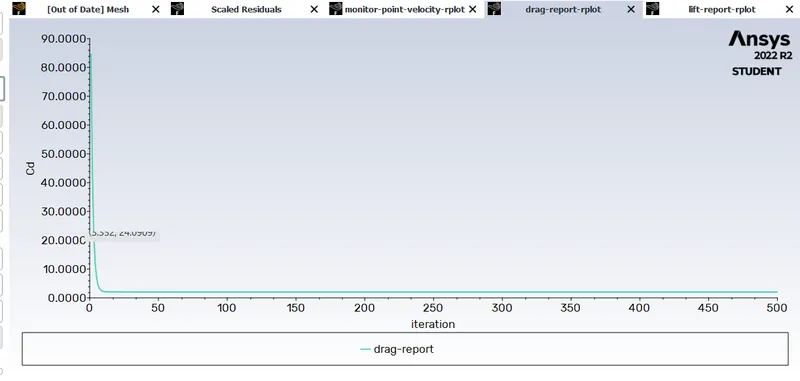
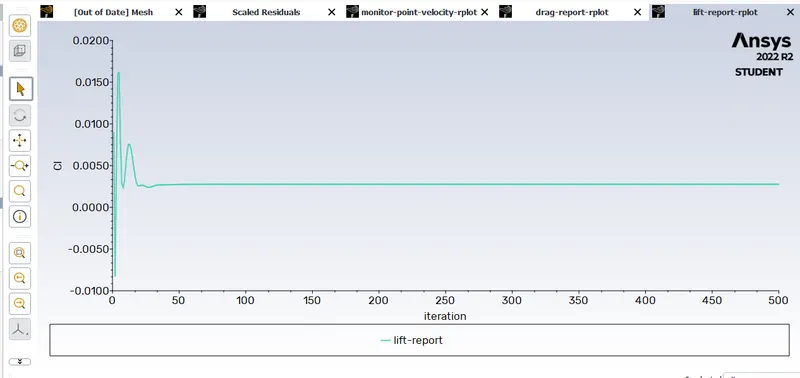
f. After creating the monitor point, create reports/plots for drag, lift, velocity wrt cylinder.
g. Create plots for the velocity at the monitor point to analyze the vortex shedding.
h. Use hybrid initialization for steady-state and standard for transient state simulations.
(i) Simulate the flow with the steady case and calculate the Strouhal number for Re=100 and velocity 2.5m/s.
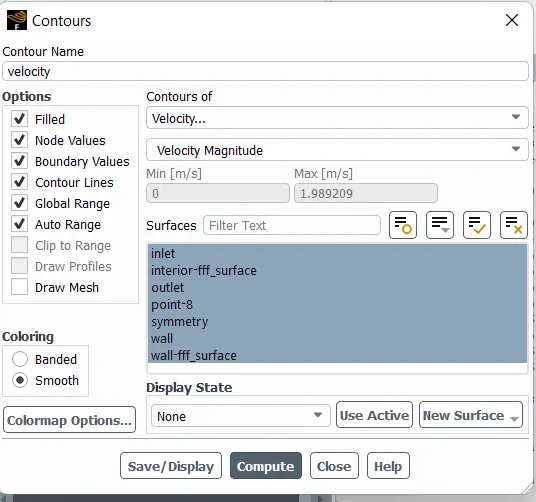
- Velocity and pressure contours
Residual plot:
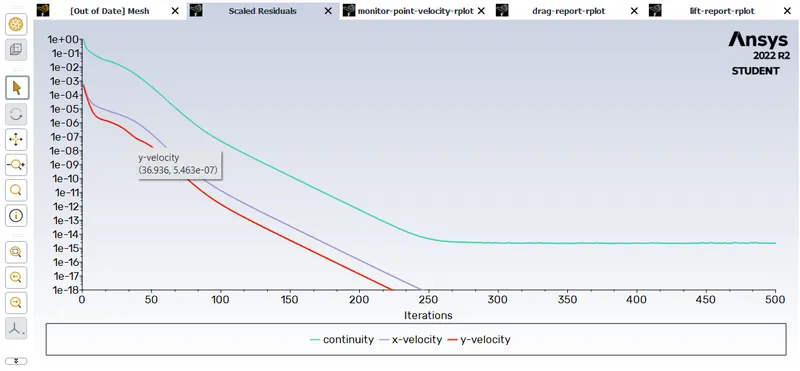
Monitor point velocity:
Coefficient of drag:
Lift Coefficient:
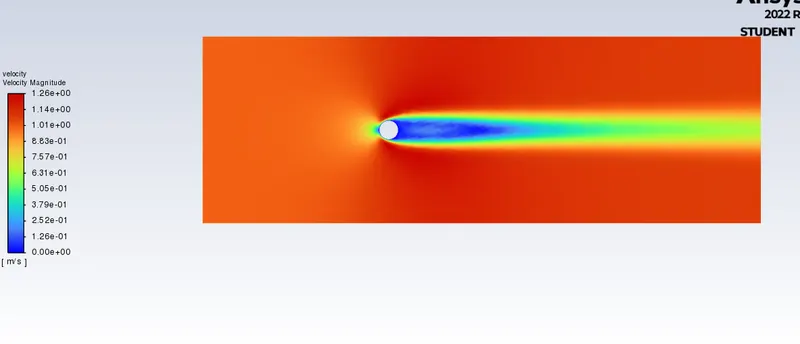
Velocity contour:
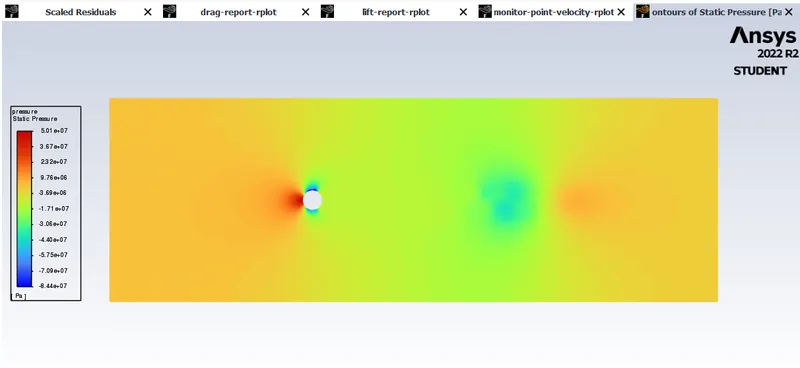
Pressure contour:
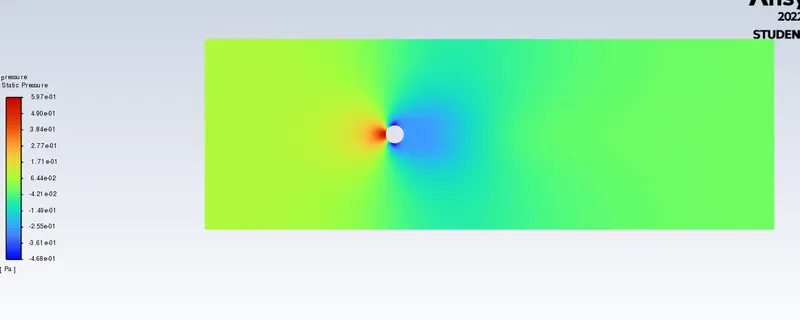
2.Reynolds number = 100.
velocity = 10 m/s.
density = 1 kg/m3.
viscosity = 0.02 Pa-s.
Residual plot:
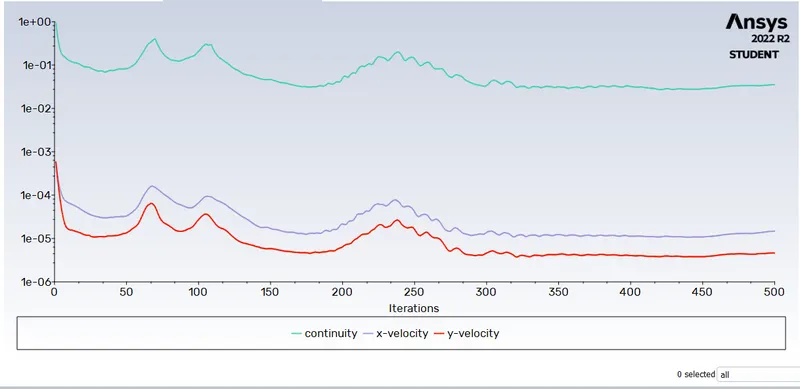
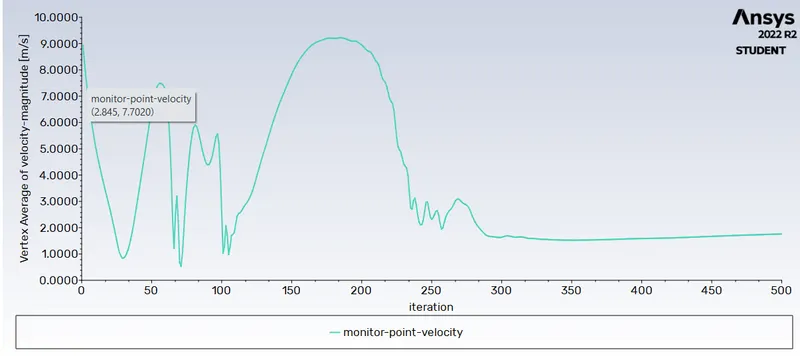
Monitor point velocity:
monitor point: A point is created at 8 m in x direction from the axis of cylinder to check velocity.
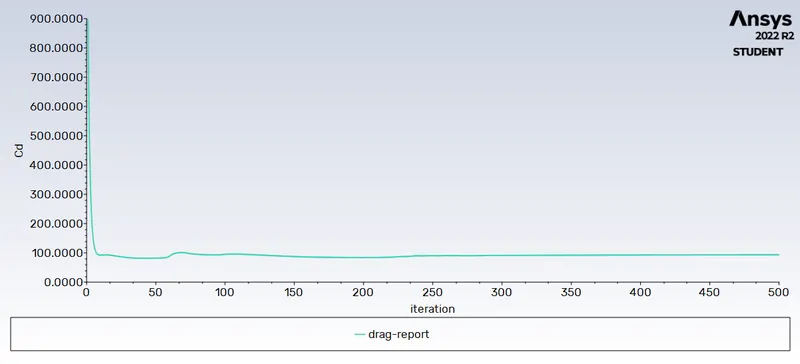
Coefficient of drag:
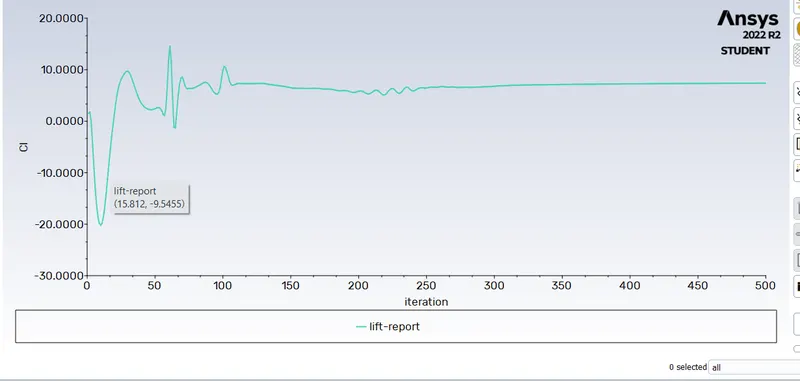
Lift Coefficient:
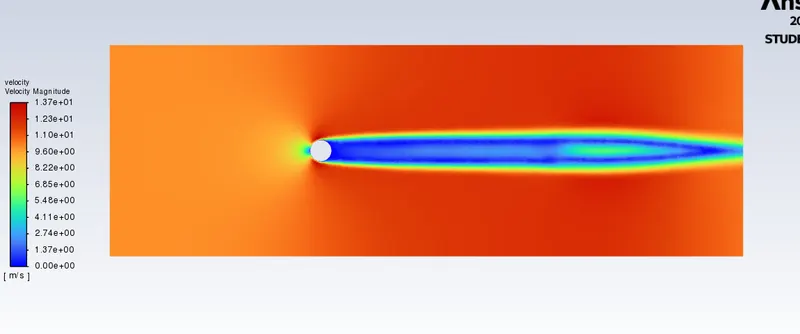
Velocity contour:
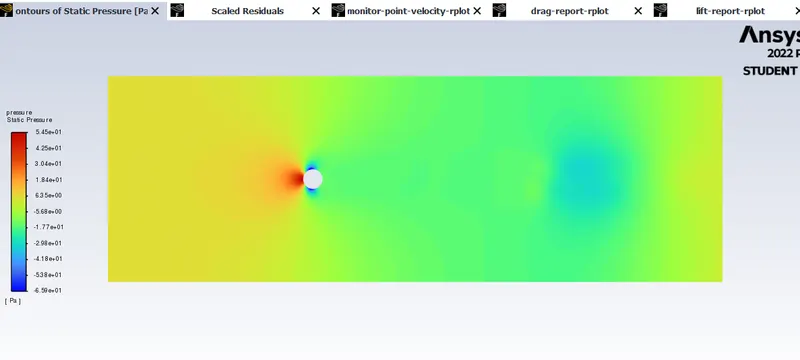
Pressure contour:
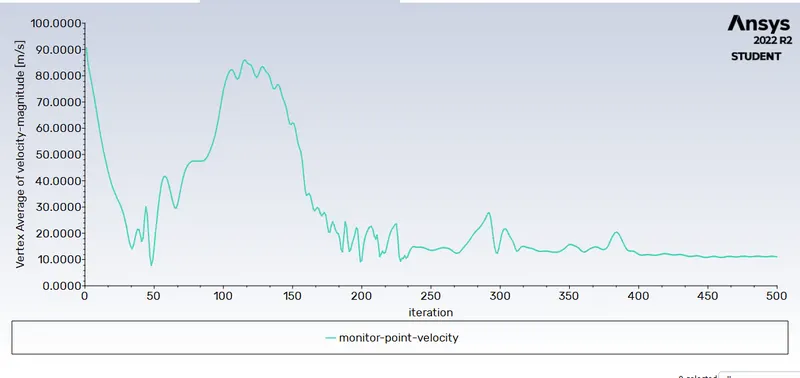
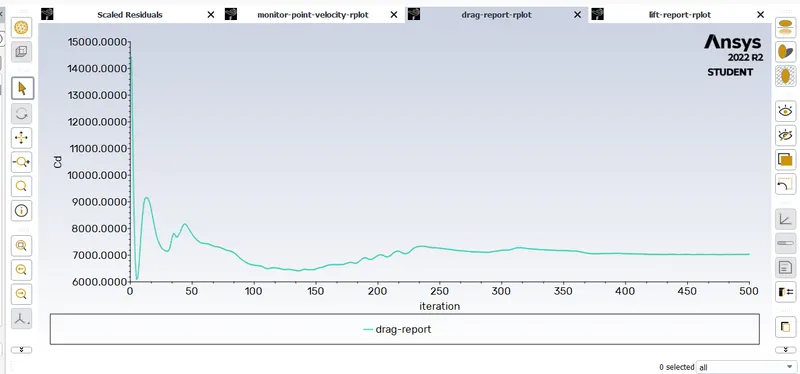
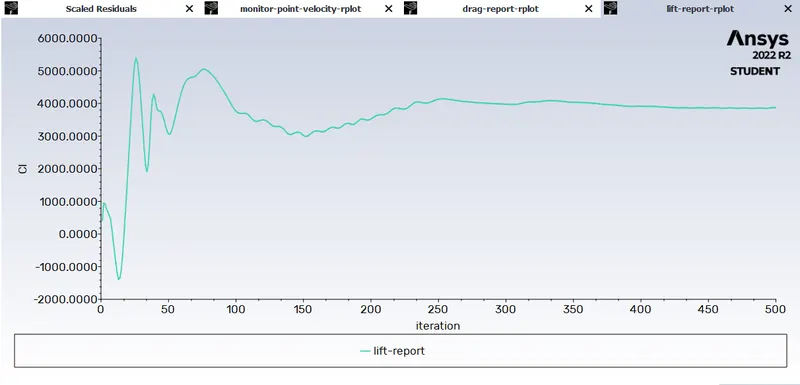
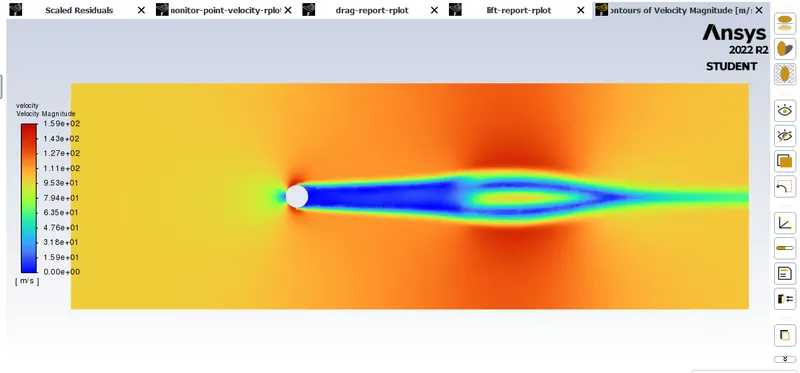
3.Reynolds number = 1000.
velocity = 100 m/s.
density = 1 kg/m3.
viscosity = 0.02 Pa-s.
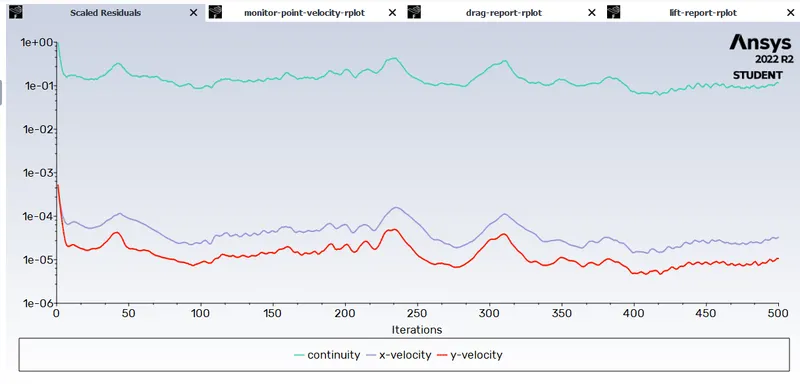
Residual plot:
Monitor point velocity:
Coefficient of drag:
Lift Coefficient:
Velocity contour:
Pressure contour:
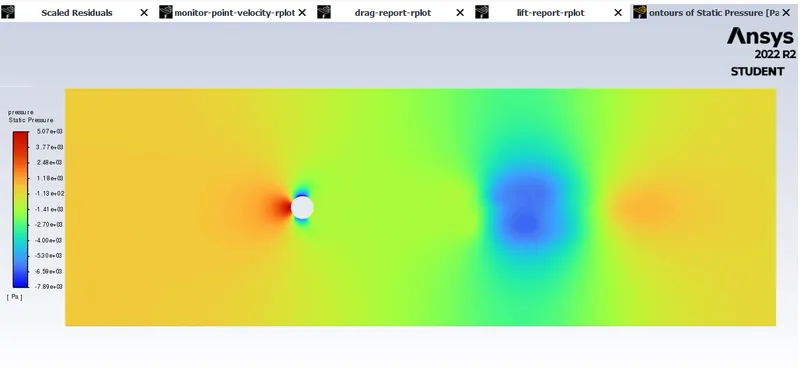
4.Reynolds number = 10000.
velocity = 1000 m/s.
density = 1 kg/m3.
viscosity = 0.02 Pa-s.
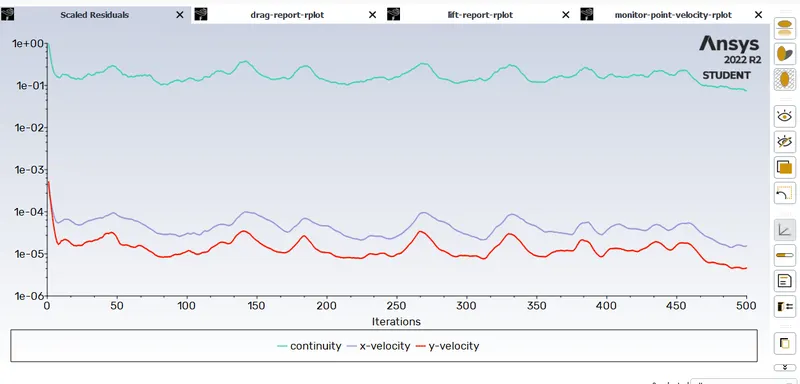
Residual plot:
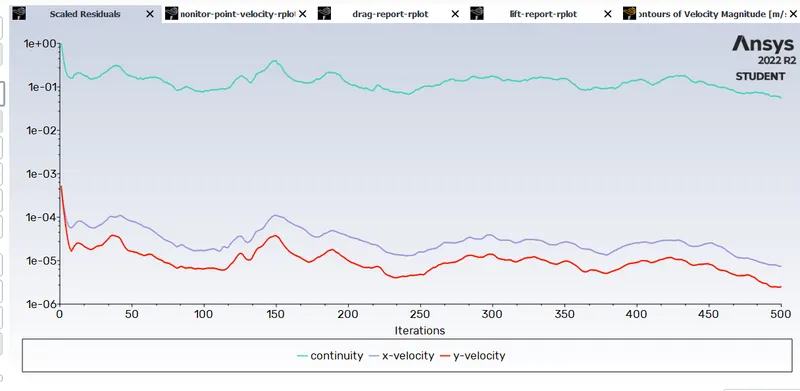
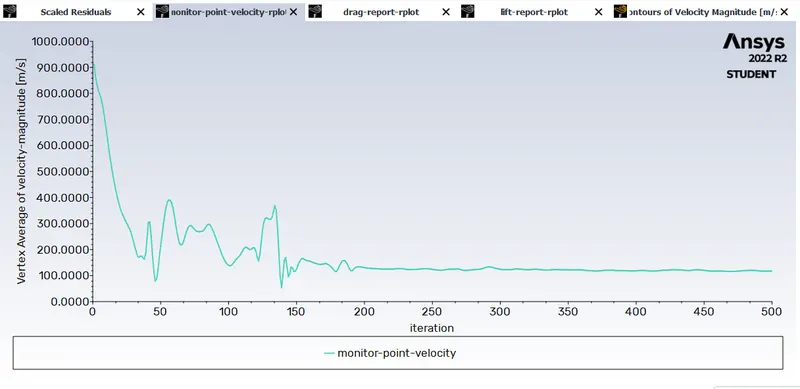
Monitor point velocity:
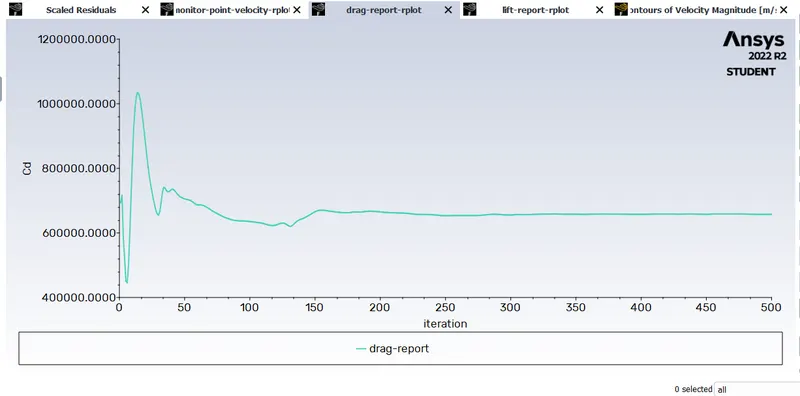
Coefficient of drag:
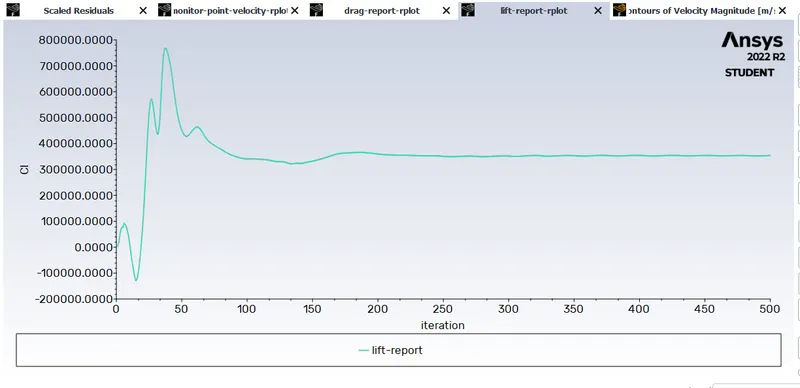
Lift Coefficient:
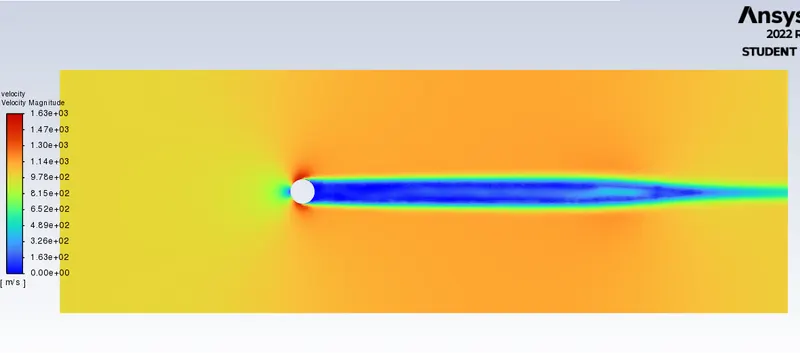
Velocity contour:
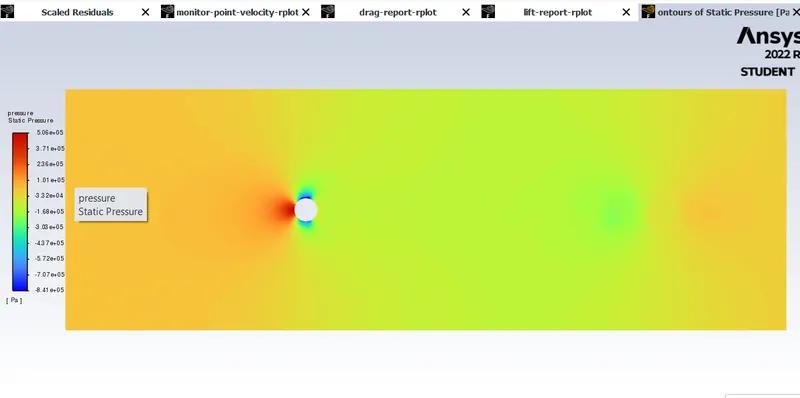
Pressure contour:
5.Reynolds number = 100000.
velocity = 10000 m/s.
density = 1 kg/m3.
viscosity = 0.02 Pa-s.
Residual plot:
Monitor point velocity:
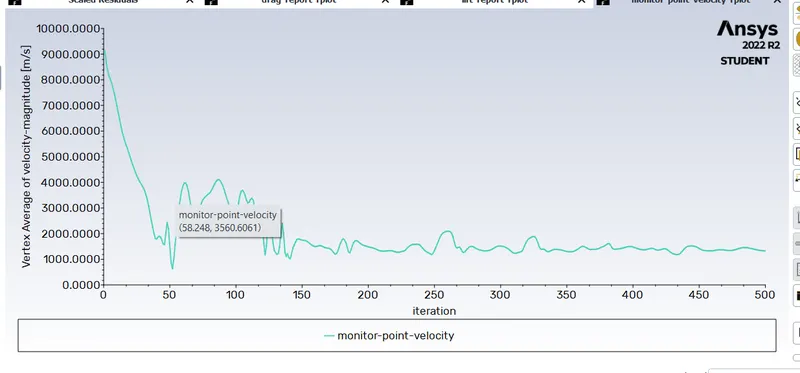
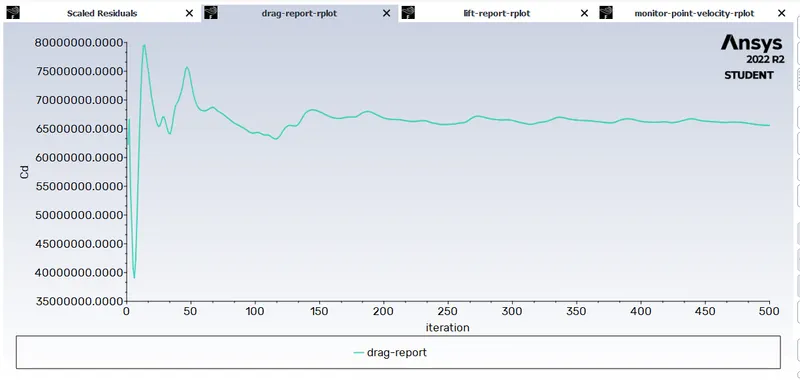
Coefficient of drag:
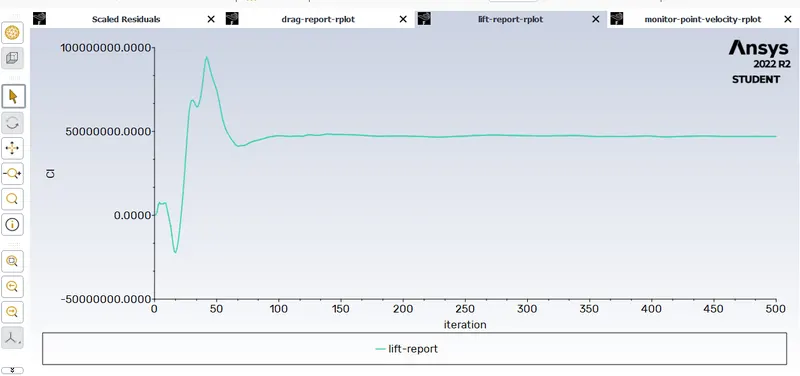
Lift Coefficient:
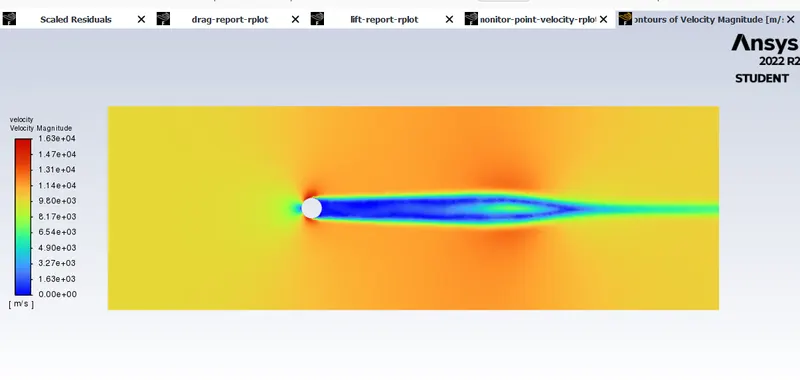
Velocity contour:
Pressure contour:
Strouhal number:
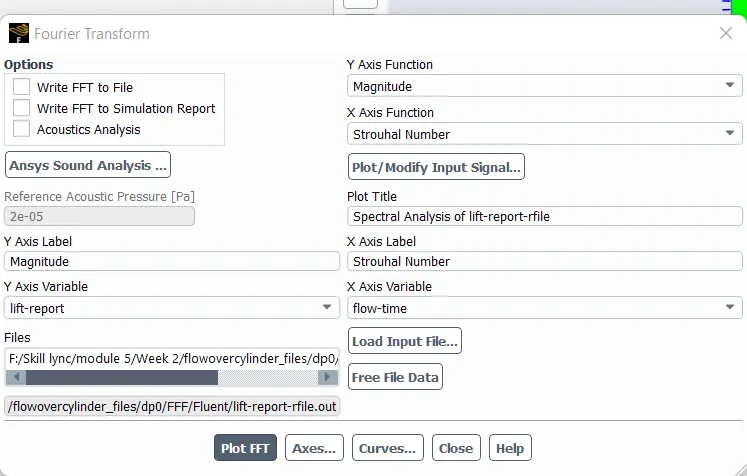
The FFT plot has been used to plot Strouhal Number. The lift coefficient data has been given as an input. The magniture option has been selected from drop down menu for Y-axis & Strouhal number for x-axis. The strouhal number plot has been displayed with the results images of each simulation.
Conclusion:
1.When fluid flows over cylinder, wake region is formed next to cylinder due to decrease in pressure and recirculation of flow occures and hence flow separation occures.
2.As flow over cylinder is being transient meaning time dependent phenomenon, we are unable to observe flow separation at low reynolds no.(say 50).
3.In this assignment we have kept all parameters constant and have only varried velocity to change reynolds number. So as the reynolds no. increases coefficient of drag decreases.however after reynolds no. = 4000, flow is turbulent and hence coefficient of drag is lower.