Week 2 - Flow over a Cylinder.
introduction
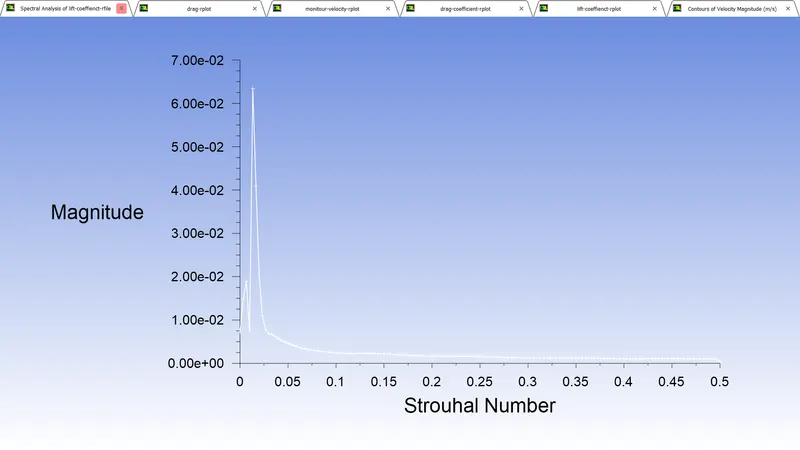
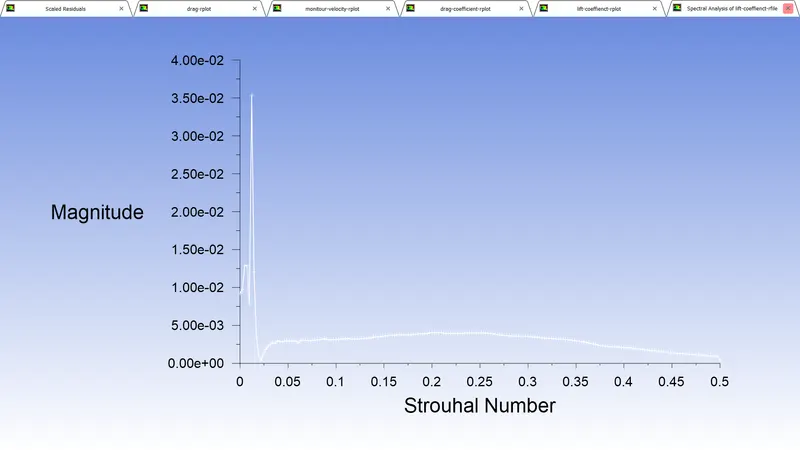
In this, we will analyze flow over a cylinder for different Re for both steady and unsteady cases and find the Strouhal number which will show how Karman vortex street generated.
The Strouhal number is defined as St = fstD/U,
where fst is the vortex shedding frequency (or the Strouhal frequency) of a body at rest,
D is the diameter of the circular cylinder
U is the velocity of the ambient flow.
The Strouhal Number can be important when analyzing unsteady, oscillating flow problems. The Strouhal Number represents a measure of the ratio of the inertial forces due to the unsteadiness of the flow or local acceleration to the inertial forces due to changes in velocity from one point to another in the flow field.
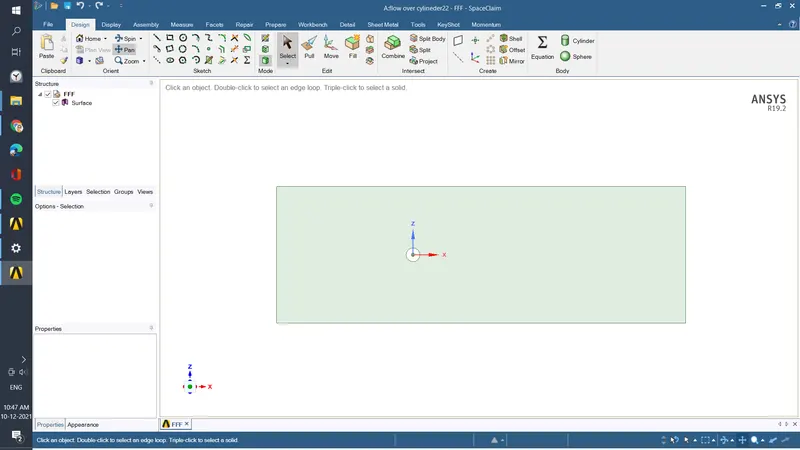
Geometry
cylinder dia -2m
domain- 20x60m
Meshing
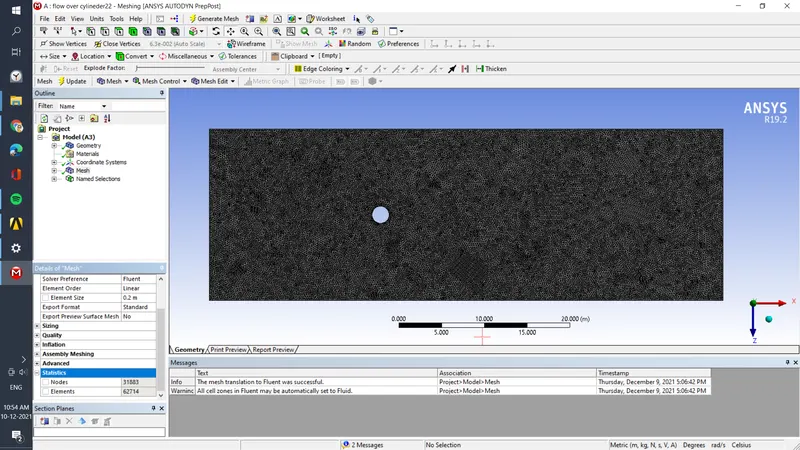
Nodes -31883
elements-6274
infliction layer-6
element size-0.2
solution setup
material - user-defined
density -1kg/m^3
dynamic viscosity -0.02 (to calculate for different Re )
type of solver is -pressure based laminar model
boundary condiction
initial velocity -1m/s
Results
Re 100
steady
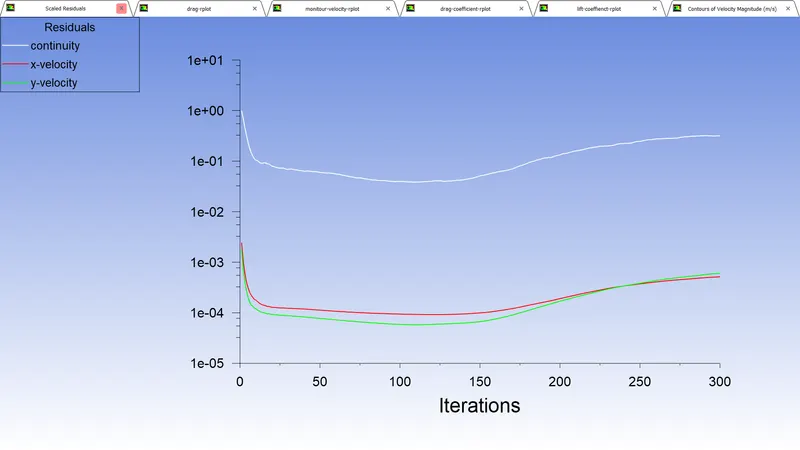
residual plot
fat 270 iteration flow converged.
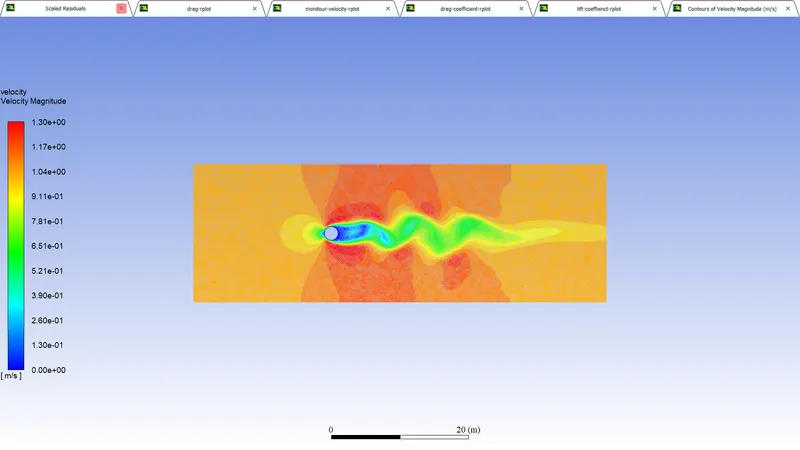
vortex shedding behind the cylinder.
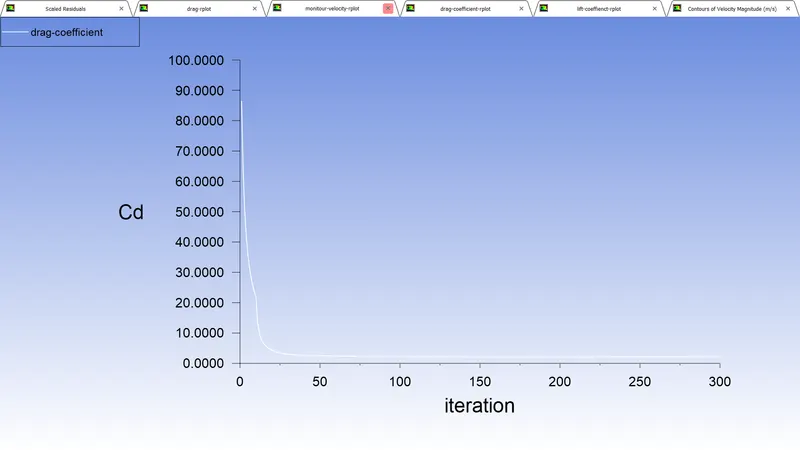
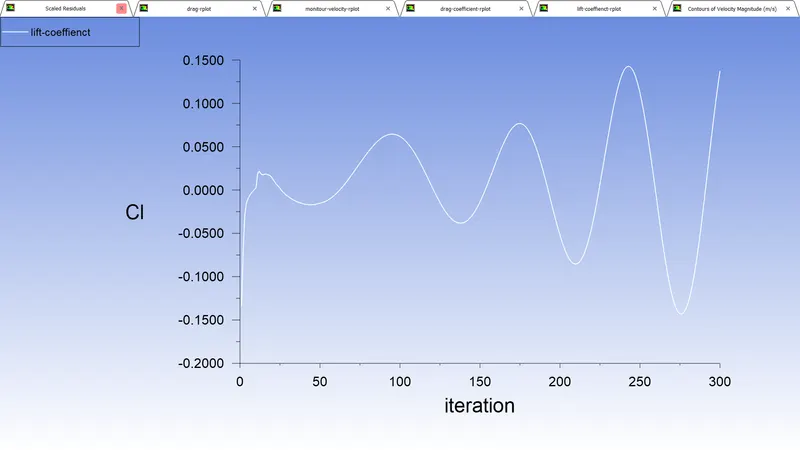
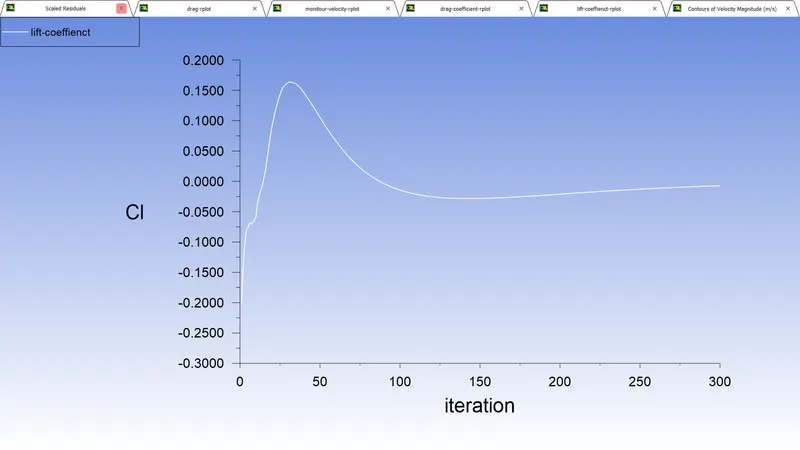
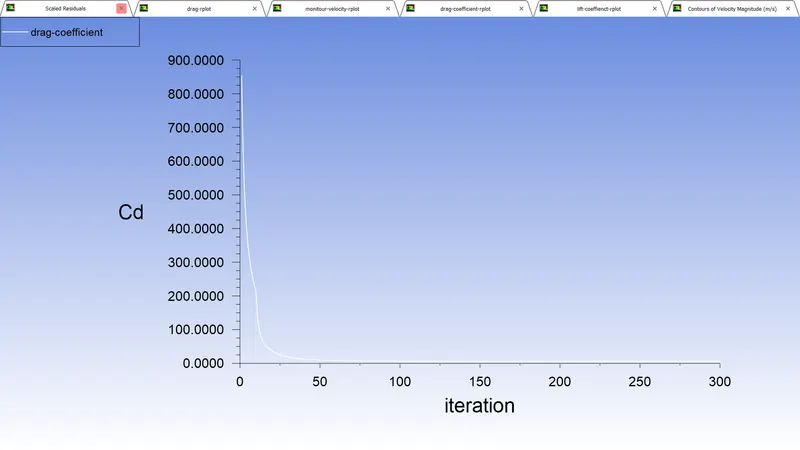
coefficient of drag and lift plots
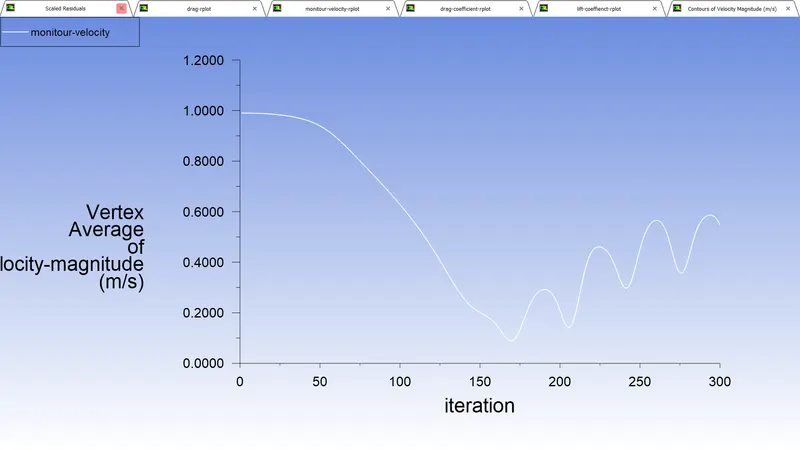
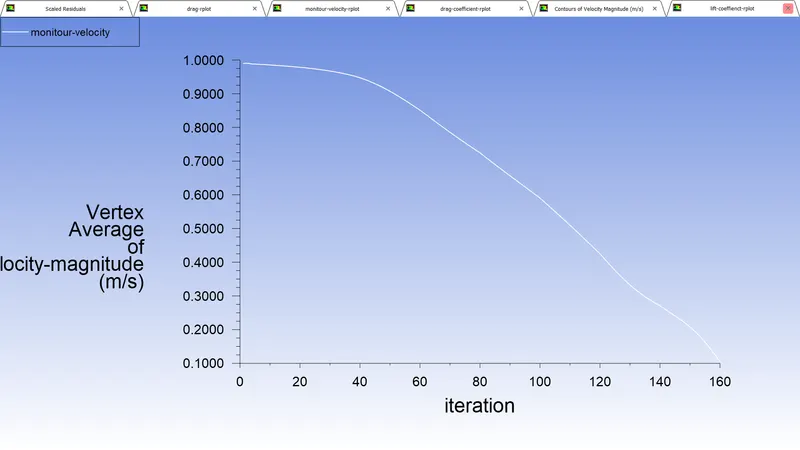
plot for vertex avrrage
it will show how vortex shedding behind the cylinder started, in this case at 150 iterations it started
unsteady case
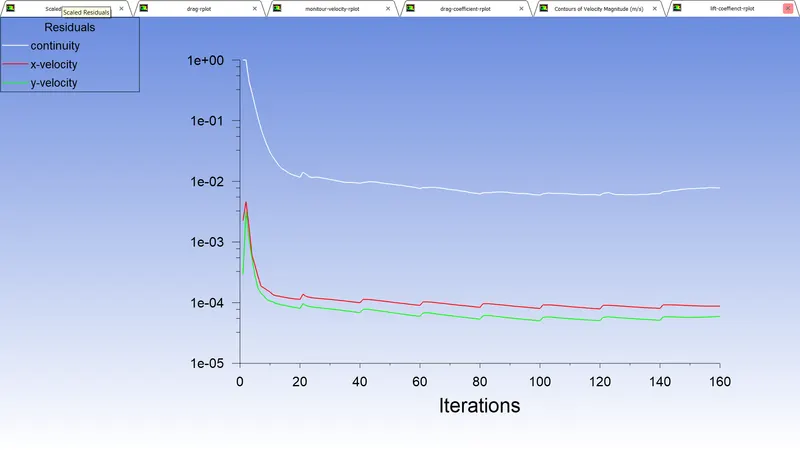
residual plot
fat 40 iteration flow converged.
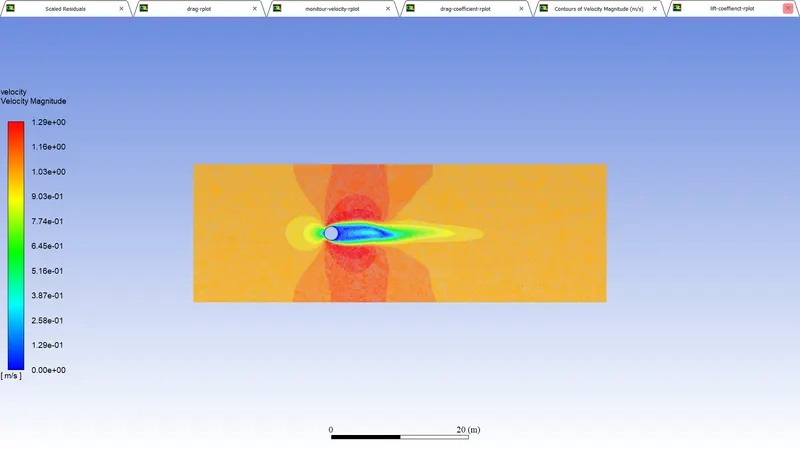
vortex shedding behind the cylinder.
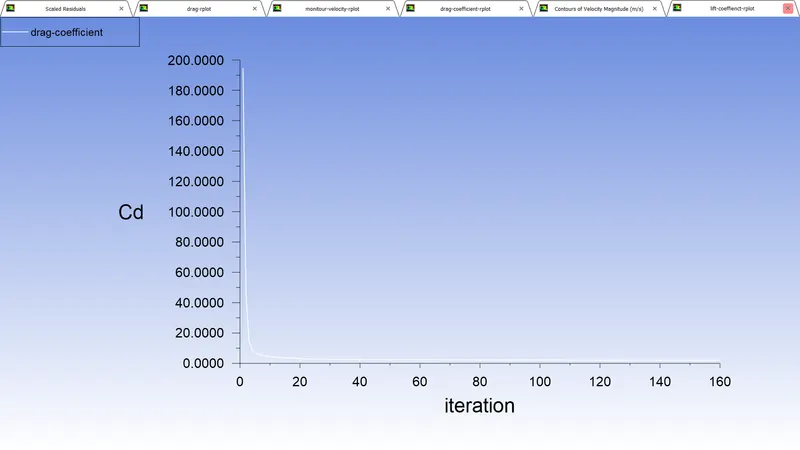
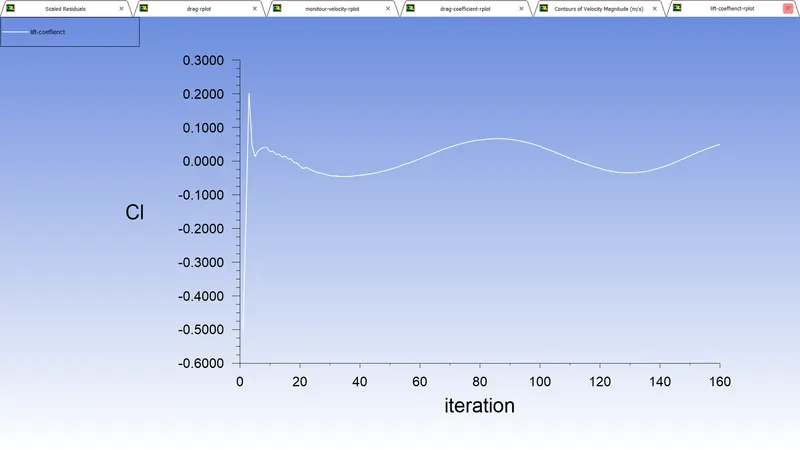
coefficient of drag and lift plots
plot for vertex avrrage
it will show how vortex shedding behind the cylinder started
Plots of the coefficient of drag and lift for different Re
material - user-defined
density -1kg/m^3
dynamic viscosity -changes are made accordingly
type of solver is -pressure based laminar model
Re=10
lift plot
drag plot
Re=100
lift plot
drag plot
Re=1000
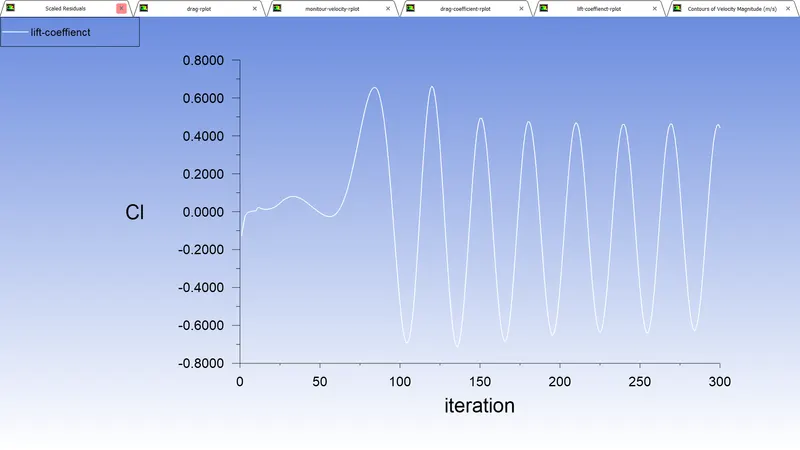
lift plot
drag plot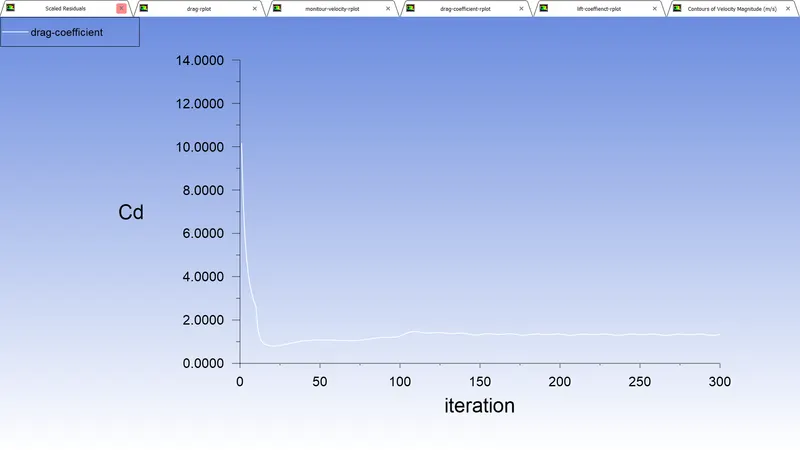
Re=10000
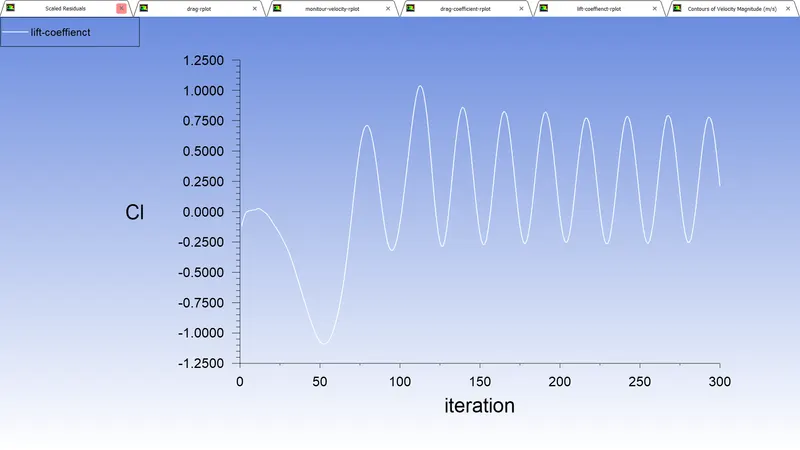
lift plot
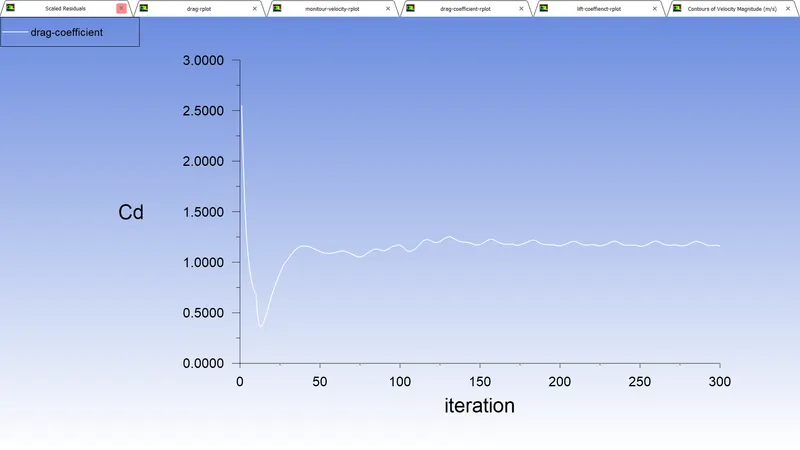
drag plot
Re=100000
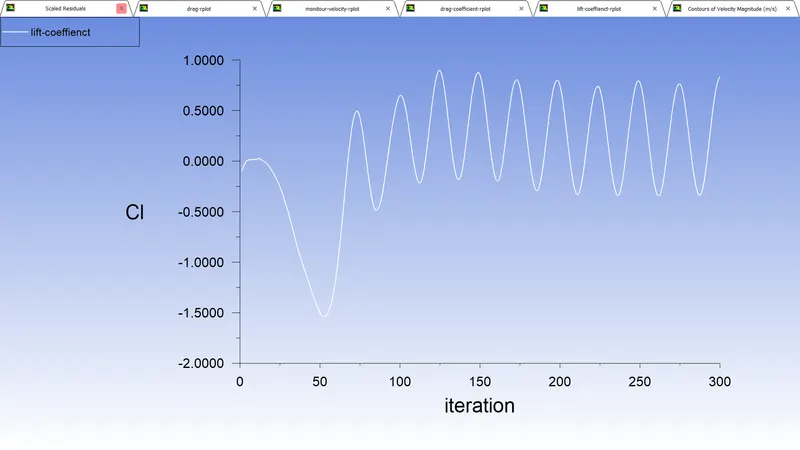
lift plot
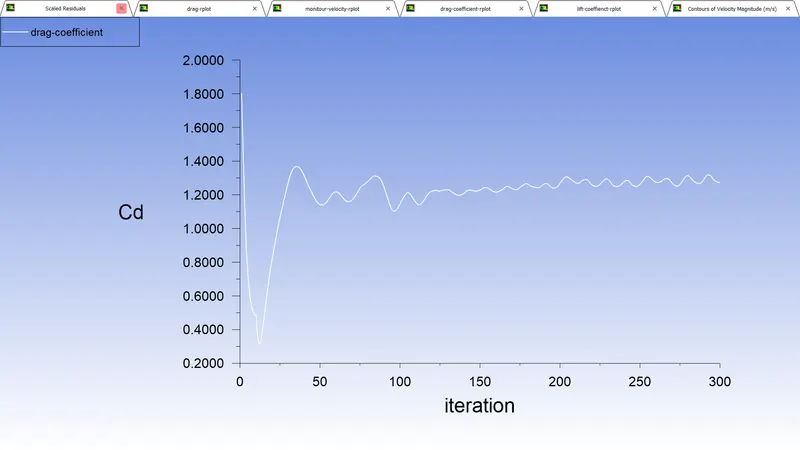
drag plot
Expected results:-
1)in both cases flow converged, we have to look at the residuals plot to know the flow converges are not.
4) Mention the referred material is
material - user-defined
density -1kg/m^3
dynamic viscosity -0.02 (to calculate for different Re ) changes are made accordingly
*When Re is very low there no much change in Cl and Cd graph as the Re increases the Cl and Cd start fluctuating more as the number iteration increases, which indicates as very high velocity has high amount lift and drag.