Week 2 Challenge
AIM: The aim of this project is to study the superstructure's behaviour under only live loads. IRC-6 defines various loads coming on the structure , the live loads to be considered for the design depends on the carriage way width and the purpose of the bridge. the choosen live loads are then applied on the model then analysed in the Stadd. A grillage model was created to analyse the structure in the stadd.
INTRODUCTION:
The loads and the loads combinations to be considered in the design are to followed from the code IRC 6. Standards and specifications and code of practice for bridges.
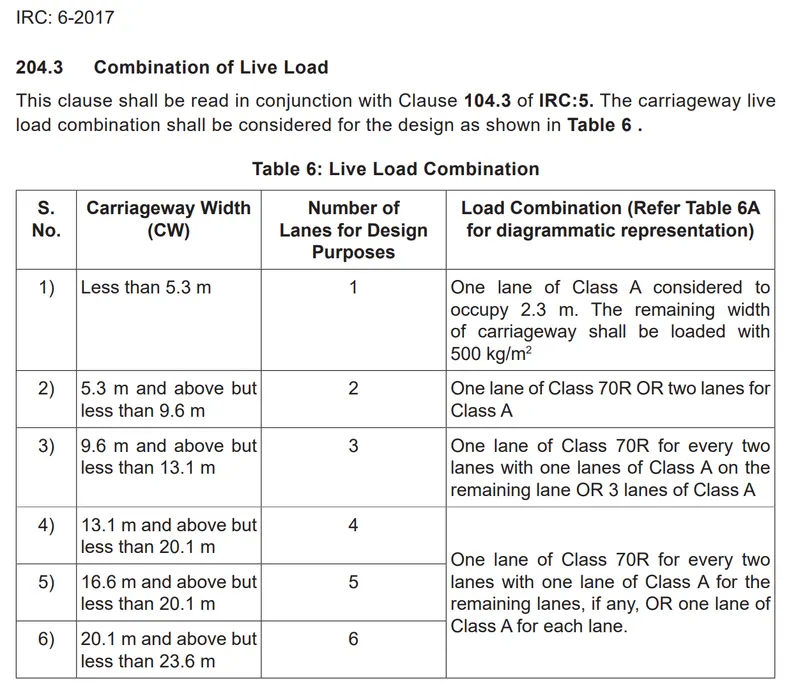
Here our carriage way is 7.0 m wide, therefore the combination to be considered is, number 2, one lane of Class 70 R or two lanes of Class A.
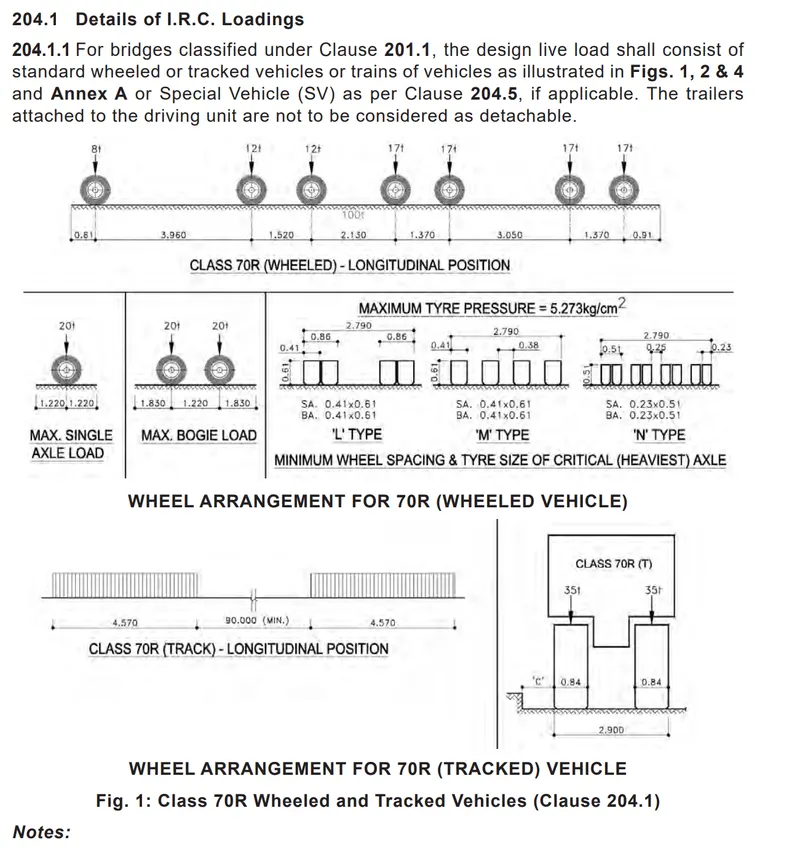

Here the length of the Class 70 R wheeled is 13.4 meter and weighs 100T
& 70 r tracked lencth = 4.57 m and weighs 70 T
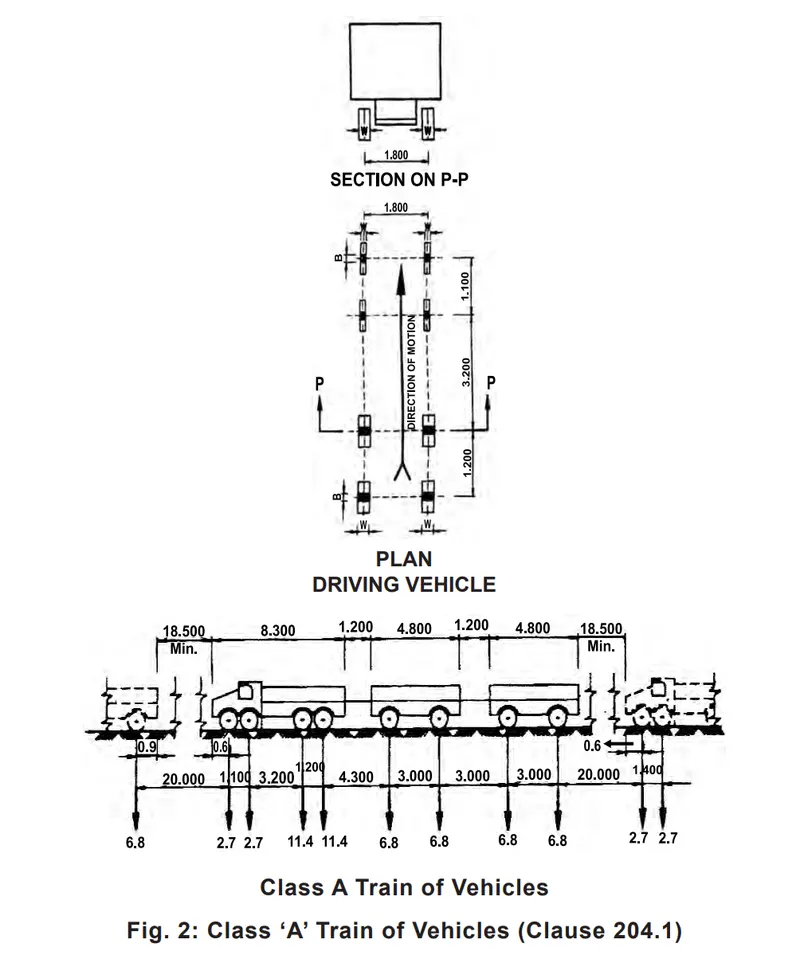
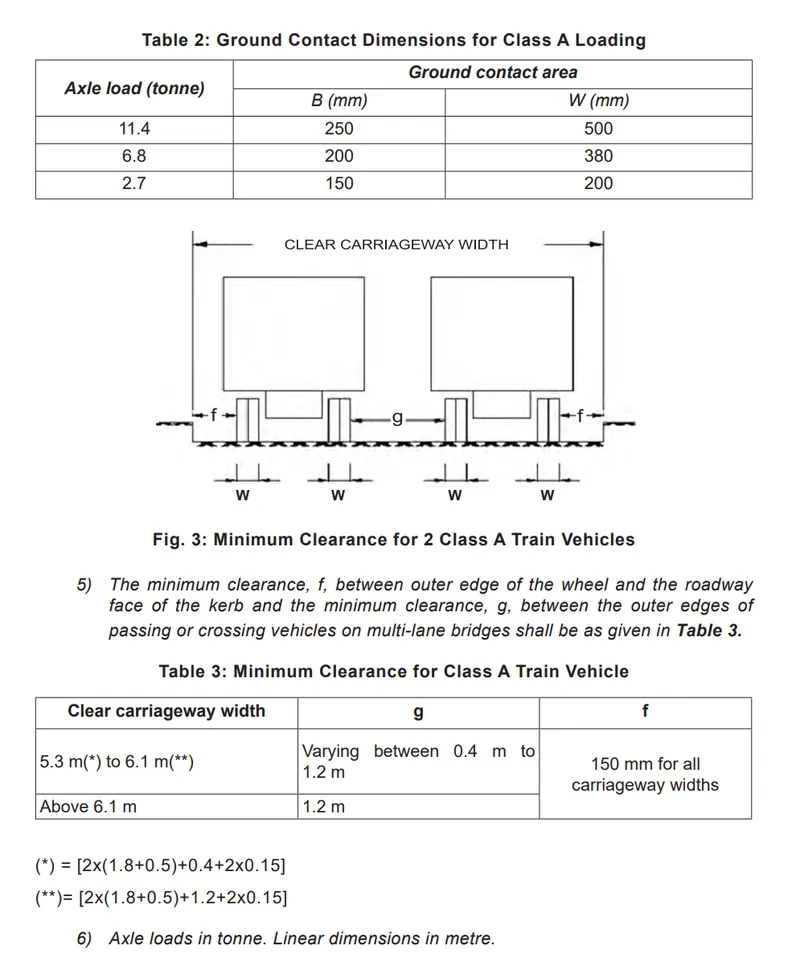
Here the length of the Class A wheeled is 18.8 meter and weighs 55.4T
Grillage model was created, the beams which does not take any direct live loads are created as dummy beams with unsignificant dimensions.
Span:24m
carriage way width:7.0 m, overall slab width includes 2x0.35 +7.0=7.7 m. Here 0.35 kerb width is provided on either side of the deck slab.
Type of bridge: The bridge is a I girder bridge running through the span and the intermediate cross girders are connnected at 8m centre to centre.
Number of main girders: 4 number
number of cross girders: 4 cross girdres at 8m c/c
Support reactions: the support reactions are considered as pinned.
The material considered as concrete all.
PROCEDURE:
Step 1
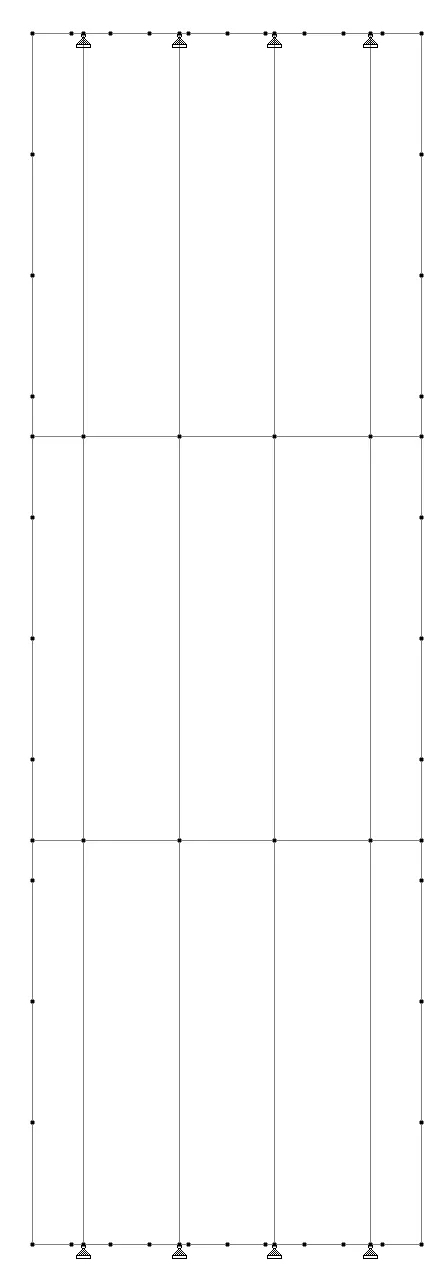
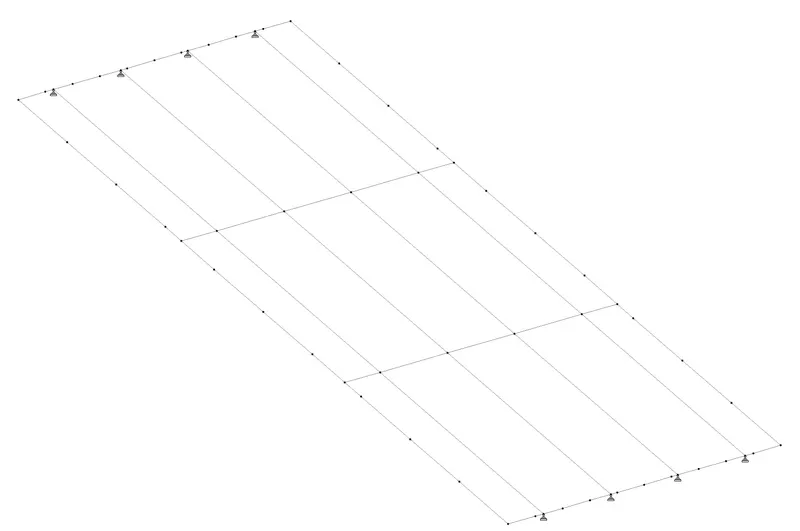
The nodes were created first choosing at one end of the bridge.
Using translate command from the geometry tab, the nodes are generated in the z-direction at spacing of 8m, for 3times.
them by choosing the add beam option, the following beams are drawn.
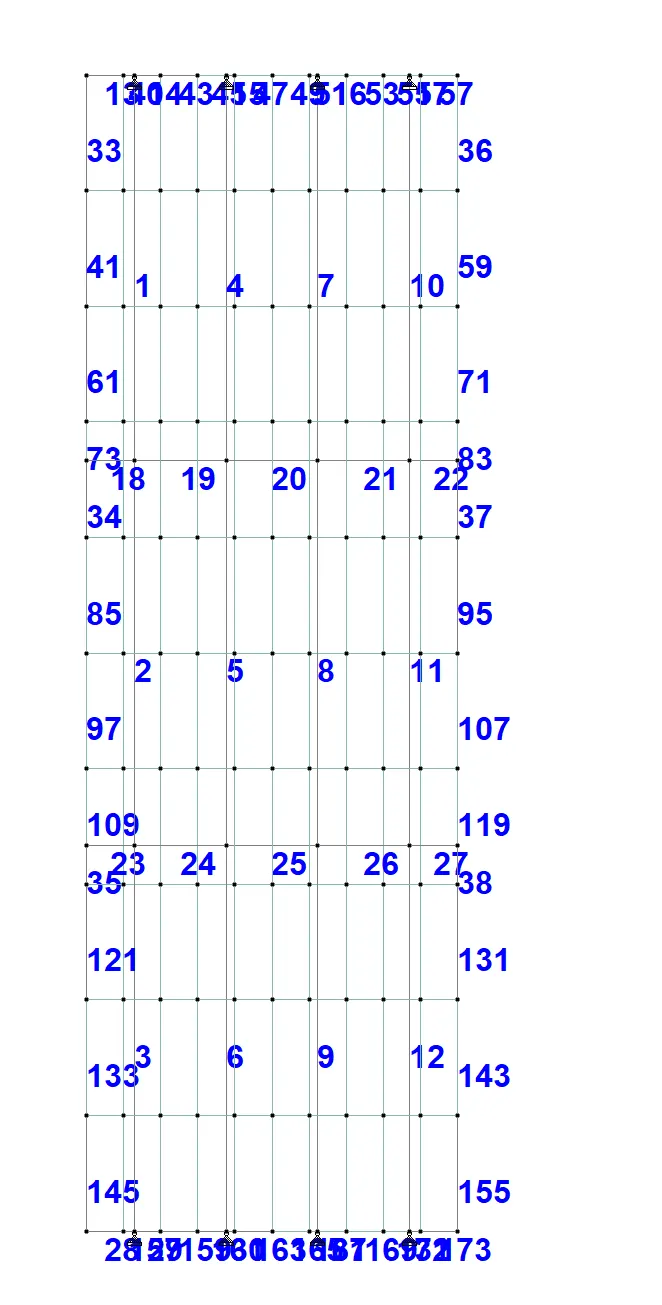
the figure below with numbers shows the beam number.
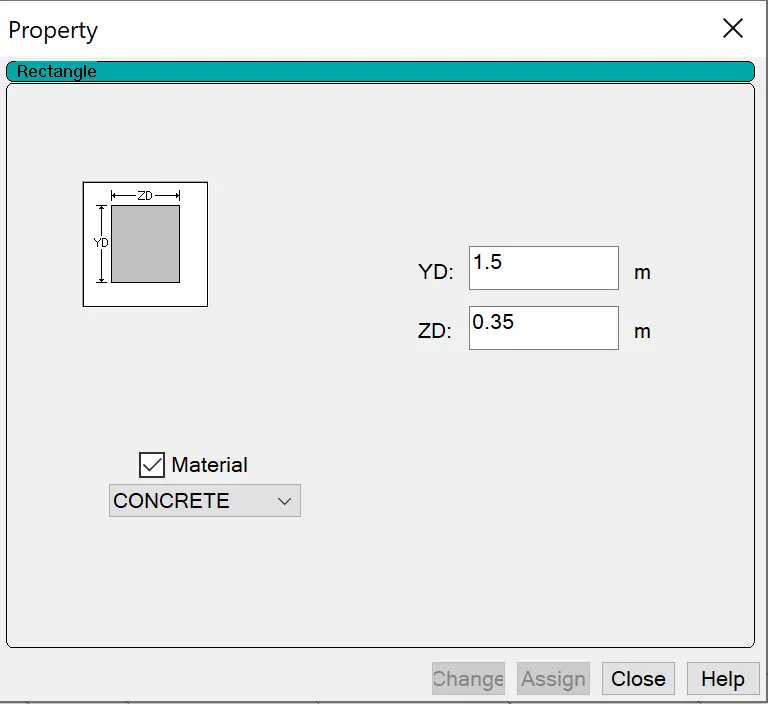
since there is no beam at the left and right ends, this particular beams are given with minimum sizes here it is 0.1mx0.1m
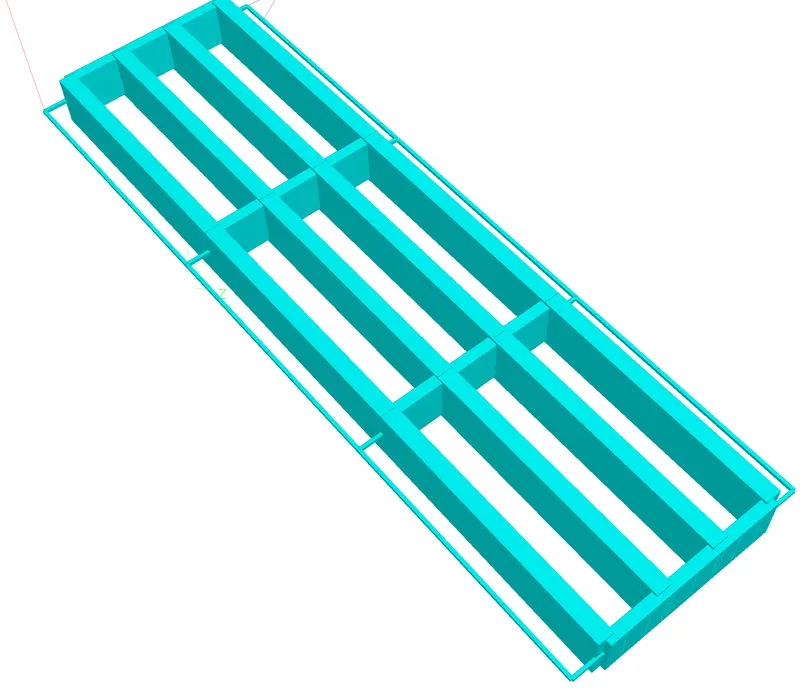
In the property command the follwing step by step properties were selected
The assigning procedure followed were assigned to selected members, it can also be assign to selected view.
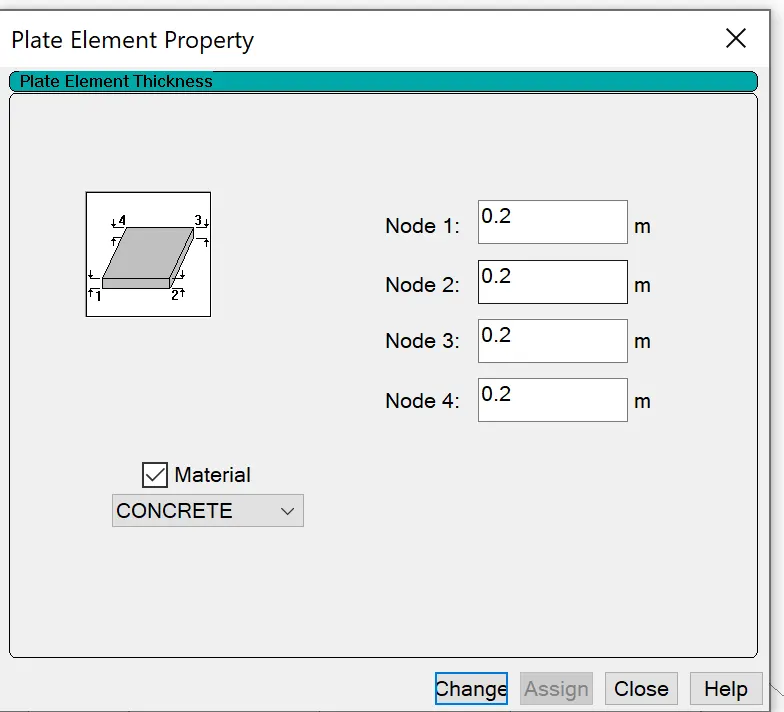
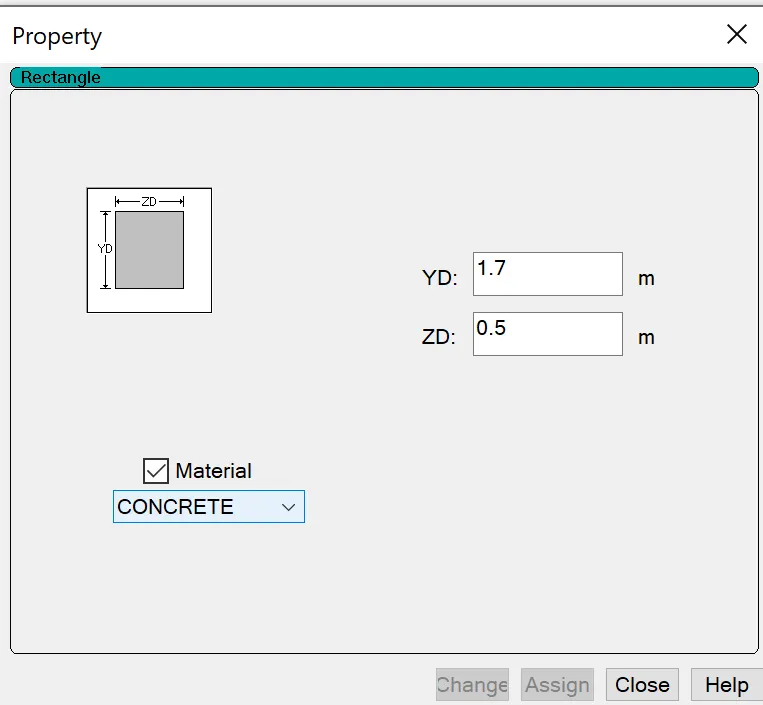
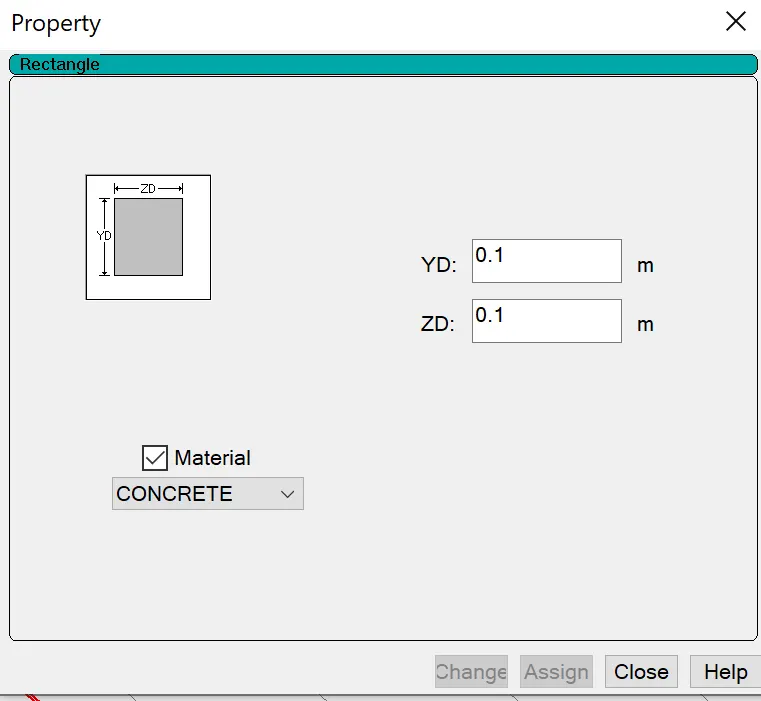
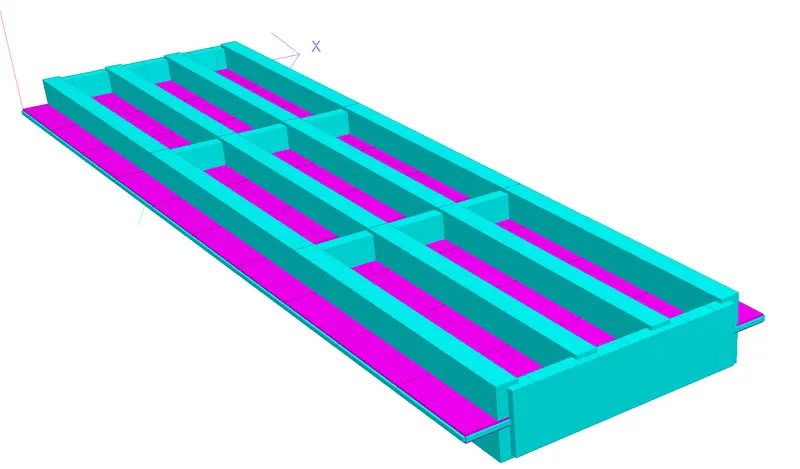
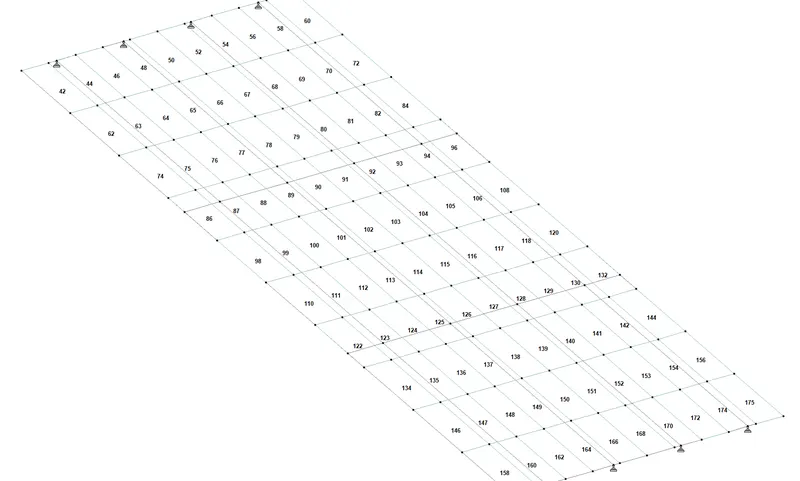
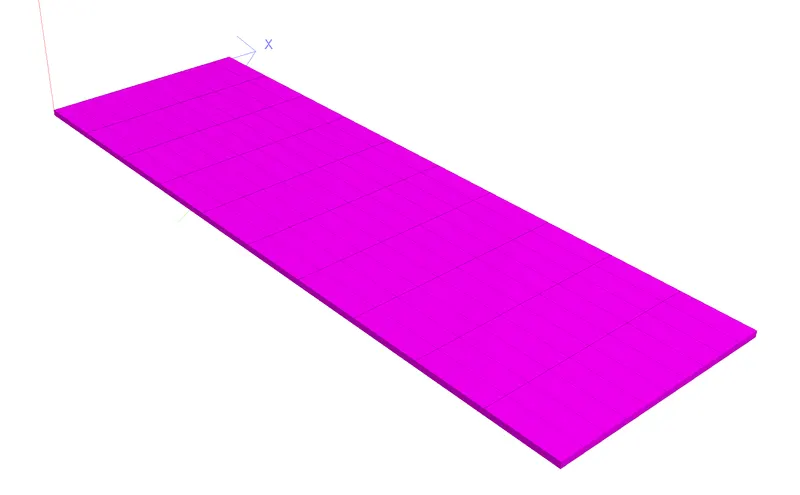
Then the slab was assigned to the model of thickness 200mm. The plate numbered figure is shown in the following figure.
Load Generation definition procedure:
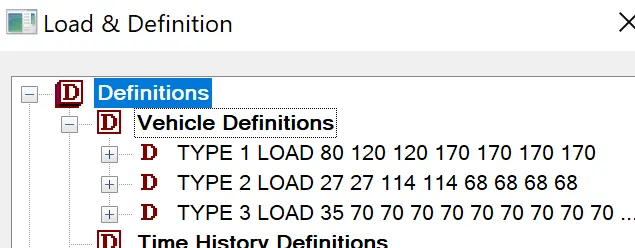
In the analytical model, selecting the loading tab, in the loading tab, select the definition and then vehicular definitions.
when you click the option the following box pop up,
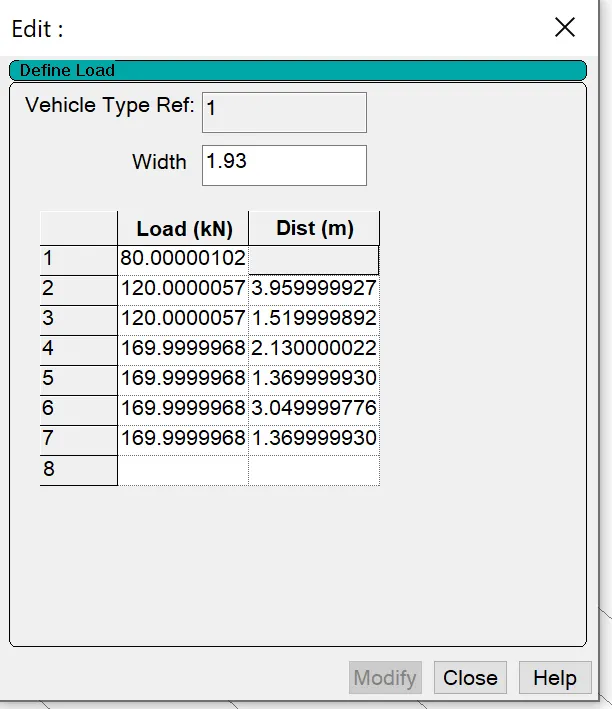
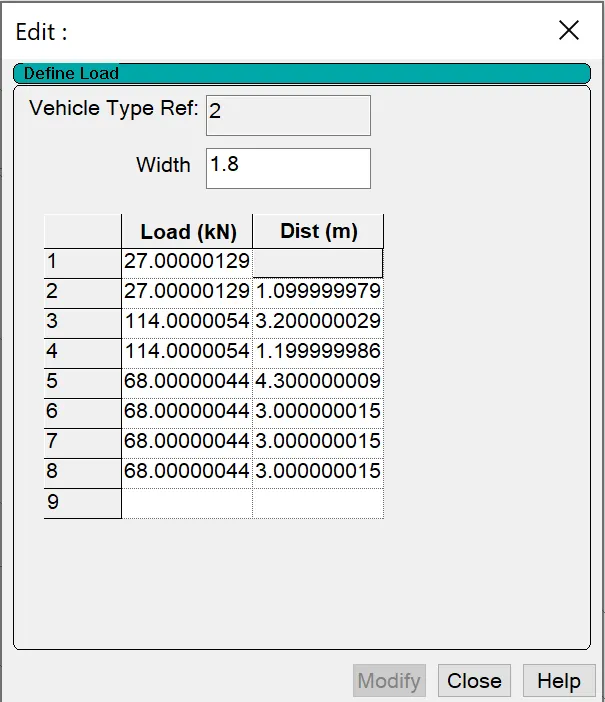
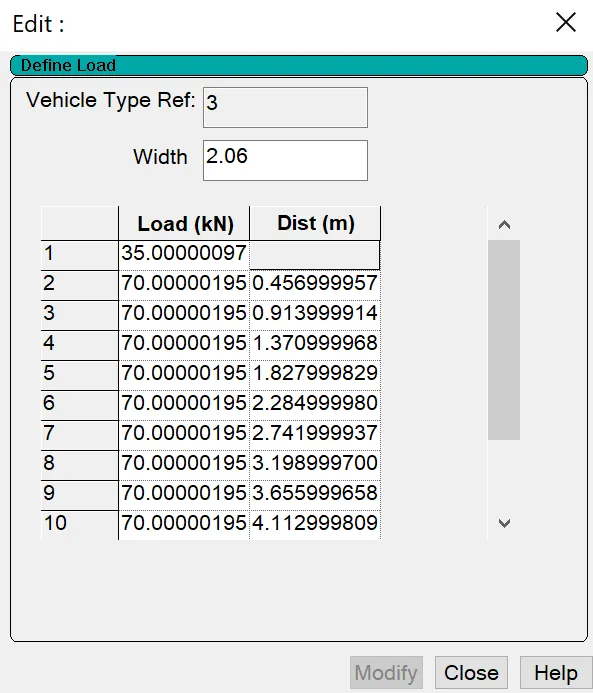
here three typre of definitions are given
Class 70 R wheeled - type -1
Class A- type -2
Class 70 R tracked- type -3
Assigning procedure of wheeled loads on to the span.
In the following image, we can see that in the starting load definition, add load case -1
In the load case -1
we have to generate the loads,
In the load case details when we click add, the following table pops up,
In this we have to select the load generation,
then the numberr of genertions,
Calculation of the number of genertions
for wheeled vehicles
it is the (span length + vehicle length)/0.5+1
here o.5 is the increment
by doing so we get number of generations it takes to pass the whole vehicle from one end to the other end.
for class 70 R wheeled( 13.4+24= 37.4/0.5 )+1 =75
for Class A=(18.8+24)/0.5+1=67 generations
For Class 70 R tracked, in this particular case the load started from the front point load, therefore the number of generations to be calculated is only span/0.5 +1=49
The tracked load can be assigned as point loads by dividing the whole 4.57m length by 11 equal parts, with middle 9 parts as 9x70, at the ends with 35kN each.
therefore total load = 2x35+9x70=700kN.
Since Class A , two train of loads have to be taken side by side with 1.2m distance apart.
The generation can be done by giving the X coordinate as (0.35+0.15+0.5/2+1.8+0.5/2+1.20)=4.0m, this is shown in the tble below.
we have create number of generations, and in that we have select the type of vehicle wise, 1 or 2 or 3 and then the x, y and z coordinates and the movement of th vehicle along which direction the vehicle runs, here along z-direction the increment is given, here our increment is 0.5.
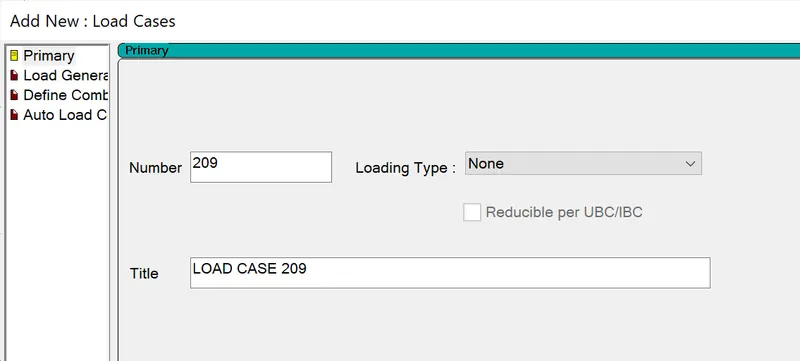
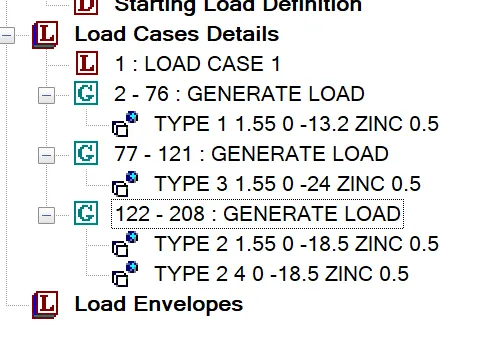
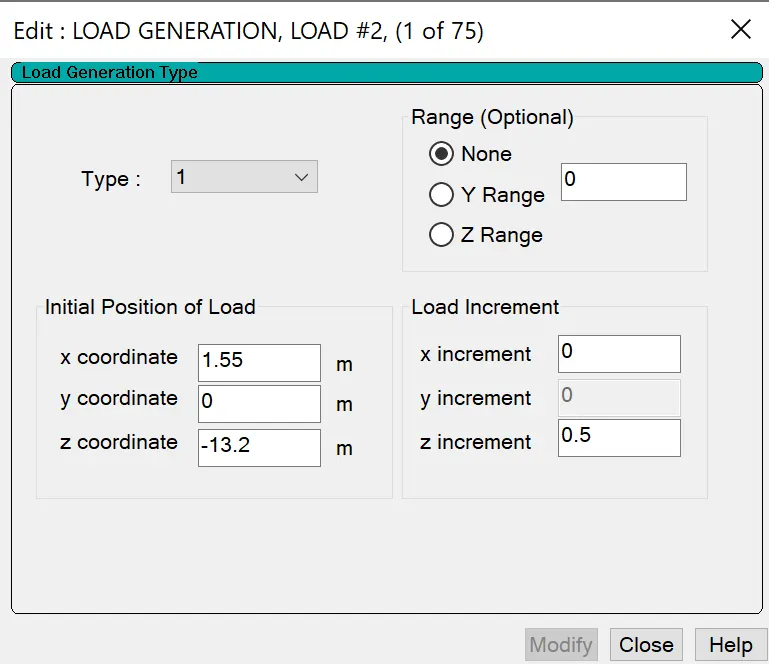
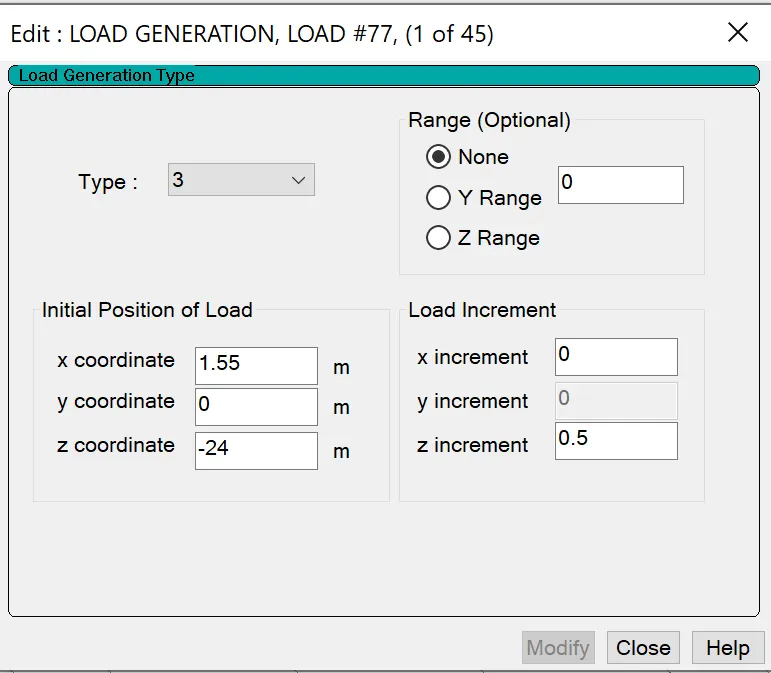
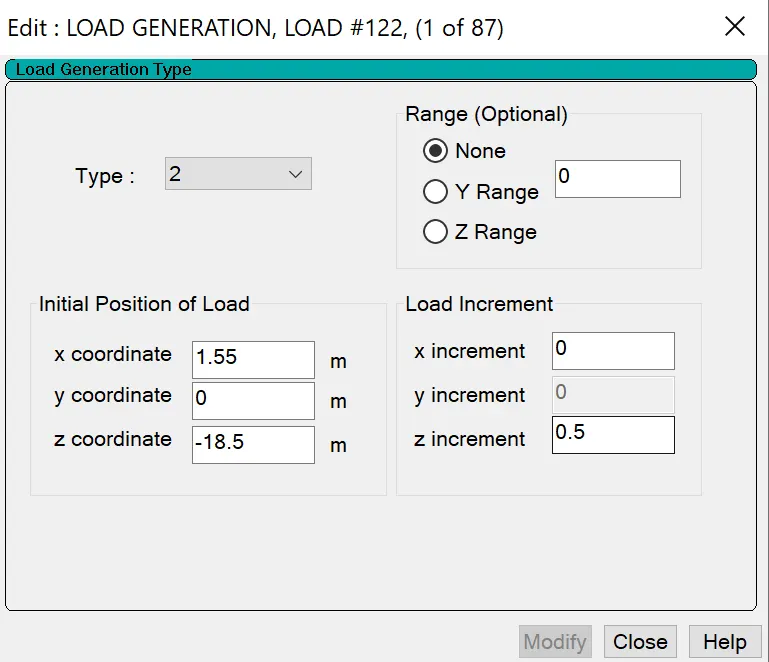
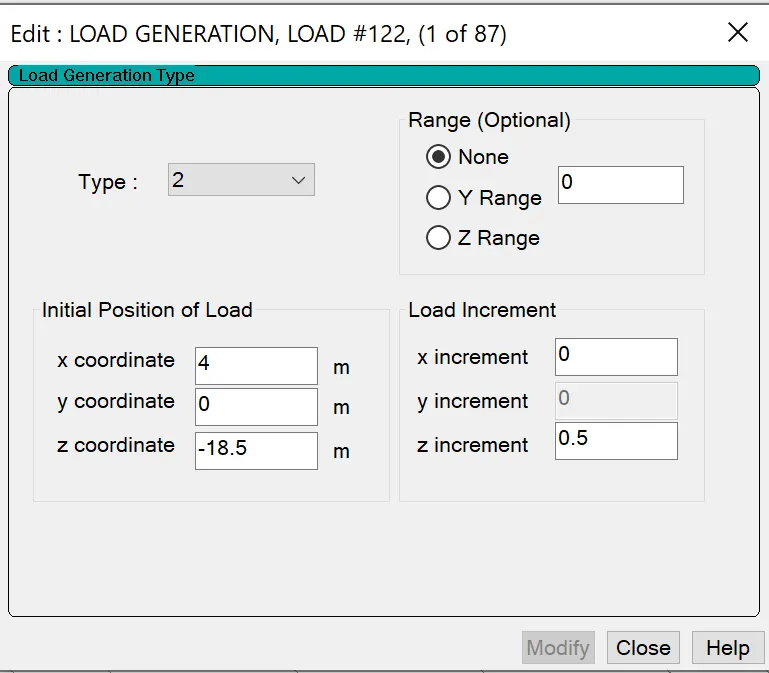
After assigning the load analysis is run, the results are seen in the post processing mode.
RESULTS:
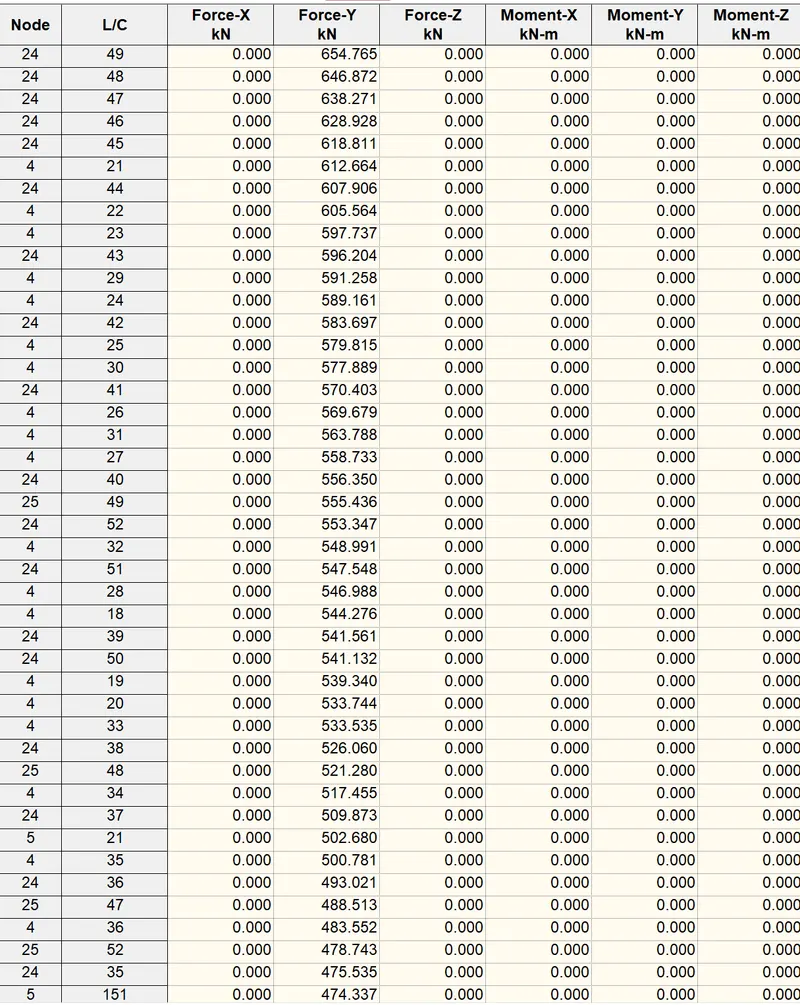
The maximum reaction occurs at the support 24, where the total train of Class 70R wheeled are approaching the right end supports.
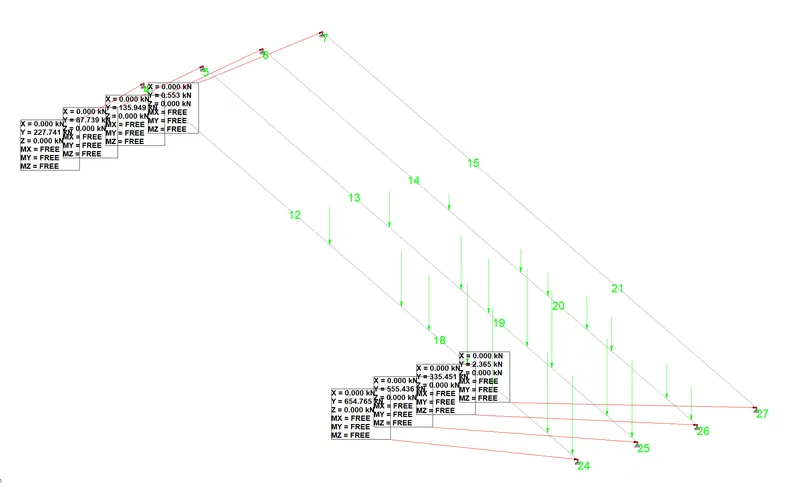
Support reactions report
The following table is generated form Postprocessing mode
Reports tab
In reports tab, after selecting the support nodes we have to select the support reactions and then the FY reaction, then all the load cases have to be considered.
Only few cases with maximum reactions are shown below.
******************************************************************
Longitudinal girder results
Beam results
In the post processing mode, checking the results tab
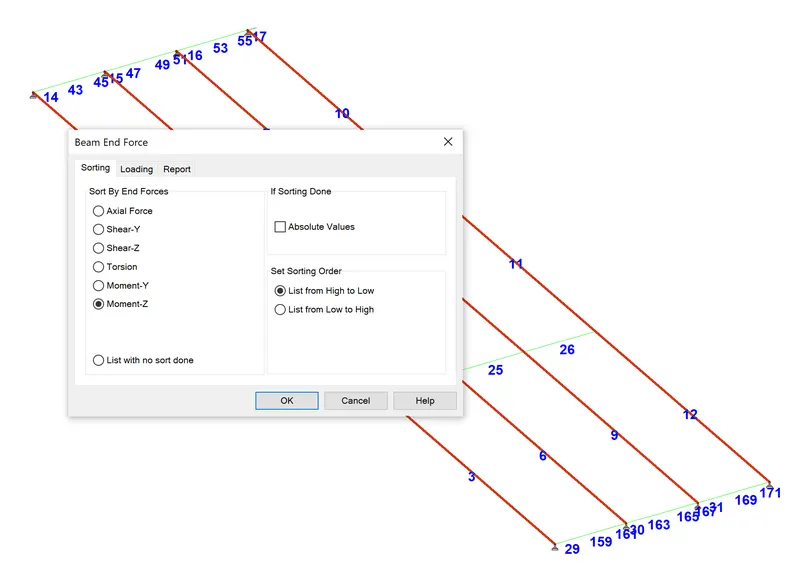
Then select only the longitudinal girders and click reports in reports select beam end force, then checking MZ.
The following table shows this
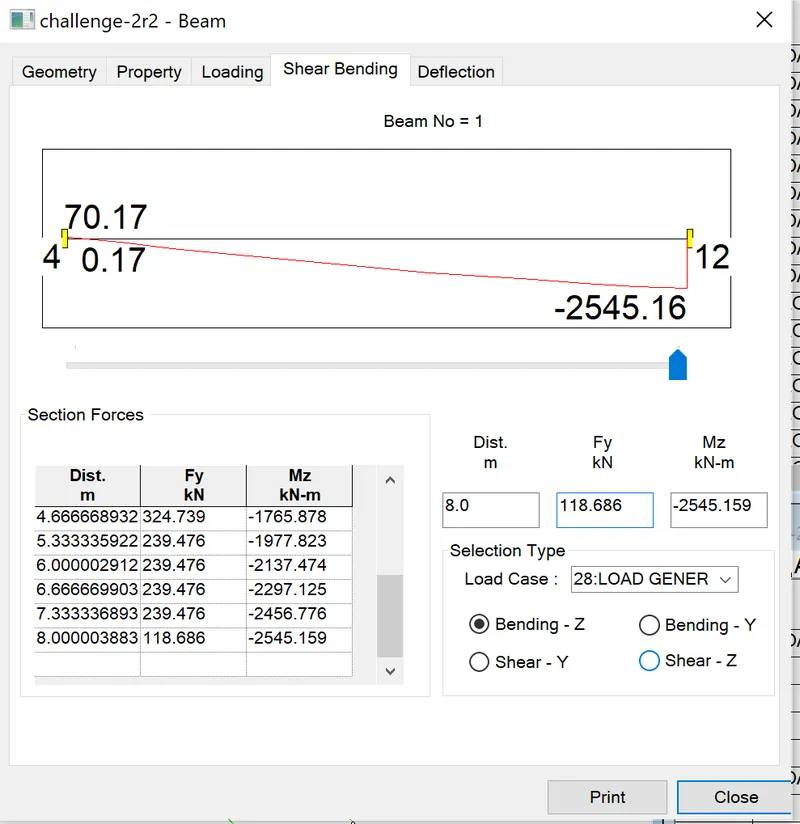
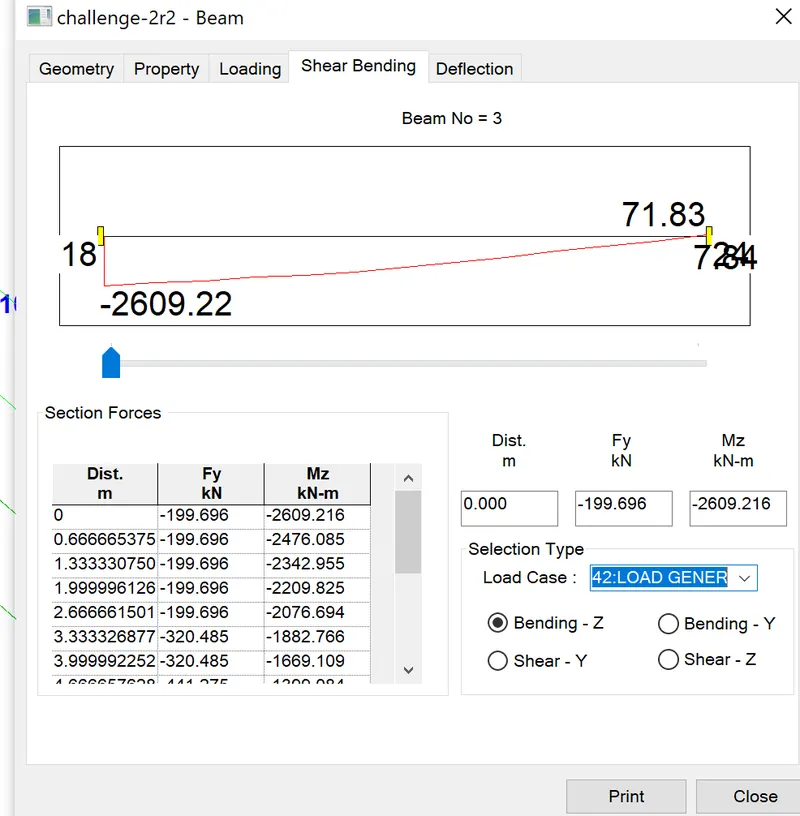
Then the report of bending moments from max positive to max negative are generated, the following images show the max positive and max negative bending moment results.
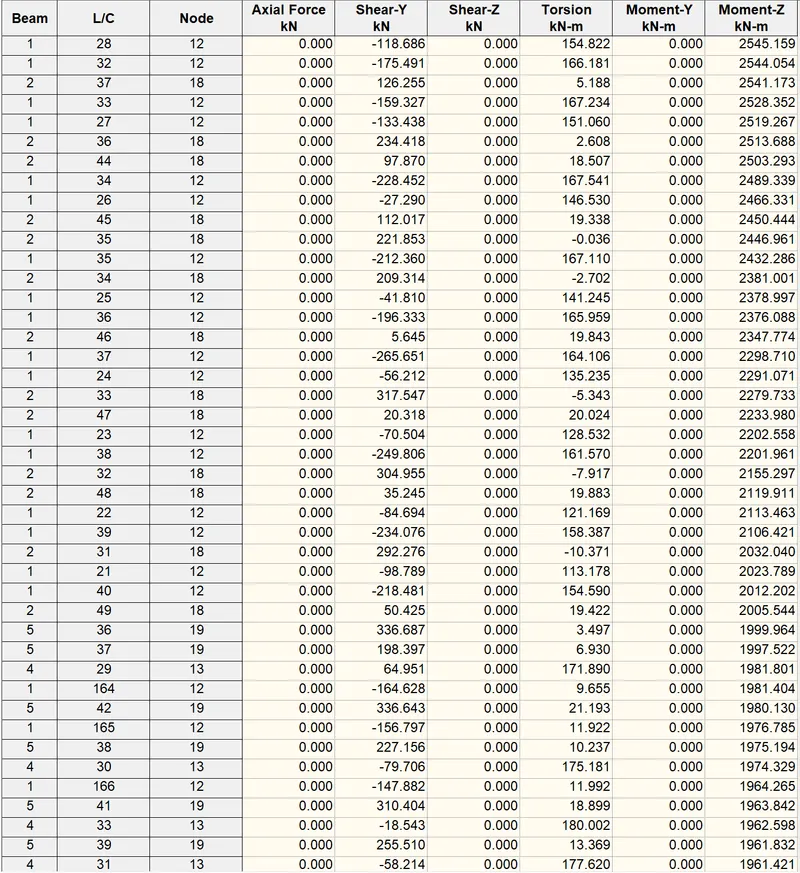
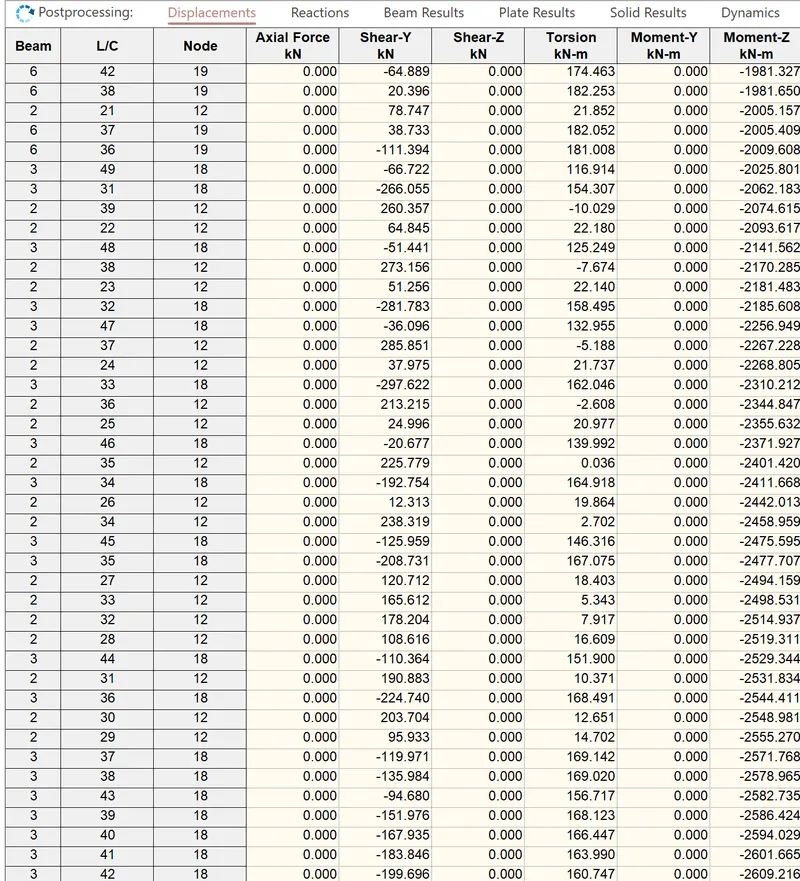
Here beam 1 and 3 are getting maximum bending moments for load case 28 and 42
***************************************************************************
Shear forces on longitudianl girders
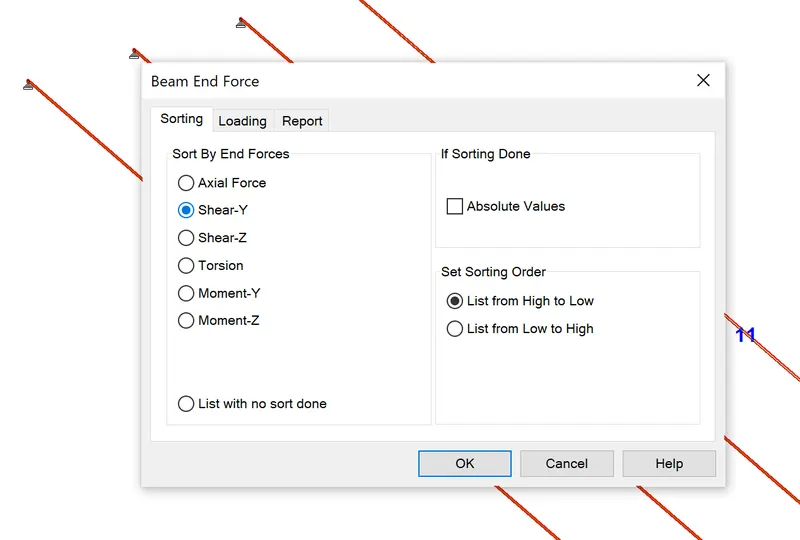
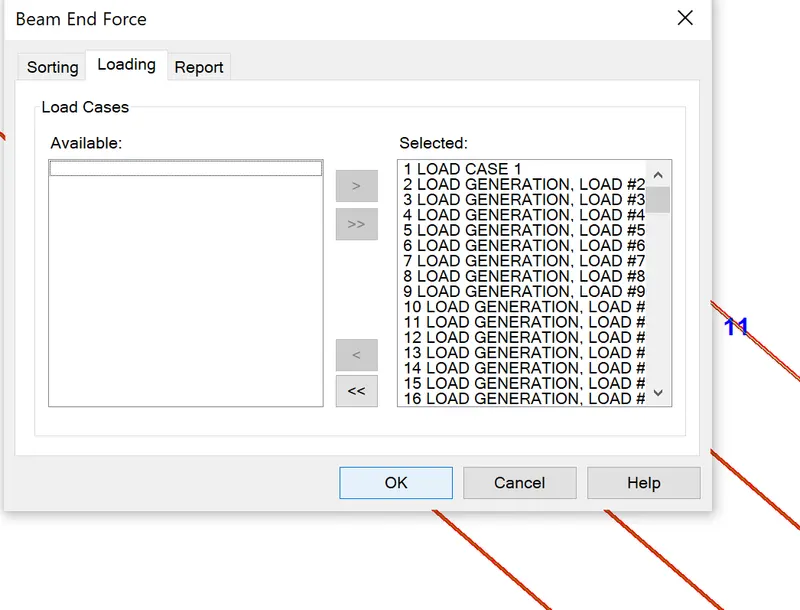
In the same post processing then results tab checking the beam end force, then shear Y the shear force results of the longitudinal beams are obtained.
The following images show the step by step procedure to obtain the shear results of longitudinal girders.
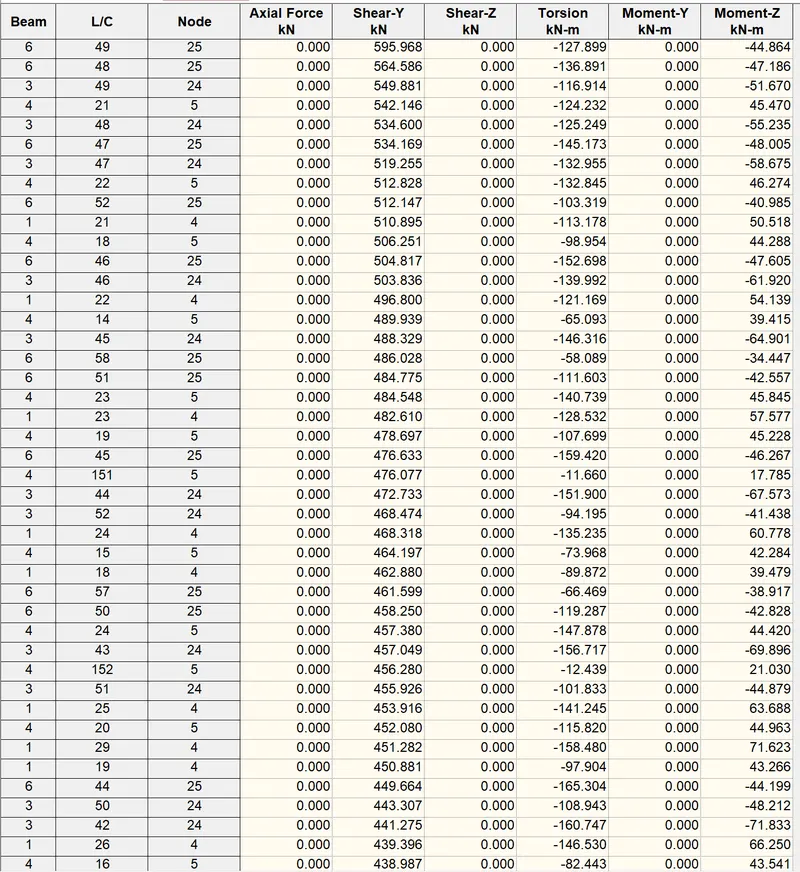
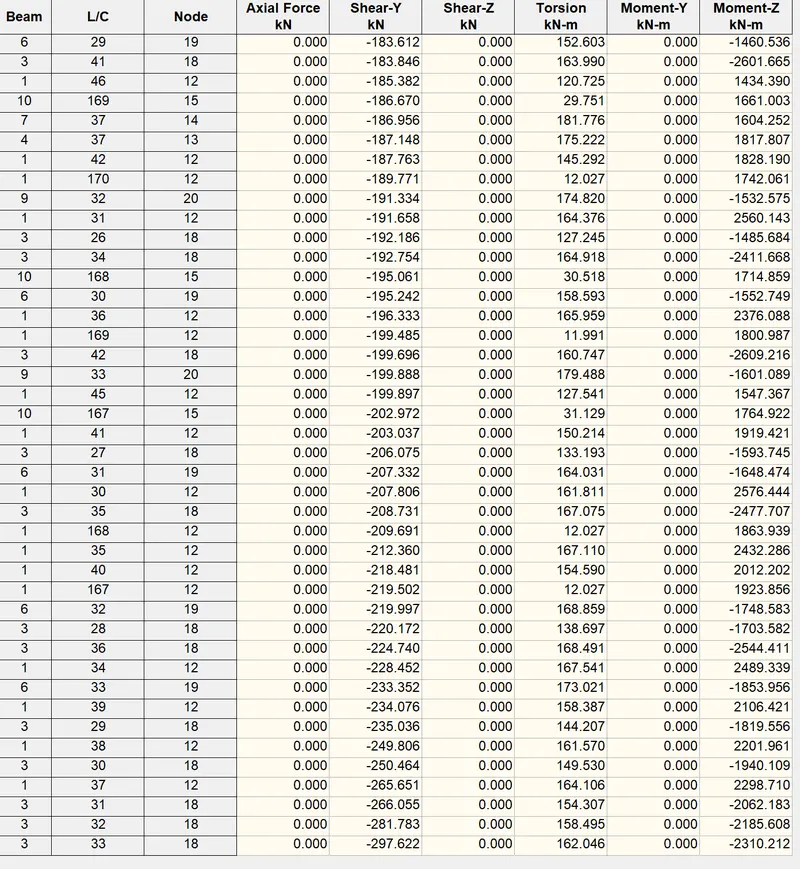
Here beam 6 is getting maximum positive and negative shear for load case 49 , load case 33.
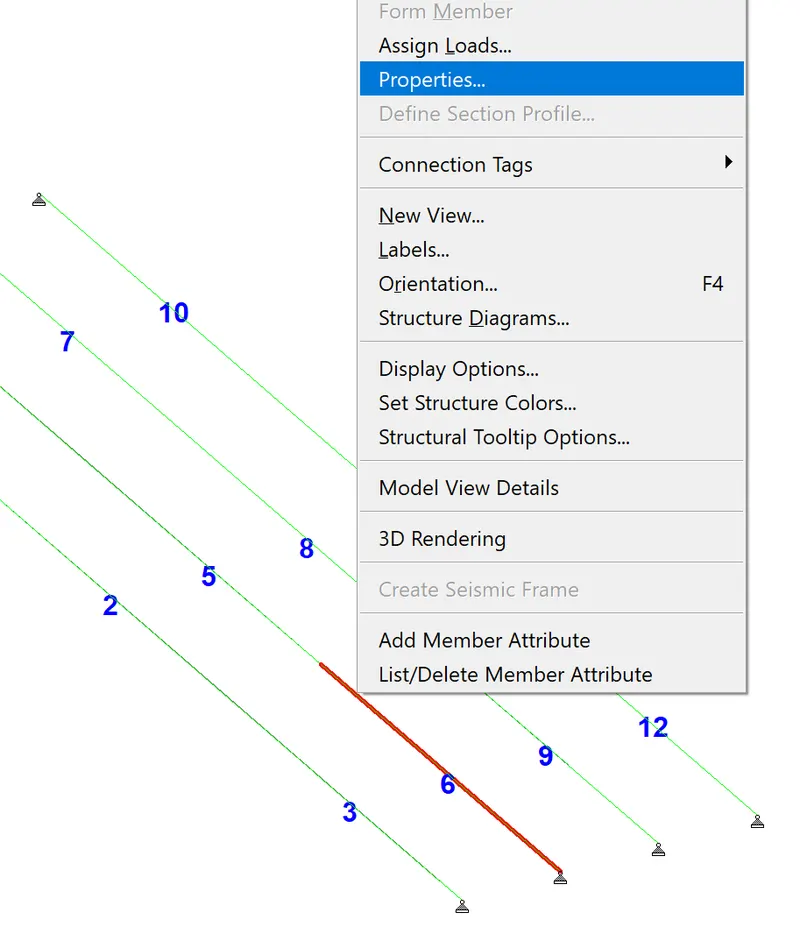
Selecting the particular beam which are having max results, right click and go to properties.
In the properties again selecting the shear and bending.
In here the particular load case is selected and for this max shear what is the bending moment can also be noted.
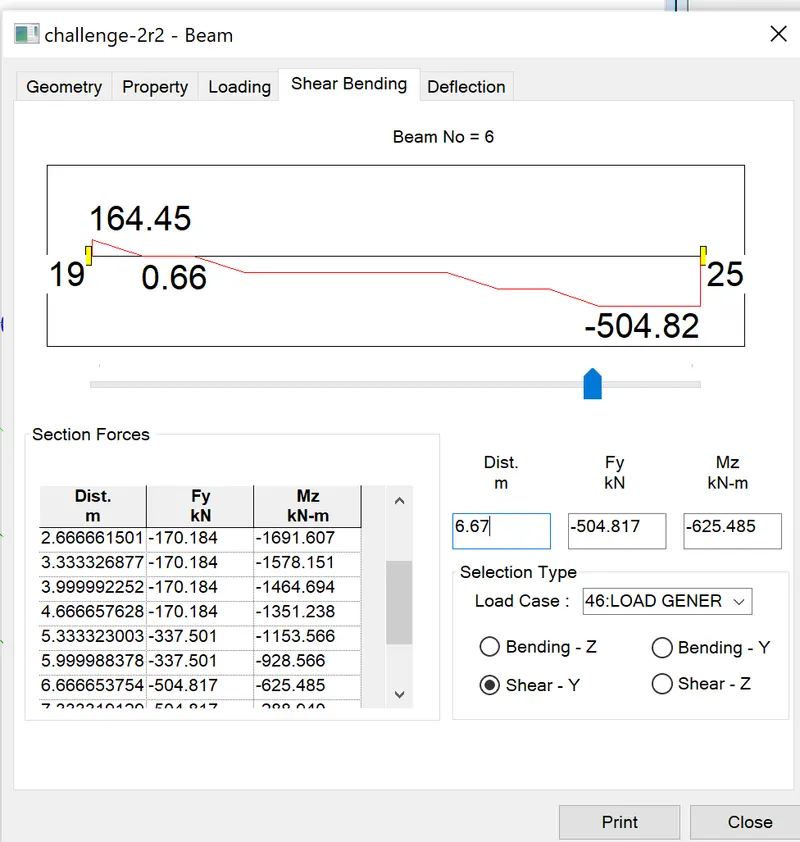
here at maximum shear the bending moment values are also given.
Cross girder results
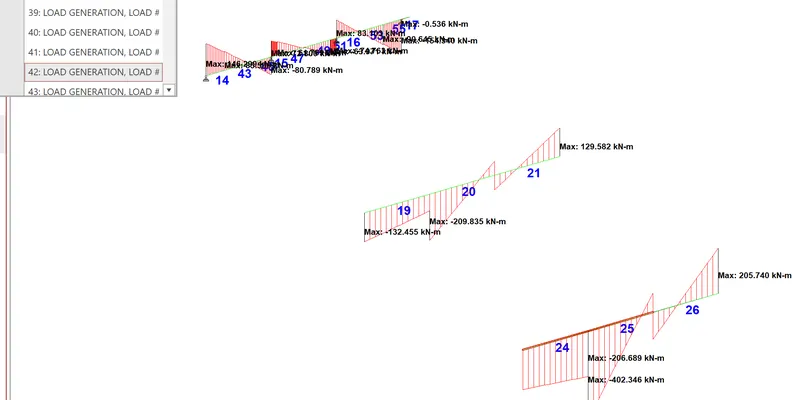
The bending moment results
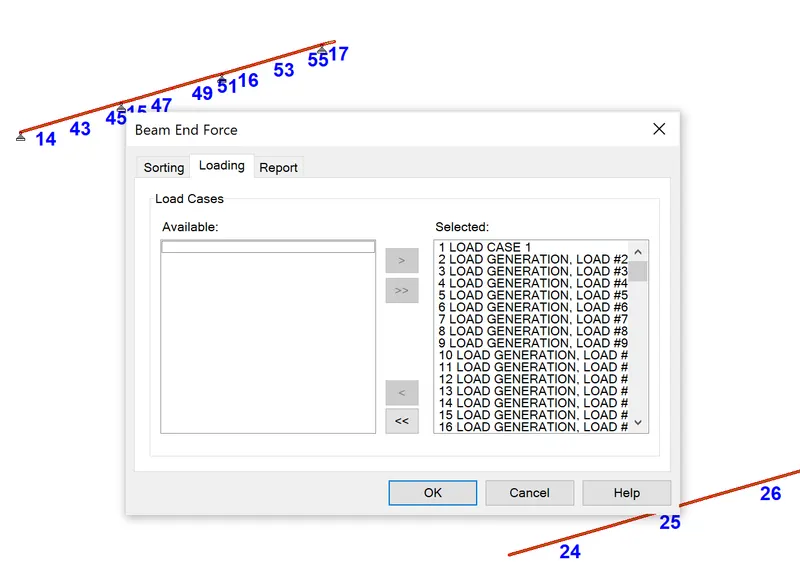
Select the cross girders, then in the post processing mode check the beam end force, clicking on the moment-z and getting the bending moment values.
The following images show the mx positive and max negative values. 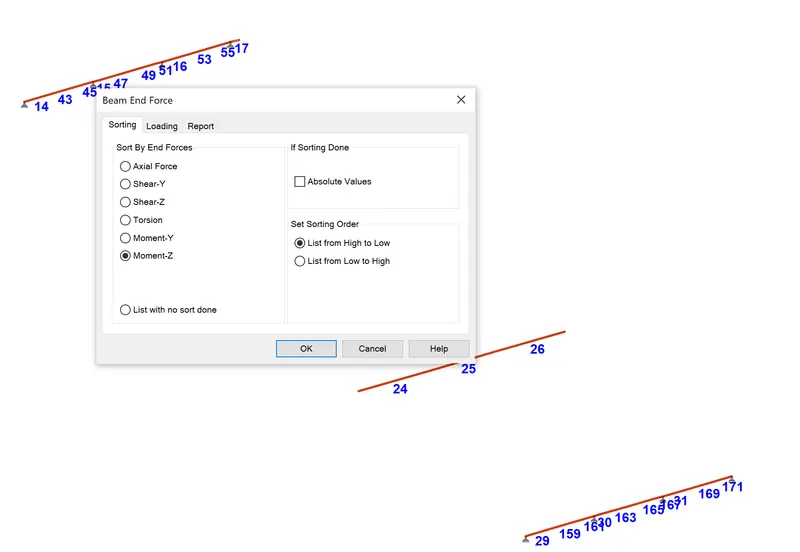
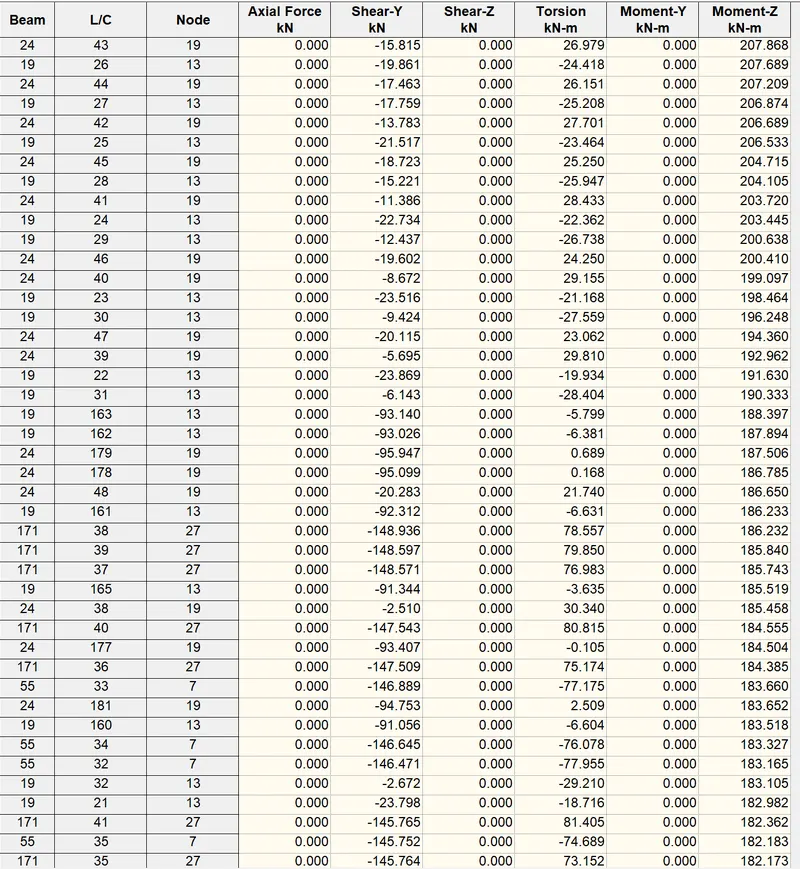
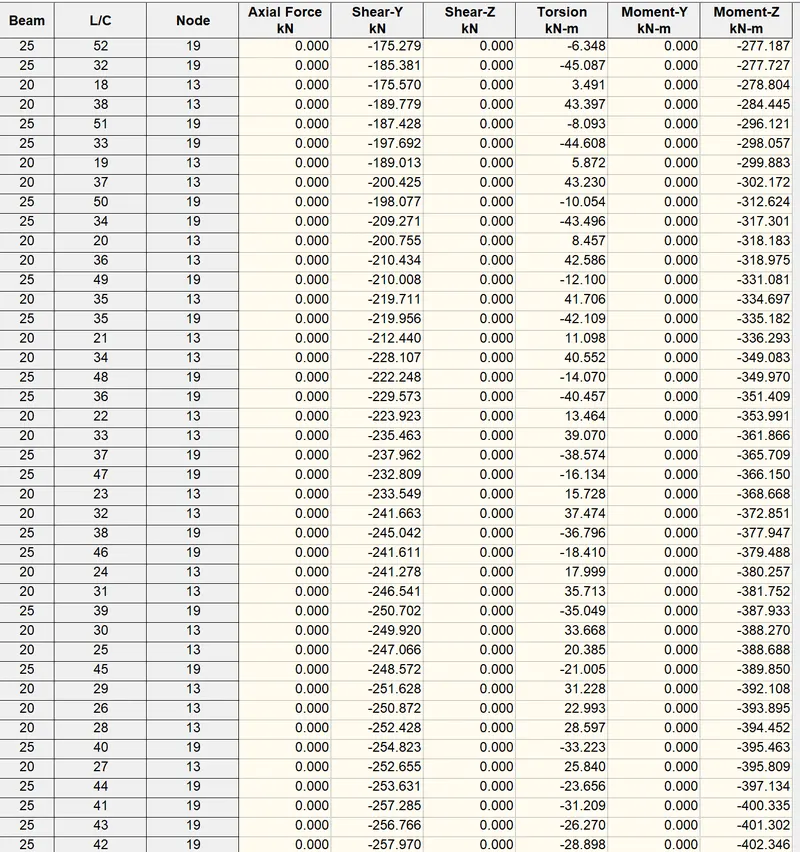
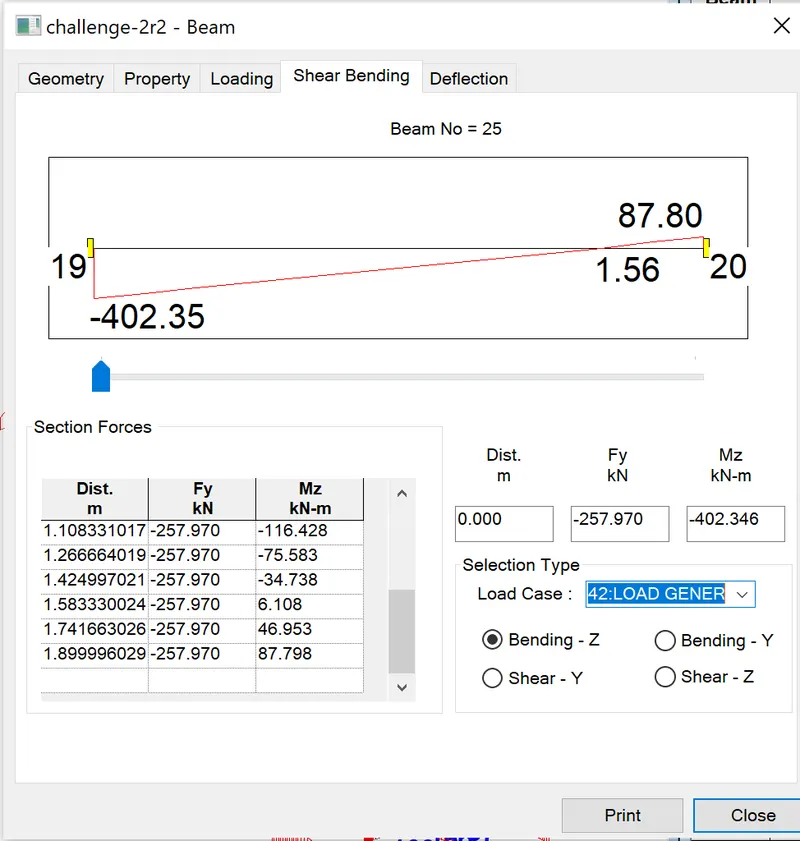
Here beam 24, 25 are getting maximum bending moments occur for loaad generations 42and 43
selecting the particular beam and right click to select the properties and check shear and bending.
for the particular beam and the load case selected, the valued can be seen in the images shown.
************************************************************************
Shear forces on cross girders
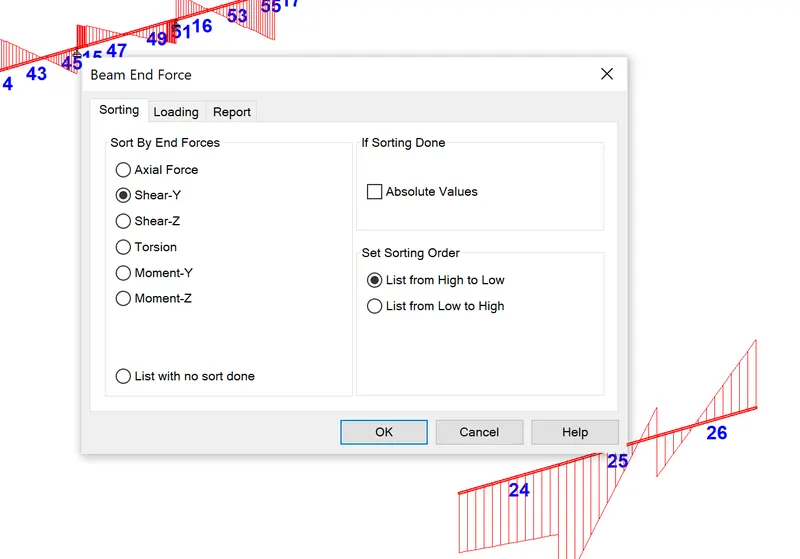
Select the cross girders, then in the post processing mode check the beam end force, clicking on the shear-y and getting the shear values.
The following images show the max positive and max negative values.
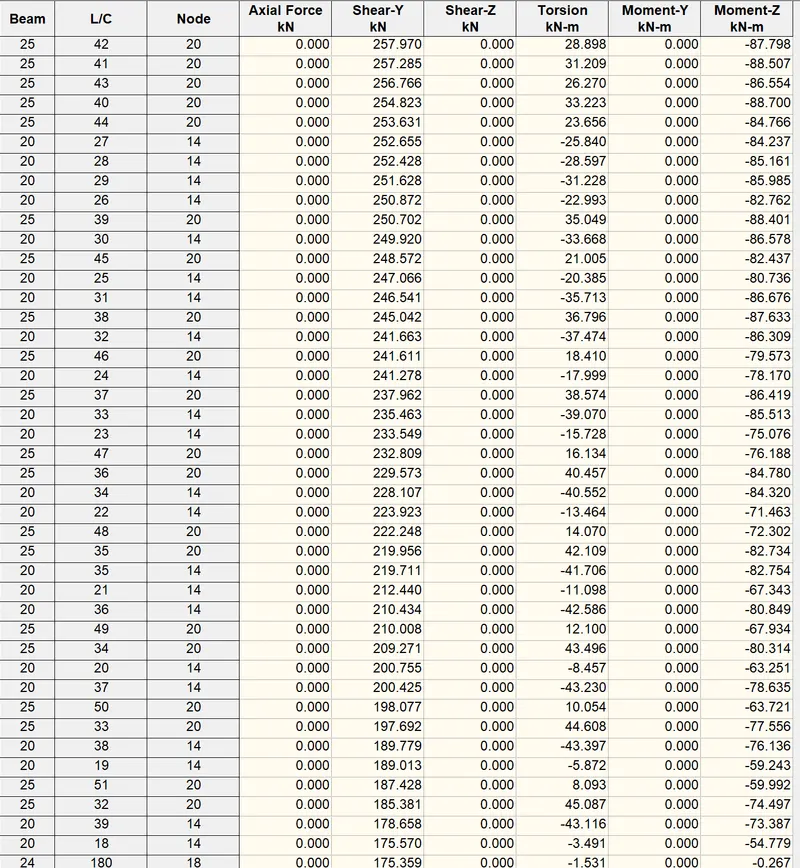
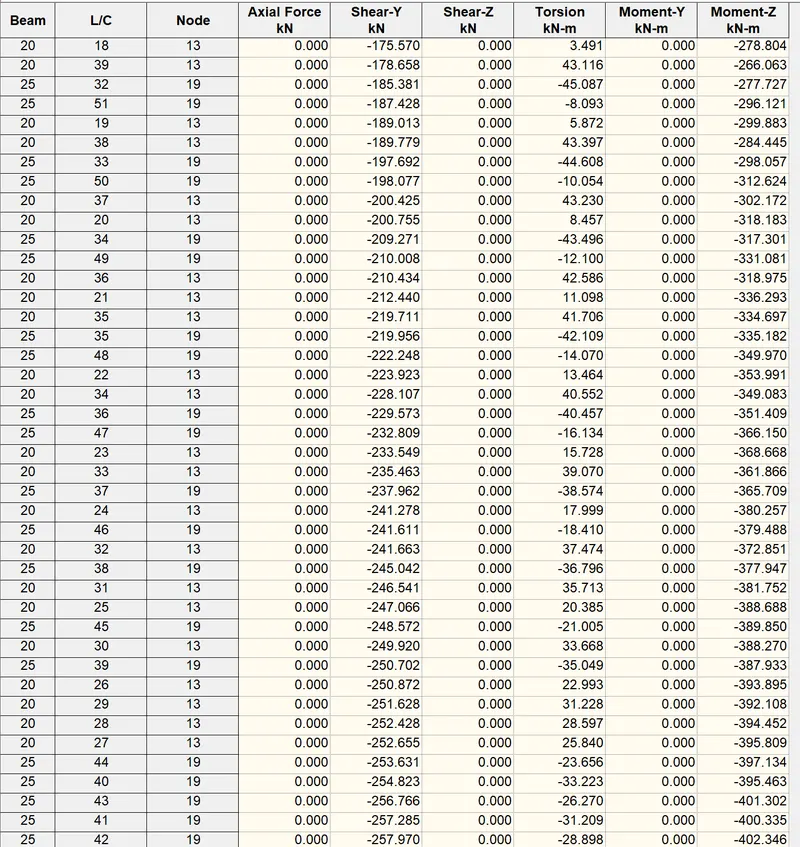
Here also the beam 25 is getting max shear
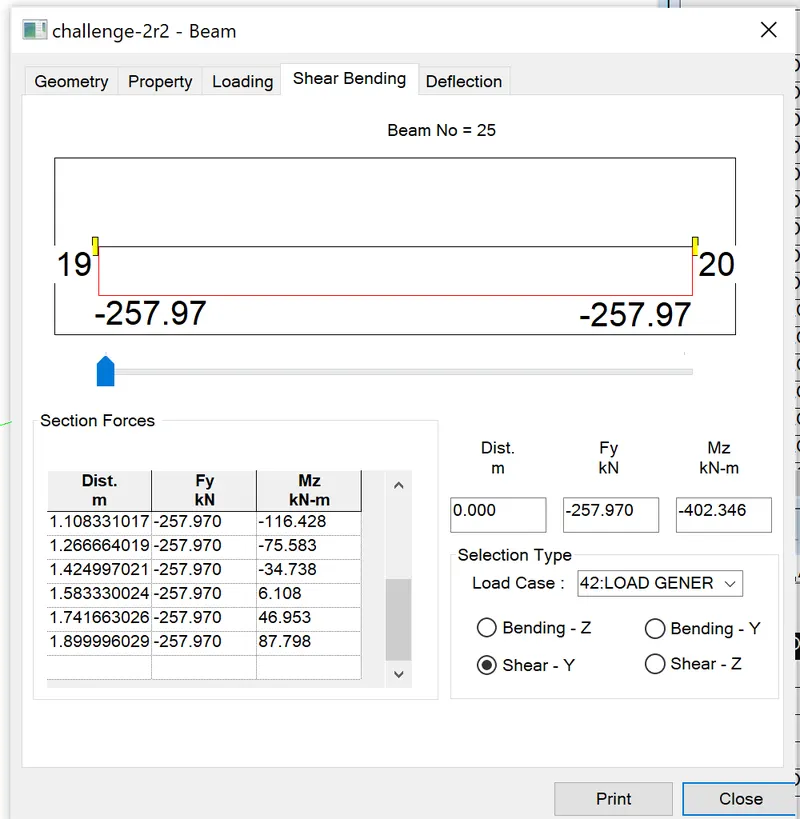
Selecting the particular beam and right click to select the properties and check shear and bending.
for the particular beam and the load case selected, the valued can be seen in the images shown.
********************************************************************
Plate Results.
The pricipal stresses Mx, My
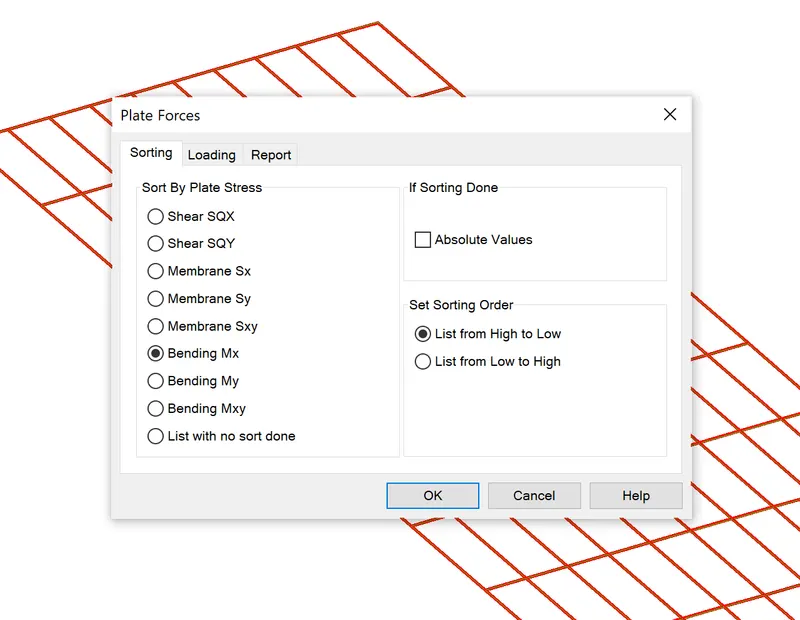
Select the plates, then in the post processing mode check the plate stress, clicking on the bending mx and getting the values.
The following images show the max positive and max negative values.
here SQx, SQy, Sx and Sy are zero.
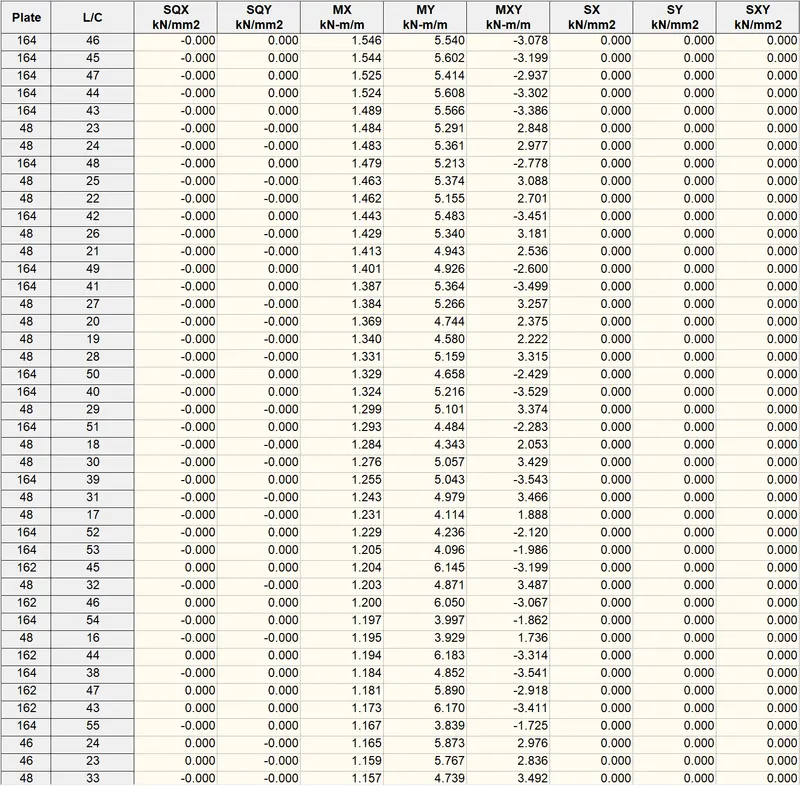
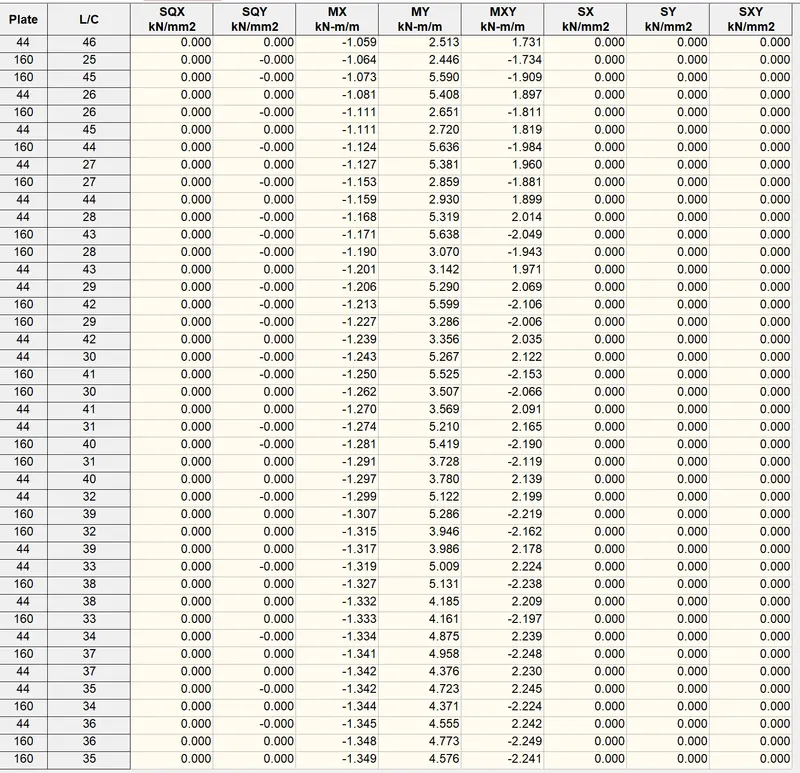
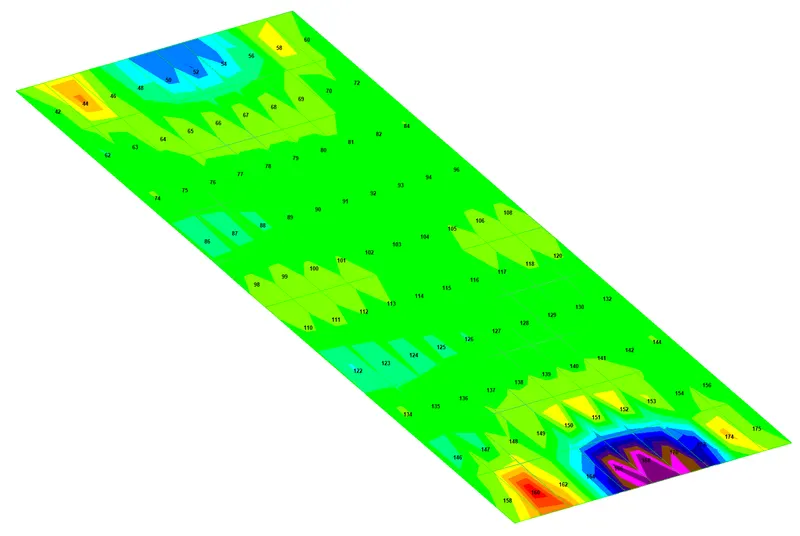
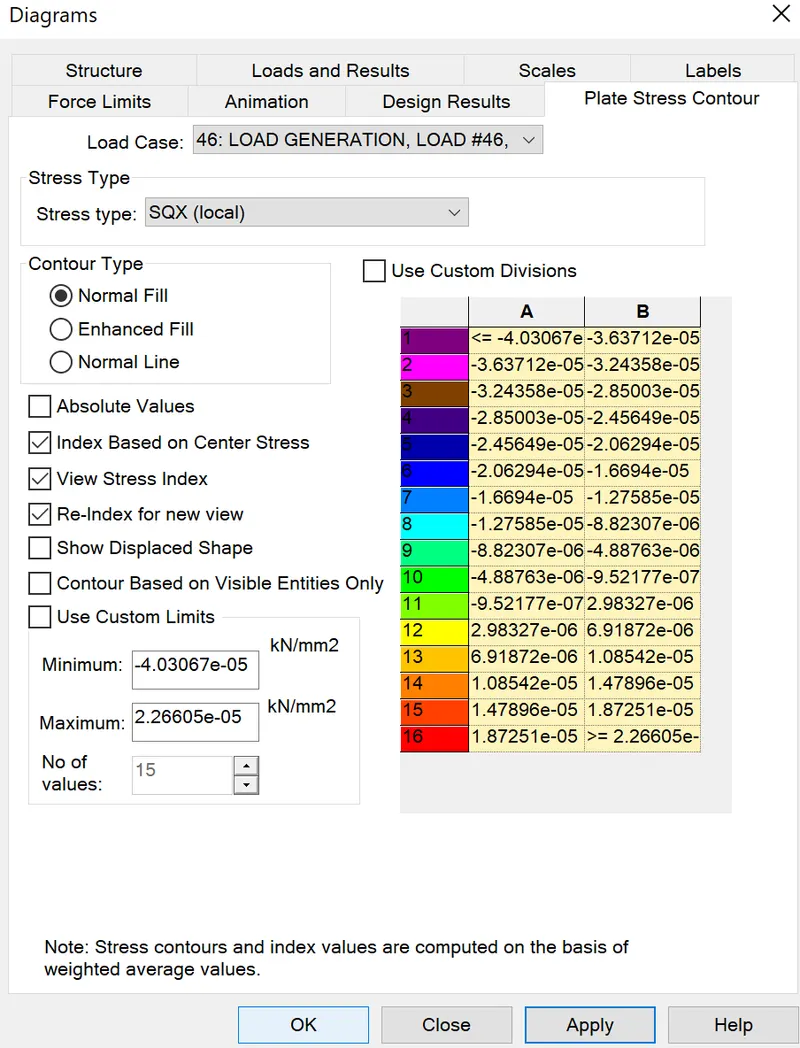
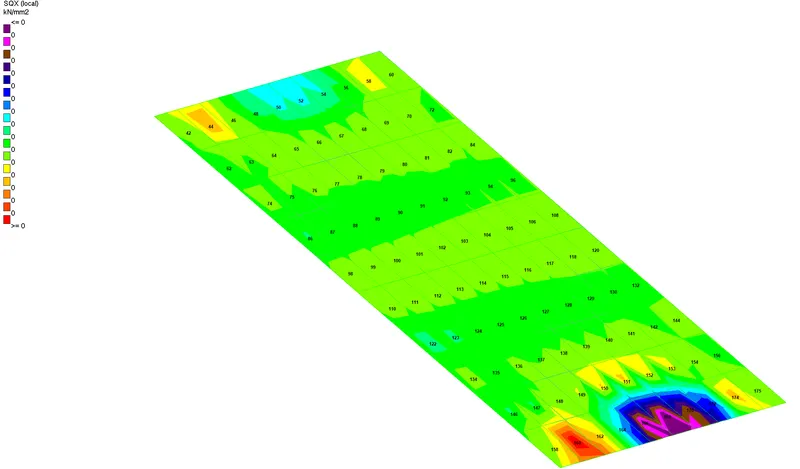
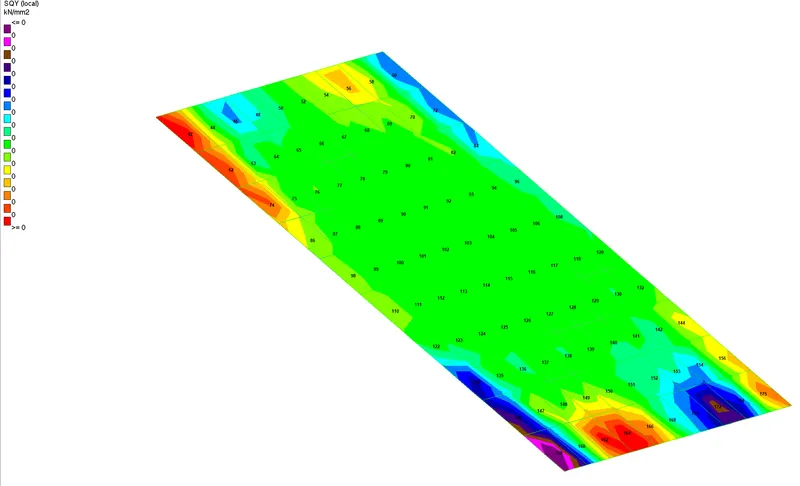
Here plate 164 and load case 46 are getting more stress .
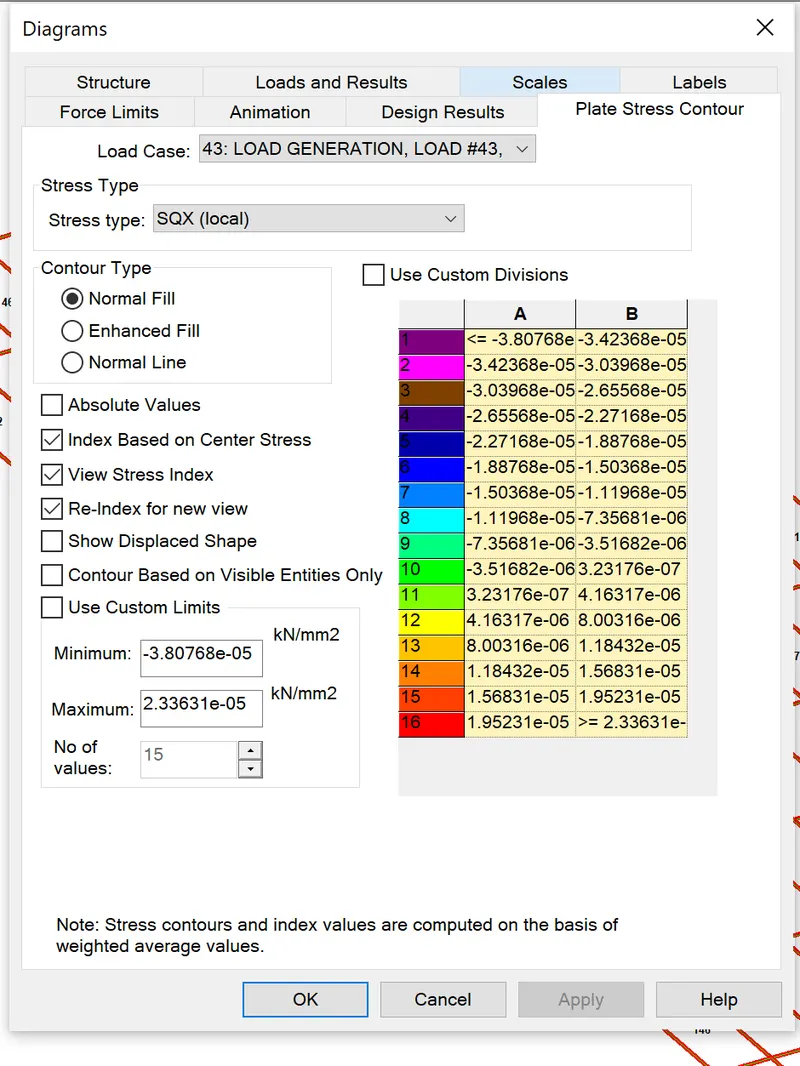
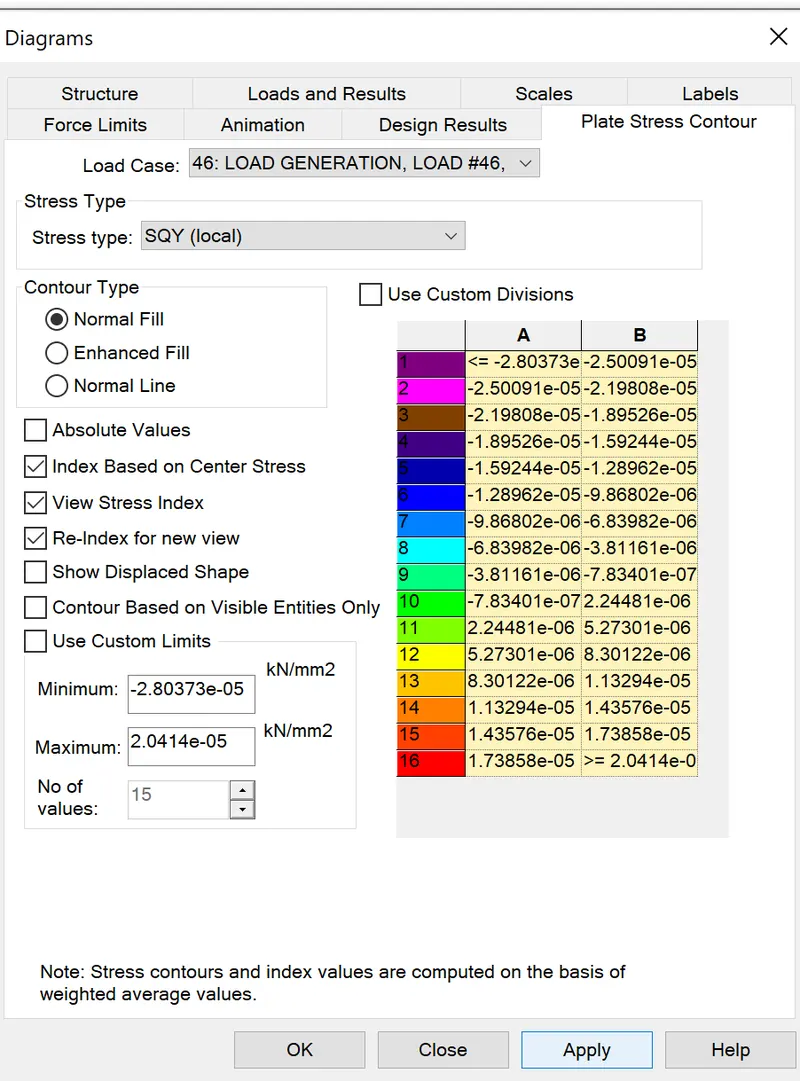
selecting the plates right click and check the structural drawing then plate stress contour, by choosing the particular load case the following stress results and contour images can be obtained