ANSYS Project: Bevel Gear [Grid Dependency Test]
Aim:
To perform Parametric study in Ansys Mechanical for checking the grid dependency of the Bevel Gear Mechanism.
Theory:
Grid Dependency Test
By performing the simulation with refined mesh, or finer mesh, greater is the accuracy of the result but with additional expense on consumption time and consumption power, the Grid Dependency Test is used to determine how the solution depends on the grid size. The core of every FEA or finite element analysis is meshing a component. The fundamental goal of meshing is to change the system's unlimited degree of freedom to a finite degree of freedom. There are a limitless amount of atoms in every component. Therefore, depending on the degree of freedom, there would be an unlimited number of equations to answer if the atoms were used as the calculation points for the equations. However, the outcome would be approximate or close if these calculation points were limited to a certain number of points. FEA works on approximation. The more nodes and elements in a simulation, the more computing time and power are needed to finish it since solutions are interpolated at the nodes to provide an approximation result.
The Grid Dependency Test help in choosing the best mesh size so that correct results are produced while taking into account the time and energy costs. The optimal mesh size obtained is neither too coarse nor fine and further refining the mesh would result in negligible percent change in the result but will increase the computational cost. Mesh refinement, mesh convergence are the other names used to define Grid dependency test.
Bevel Gear
The tooth-bearing sides of bevel gears have a conical form and are located where the axes of the two shafts connect. Although they may be made to function at other angles as well, bevel gears are typically installed on shafts that are 90 degrees apart. A pitch cone is the shape of the pitch surface of a bevel gear. Bevel gears are quite beneficial in machines that are frequently utilized in mechanical settings because they convert linear energy into vertical power.
The most popular varieties of bevel gears are cone-shaped and have pitch angles less than 90 degrees. The teeth of this particular type of bevel gear point outward, thus the name external. The apexes of the pitch surfaces of meshed external bevel gears are located at the junction of the shaft axes, which are coaxial with the gear shafts. Internal bevel gears are bevel gears with teeth that point inward and a pitch angle larger than 90 degrees.
Stress concentration
A stress concentration is a spot in a solid object where the tension is much higher than the surrounding region. Stress concentrations develop when imperfections in the geometry or substance of a structural component disrupt the passage of stress. This is caused by features such as holes, grooves, notches, and fillets. Accidental damage, such as nicks and scratches, can also cause stress concentrations.
A stress concentration factor (`K_t`) is a dimensionless factor that quantifies the concentration of stress in a mechanical component. It is defined as the ratio of the part's peak stress to a reference stress.
A stress concentration, also known as a stress riser/raiser, is a location in a body where the stress is much higher than in the surrounding region. Stress concentrations develop as a result of abnormalities in the geometry or material of a component structure that disrupt the stress flow. These breaks are often caused by discontinuities such as holes, grooves, notches, and fillets. Accidental damage, such as nicks and scratches, can also cause stress concentrations.
Under normal tensile stresses, the degree of concentration of a discontinuity is commonly described by the non-dimensional stress concentration factor (`K_t`), which is the ratio of the maximum stress to the reference (far field) stress:
`K_t=σ_"max"/σ_0=T_"max"/T_0`
Where `sigma_0` and `T_0` are stresses determined by elementary equations and `sigma_"max"` and `T_"max"`are localized stresses at the discontinuities. The subscript `t` denotes the theoretical stress concentration factor. The magnitude of the stress concentration factor depends upon the geometry of the component.
The causes of stress concentration are
- Variation in Properties of Materials
- Load Application
- Abrupt Changes in Section
- Discontinuities in the Component
- Machining Scratches
Objectives:
- Getting ready with the Bevel Gear 3D models developed in Solidworks and importing it into the Ansys Workbench for static structural Analysis.
- Apply Boundary Conditions by setting up the contacts and joints. Also editing the analysis setting for the simulation to take place step by step.
- Determine Total Deformation, Equivalent Strain and Maximum Stress results for the performed simulation.
- Conducting the parametric study of the grid dependency test (different mesh sizes).
Case Explanation:
A static structural analysis is to be conducted for a Bevel gear mechanism of the material Structural Steel. The material property of structural steel is provided below: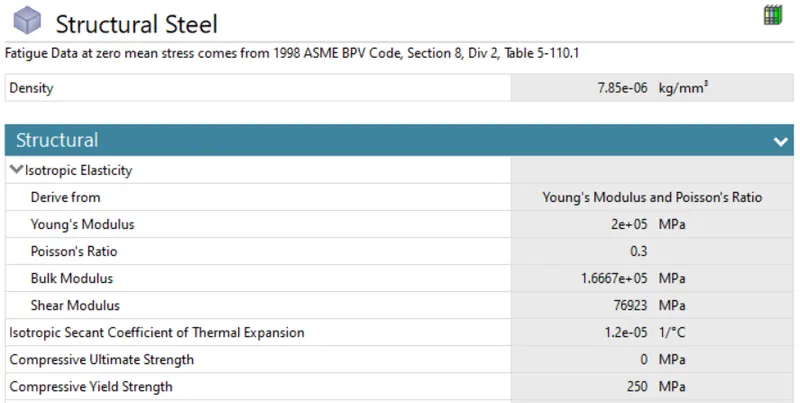
The 3D model of the Spur gear developed in SOLIDWORKS is shown in figure below: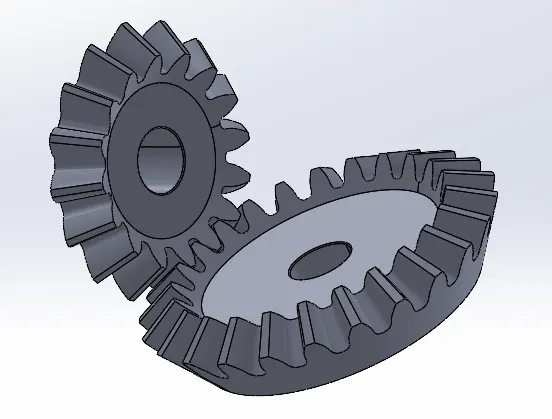
These models are then imported to Ansys Mechanical Static Structural Workbench. In order to reduce the number of elements while meshing, the portions of the Gear (far away from the gear tooth) which are non relevant for the study was removed in Spaceclaim as shown below: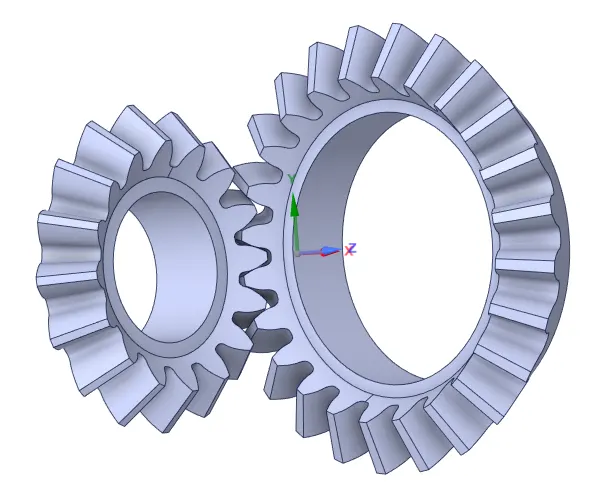
The contacts between the tooths of the two gears were defined as shown in figure below. In order to reduce the time for simulation, the contacts on large side of the tooth were the contact mainly happen was only selected, as seen in figure below: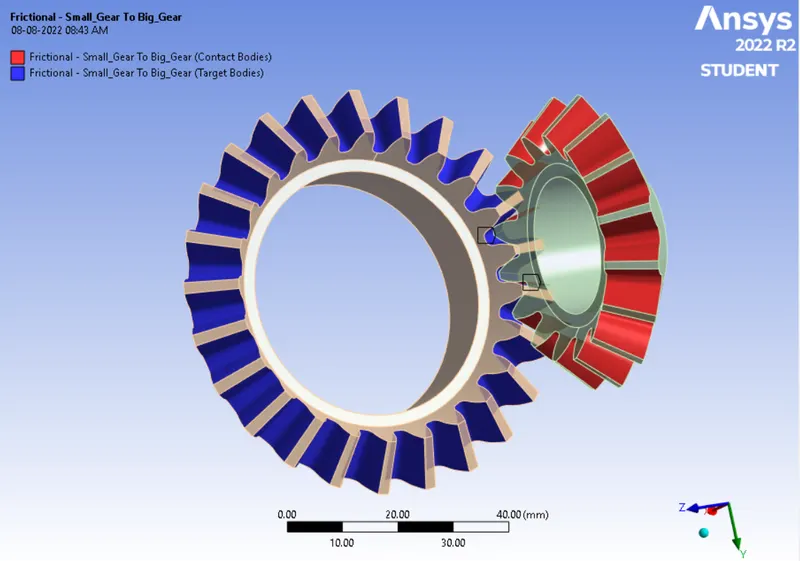
The type of contact selected is frictional and changed the behaviour to symmetric. The Augmented Lagrange formulation was selected in order to avoid the penetration of gear and to provide extra stiffness.
A revolute joint was defined for both gears. Thus, it was created with, connection type as Body-Ground as type of revolute. The inner face of the gear were chosen as scope.
The model is meshed using ANSYS Mesher with an element size of 6.5 mm and an additional Facing sizing was introduced with an element size of 1.75 mm in order have fine meshes at the tooth and to prevent the convergence error while solving. The generated mesh can be seen below: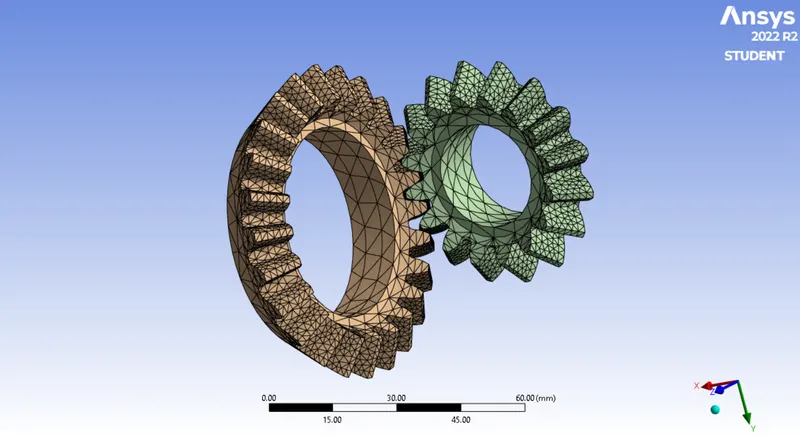

A mesh metric was used to identify elements based on their quality, and it can be observed that the elements of the lowest quality are minimum. The majority of the elements have very high quality values ranging from 9.8633e-002 to 0.9998 with an average value of 0.71785. As a result, the mesh is of reasonable quality.
The analysis setting was modified accordingly and number of steps was changed to 6, step end time as 1 s, auto time steeping on, define by time, carry over time step as off, intial time step as 0.2s, minimum time step as 0.1 s, maximum time step as 1 s. The joint load was then applied to both the gears. The load for the first gear was defined in tabular form in terms of momentum equalling to 10 Nm as shown below:
The joint load to the second gear was then given in terms of the angle of revolution ranging from 0 to 120 degrees as shown below:
The co-ordinate system of the joints were then corrected to ensure that the gears revolve in the required direction as shown below: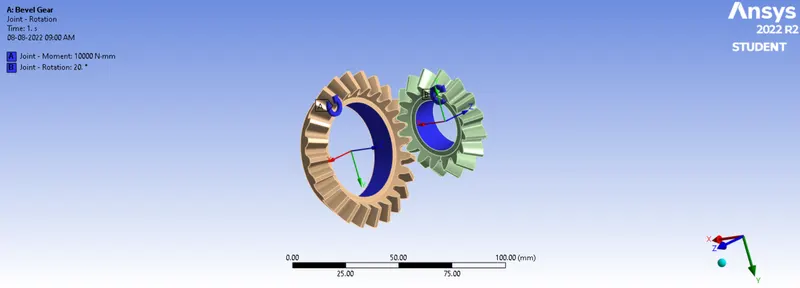
Results:
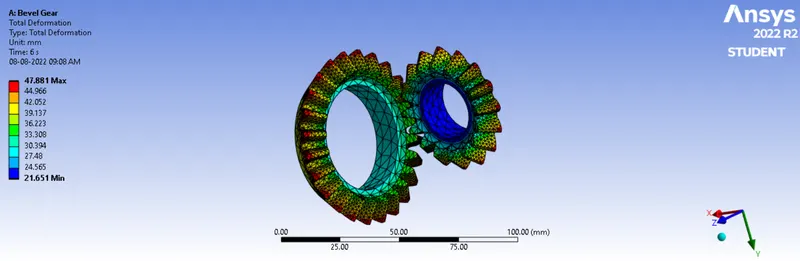
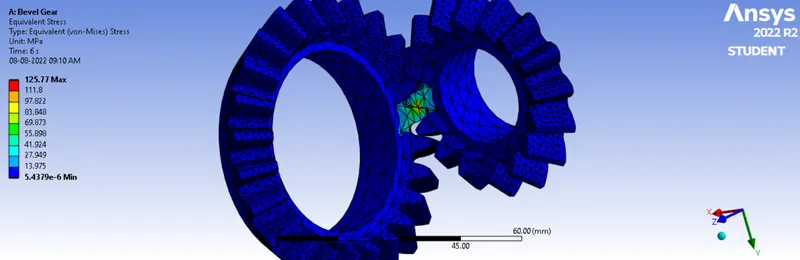
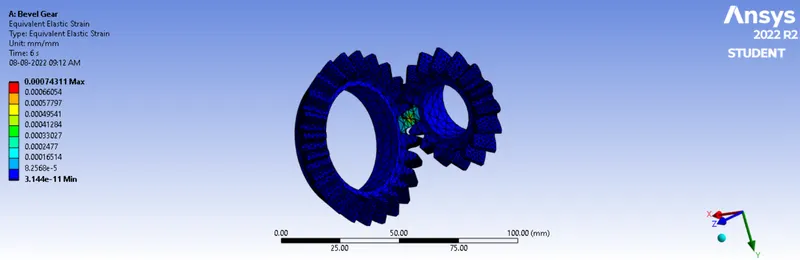
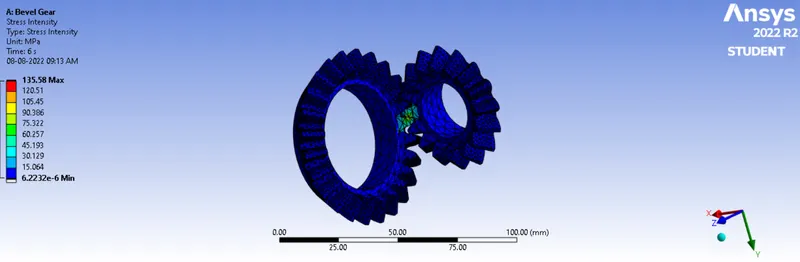
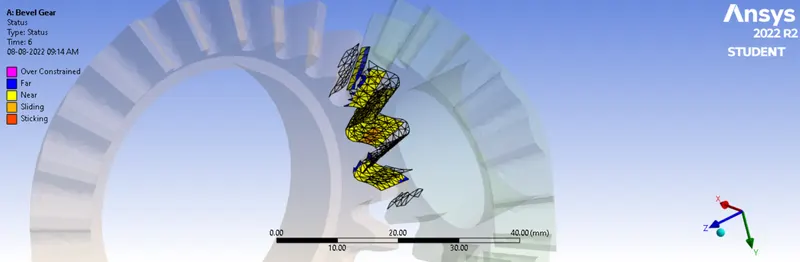
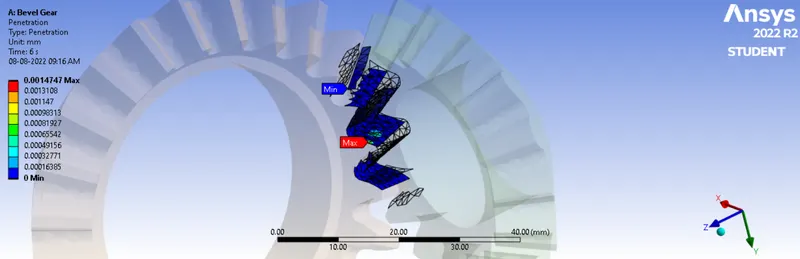
After the simulation of bevel gear mechanism of element size 6.5 mm, the following results were obtained.
- Total Deformation

- Equivalent Stress

- Equivalent Elastic Strain

- Stress Intensity

- Contact Tool: Status
- Contact Tool: Penetration
Then a parametric study was conducted for the grid dependency with the element sizes of 6.5 mm, 5.25 mm, 4 mm and 3.5 mm. The Total Deformation Maximum, Equivalent Elastic Strain Maximum, Equivalent Stress Maximum, Stress Intensity Maximum and Penetration Maximum was found for each element size as shown below:
The parallel parameter plot from the parametric study is shown below. Here, P1: Mesh Element Size, P2: Total Deformation Maximum, P4: Equivalent Elastic Strain Maximum, P5: Elastic Stress Maximum, P6: Stress Intensity Maximum and P7: Penetration Maximum. Each colour shows each design points which is named in the legend.
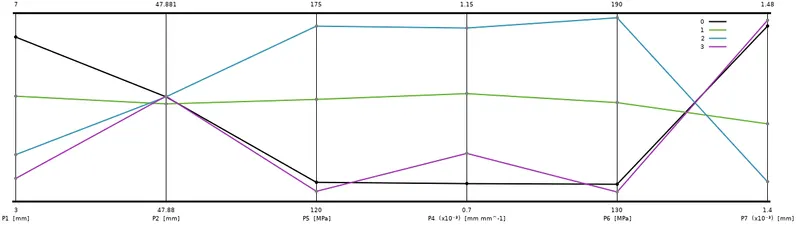
It is found that the values of maximum stress, strain and stress intensity is increasing when the element size is reduced till elemtn size of 4 mm. That is, the quantification of the results are improving with the decrease in element size since the number of elements are increasing. But when the element size is reduced to a value of 3.5, the results are getting worser, which means that the optimum value of element size is 4mm. The 3.5 mm element size simulation requires more time than other simulations, and the result is not satisfactory.
Animations:
- Total Deformation
- Equivalent Stress
- Equivalent Elastic Strain
- Contact Tool: Status
Conclusion:
After refining the mesh from a mesh size of 6.5 mm to a mesh size of 4 mm, there is a noticeable difference in the values till the element size of 4 mm from the values of the Maximum Equivalent Stress and Equivalent Elastic Strains. When the element size is further decreased, the maxiumum values decreased, which means solution ot worser. Therefore, the optimum element size of the simulation is 4 mm, but it takes significant more time than the simulations with larger element size. Since the maximum stress difference between 4mm and 6.5 mm accounts to 35.66%, it is better to go with 4mm size even though it takes more time. The 3.5 mm element size simulation requires the maximum time and produces less accurate solution.