Week 2 : Basic Calibration of Single cylinder SI-Engine
Aim: To run the simulation of a single-cylinder SI Engine at 1800 rpm, to understand and analyze the important parameters, and increase the power output at 3600 rpm by 10%.
Problem Statement :
1. Run the case at 1800 rpm and list down important parameters (20 Marks)
- air flow rate
- BMEP
- BSFC
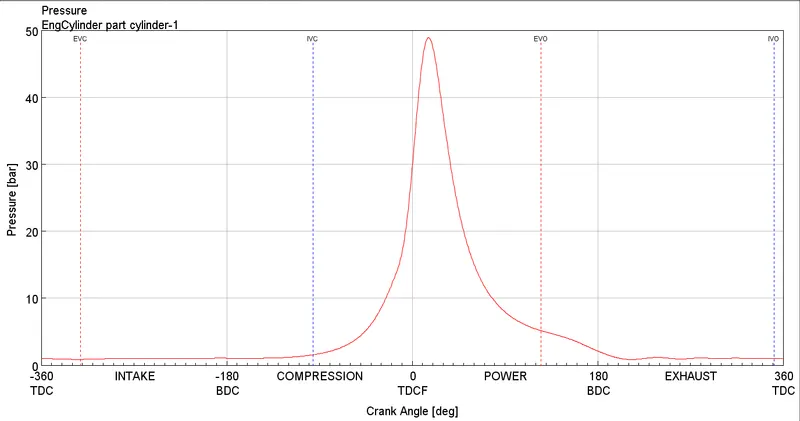
- In-cylinder pressure
2. Increase the power output at 3600 rpm by 10% (30 Marks)
------------------------------------------------------------------------------------------------------------------------------------------------------------------------------------------------------------------
case-1 :
In reality, first, the air- fuel mixture, the air which is extracted from the environment, and the fuel from the fuel tank, is mixed at a specific ratio (A/F ratio) in the carburetor, which runs through the inlet manifold and then introduced into the cylinder through inlet valves(motion governed by the cam), which opens at the suction stroke, is compressed by the piston(during compression stroke), which increases the pressure and temperature of the working fluid, then, spark is used to ignite this mixture which produces power and some exhaust gases, which are let out through the exhaust valve during the exhaust stroke.
To simulate the single cylinder SI Engine, we take the help of tutorials which consists of pre-modelled map of a basic single cylinder SI Engine. The typical layout consists of different components like intake runner, intake port, intake valve, cylinder, etc.
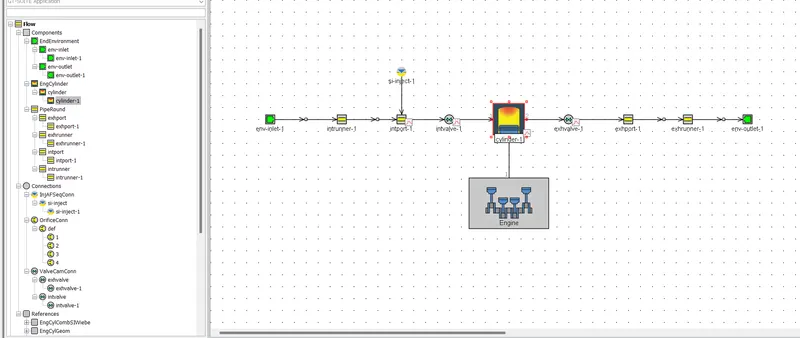
1. Environment-inlet :
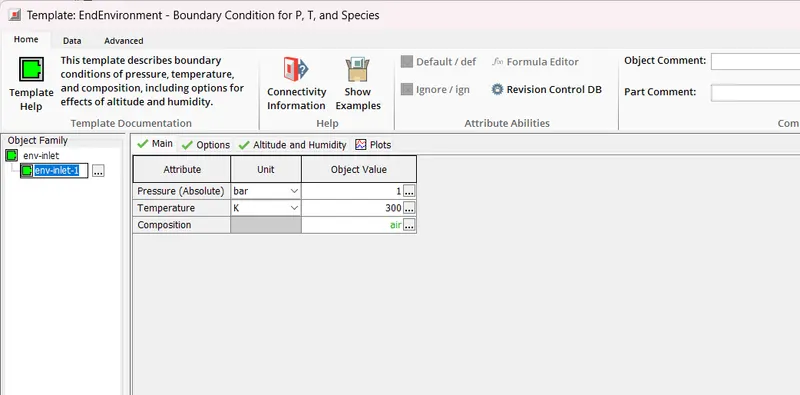
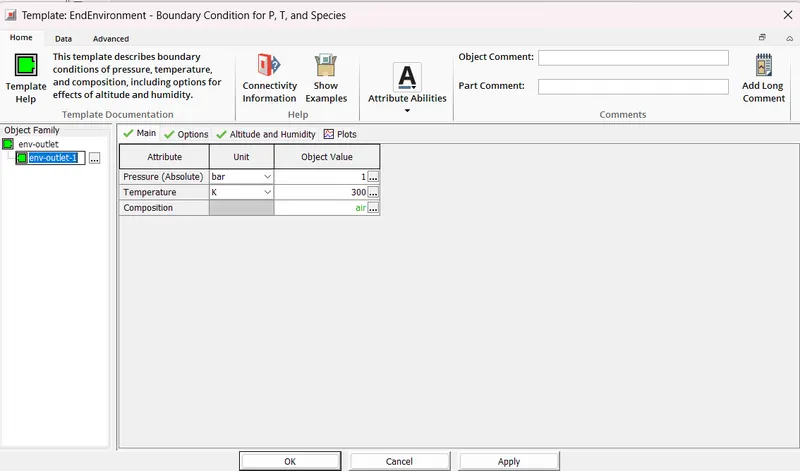
- In GT-Suite, this is modelled 1-dimensionally, the air is extracted from the environment(env-inlet), which is at 1bar atm pressure and 300K temperature.
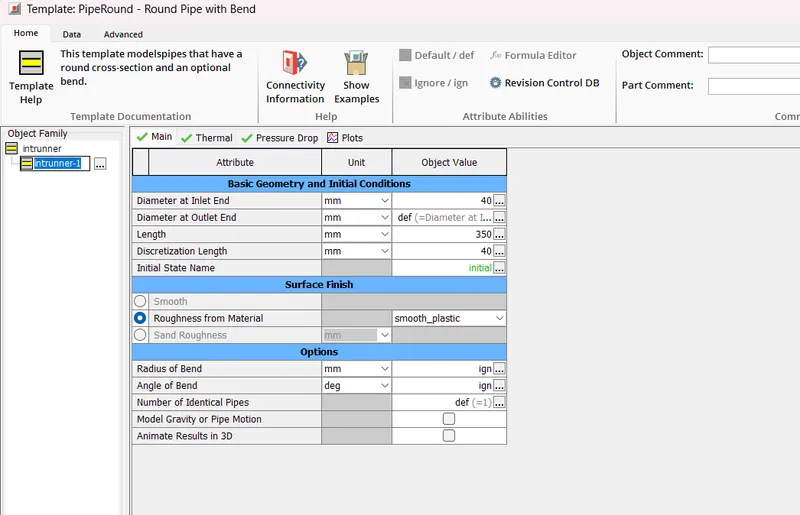
2. Intake Runner:
- And then runs through the intake runner, which is a pipe with geometric paramters [diameter, length(discretization length also),radius of bend, angle of bend,etc,] friction parameter(roughness of material),
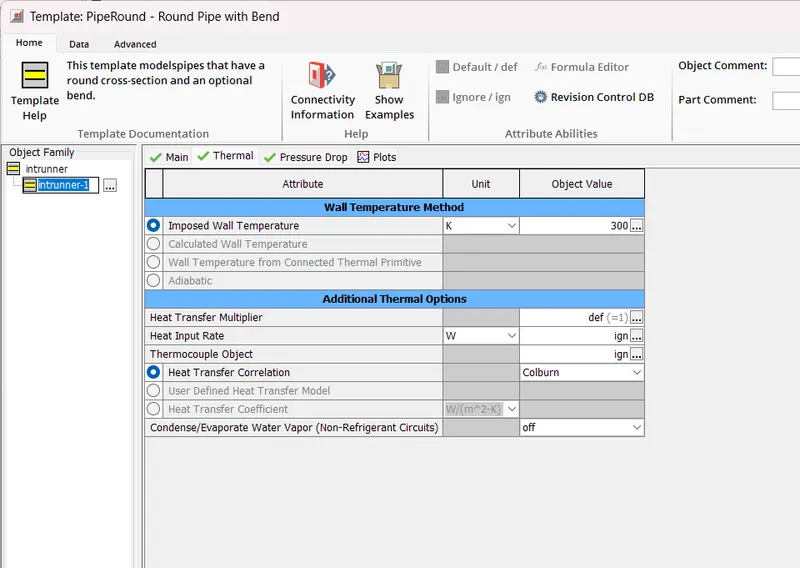
thermal characteristics- imposed wall temperature- Impose a temperature which represents the temperature of the wall surface directly in contact with the fluid. The heat transfer rate between the wall and fluid will be calculated using this imposed wall temperature.
The heat transfer coefficient is calculated using Colburn analogy.
`h_g= (1/2)C_f rho U_(eff) C_p Pr^(-2/3)`
where : hg- heat transfer coeff
Cf- friction factor of pipe
rho- density
Ueff- effective velocity outside boundary layer
Pr- prandtl's number
Cp - specific heat
- Intake port is also a pipe with the above parameters where the fuel is injected.
3. SI Injector :
- SI injector with imposed A/F ratio takes care of injecting the fuel into the port with a specific delivery rate , A/F ratio , timing etc.
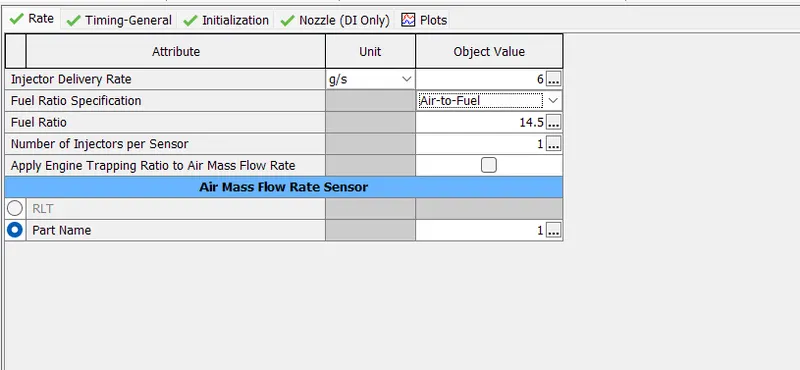
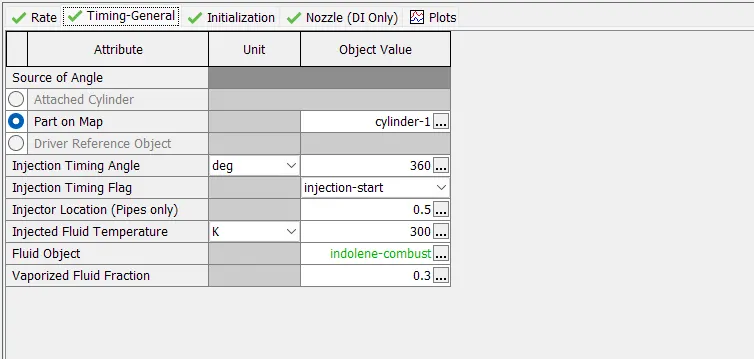
In the timing settings, the source of angle (when the fuel should be injected) is taken from the part cylinder. Fuel is injected when the crank angle is 360 degrees. The fuel is injected exactly at the middle of the pipe. Fluid object is the name of the injected fluid indolene-combust. Fuel properties like heat of vaporization, density, absolute entropy, enthalpy, transport properties are defined in this attribute.
4. Inlet Valve:
- The air-fuel mixture is let into the cylinder when the inlet valve(driven by the cam) opens accordingly based on the geometry, lift profile, and flow characteristics.
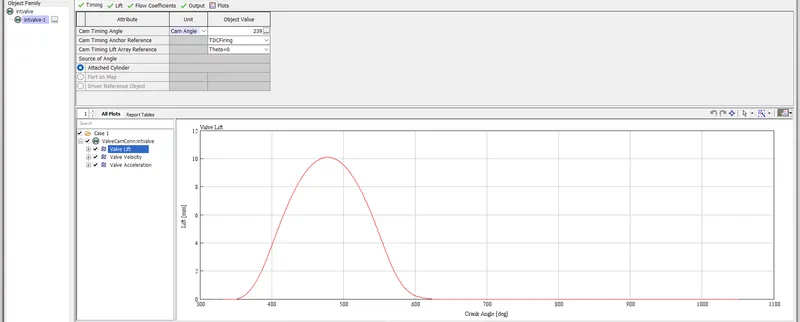
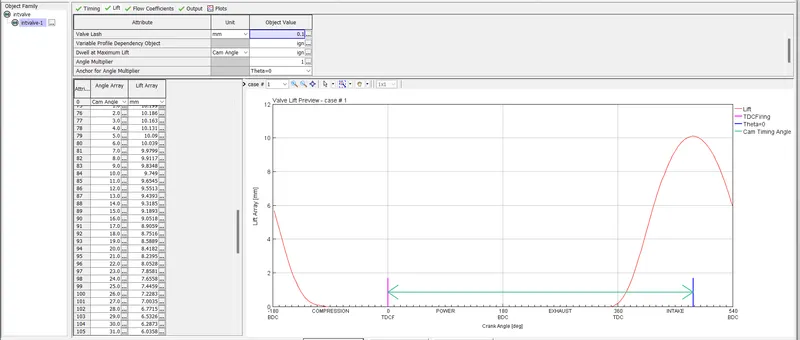
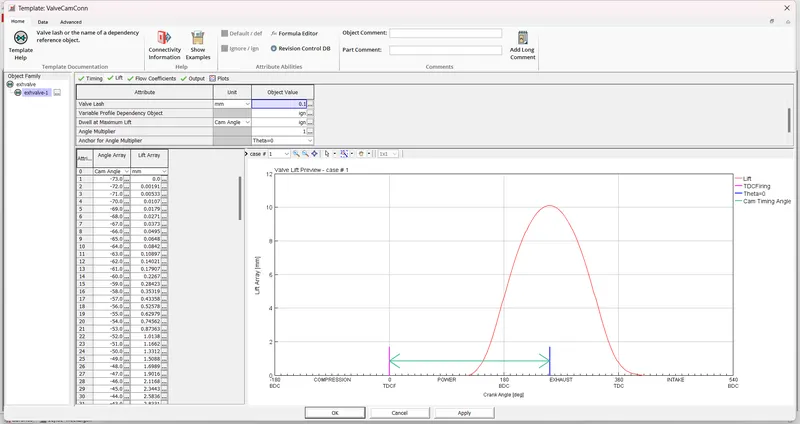
For the inlet valve to open just before the intake stroke, there exists a lift array with respect to the cam angle.
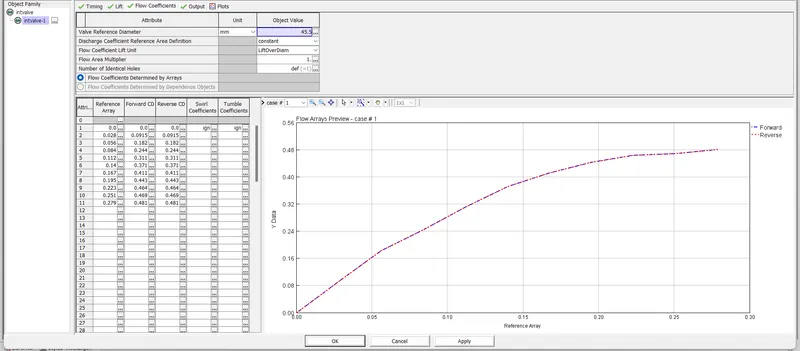
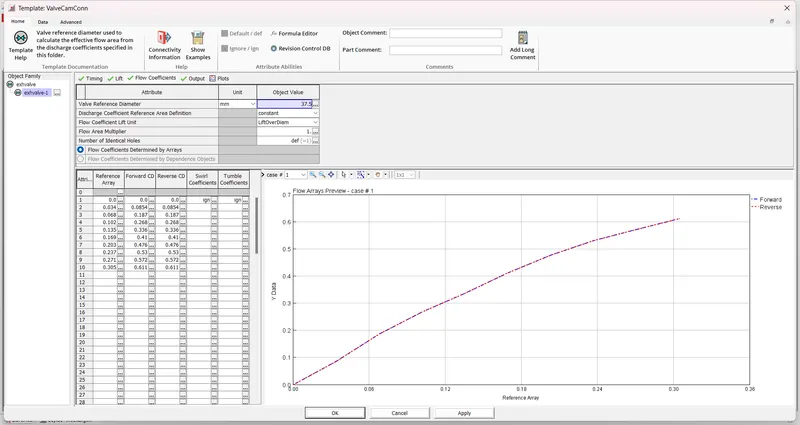
The reference array(valve lift divided by valve reference diameter) vs flow coefficients plot shows that, as the reference value increases i.e, the lift increases the flow coefficient increases as well.
5. Cylinder :
The air-fuel mixture is introduced into the cylinder through the inlet valve, where combustion of the mixture happens during the expansion stroke.
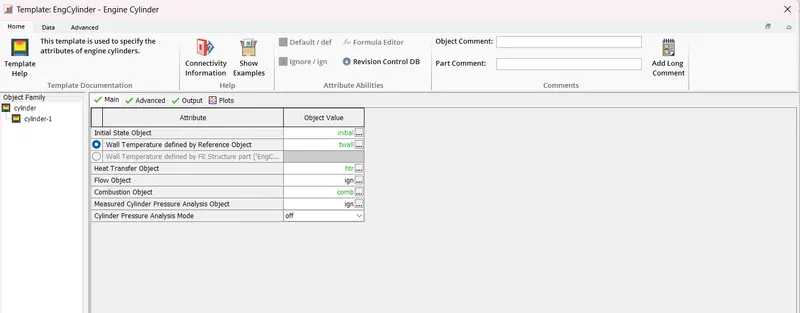
In the cylinder attribute, the initial conditions, wall temperature (head, piston, cylinder temperatures), heat transfer model, combustion model are specified.
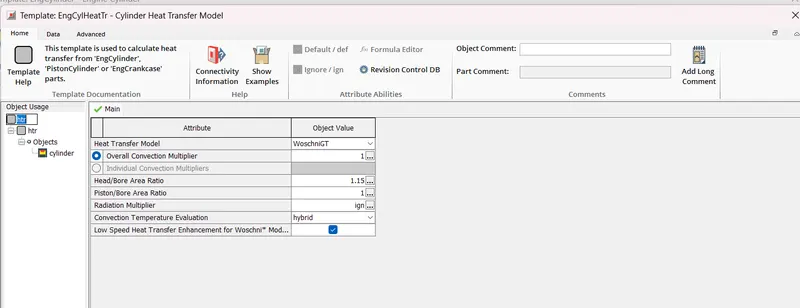
Heat-transfer model - WoschniGT
This model is preferred to calculate the in-cylinder heat transfer coefficients without swirl.
`h_c = (k_1 p^(0.8) w^(0.8))/(B^(0.2) T^(k_2)`
where hc - convective heat transfer coefficient
B- cylinder bore
p- cylinder pressure
T- cylinder temperature
k1 & k2 - constants ( 3.0142 and 0.50 for WoschiniGT)
w - avg cylinder gas velocity
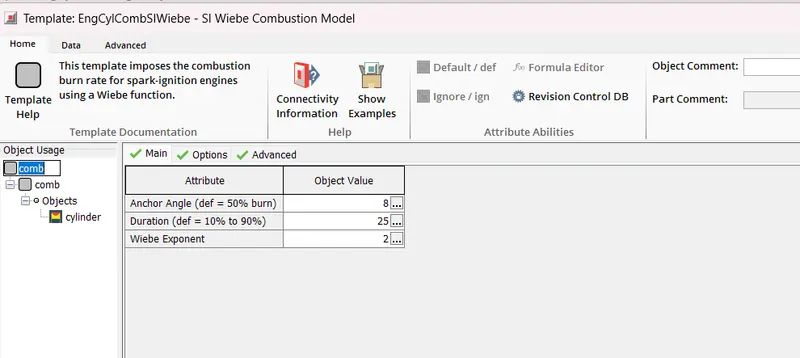
Combustion model - SI Wiebe (non-predictive combustion)
This model imposes a combustion burn rate for spark-ignition engines using a Wiebe function.
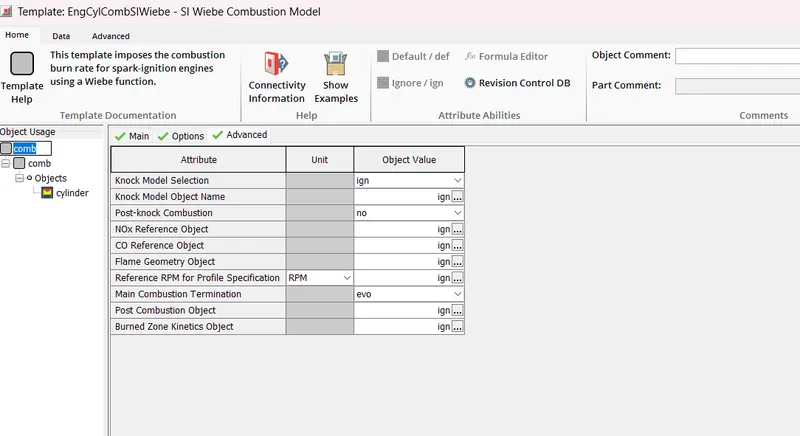
To model the NOx, knock, CO formation, they can be enabled in the advanced attribute.
6. Engine :
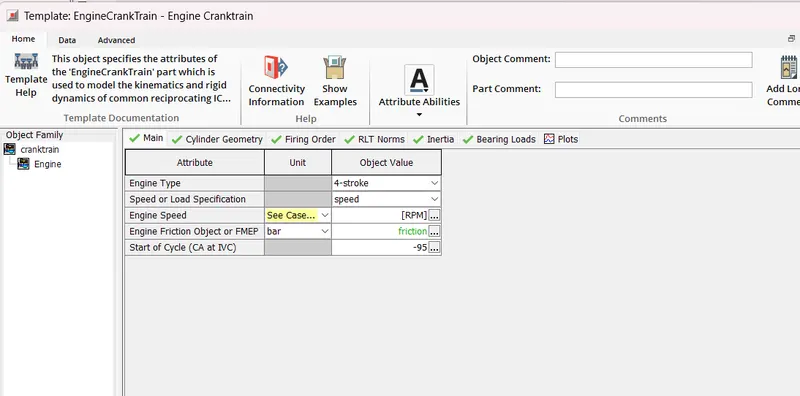
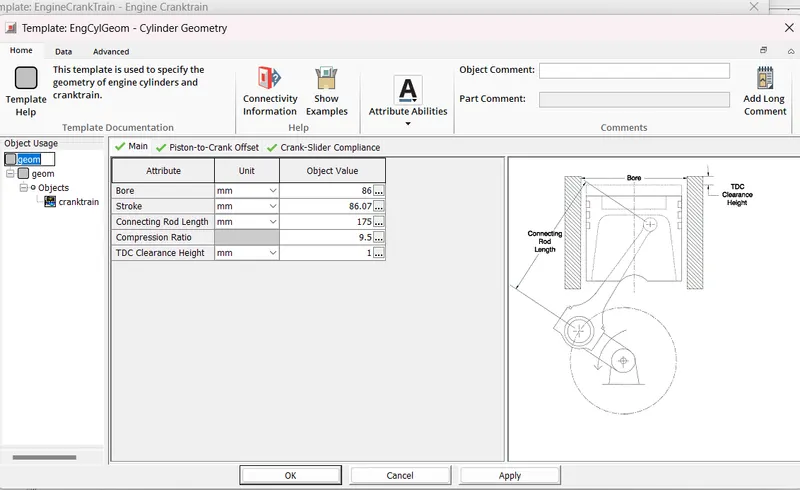
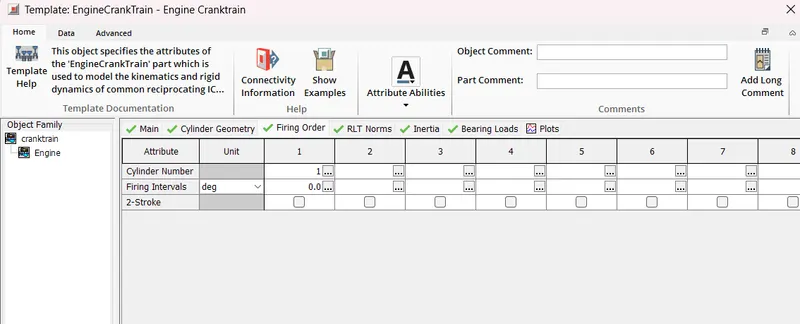
In this attribute, different parameters like engine type, friction model, speed, geometry, firing order etc are specified.
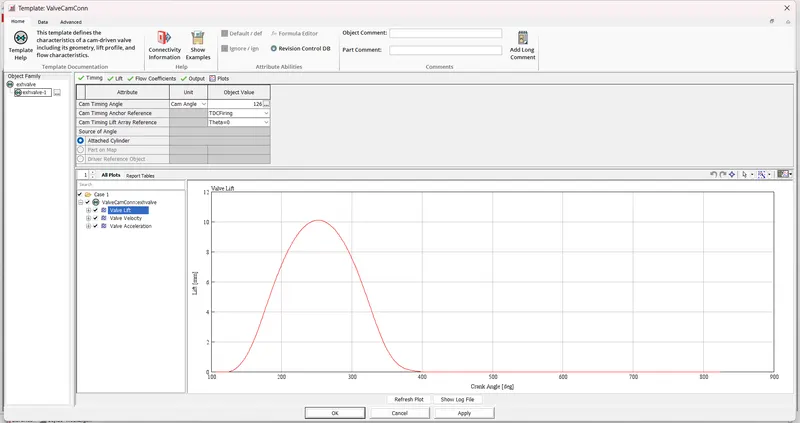
7. Exhaust Valve:
After the expansion stroke, flue gases formed due to combustion are pushed out of the cylinder through the exhaust valve during the exhaust stroke.
8. Exhaust Port :
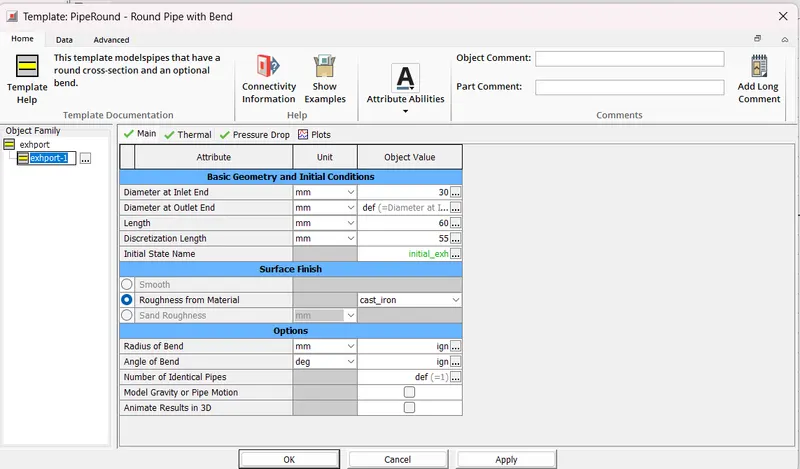
Similar to the intake port, exhaust port is used to let the exhaust gases at high temperature to the atmosphere.
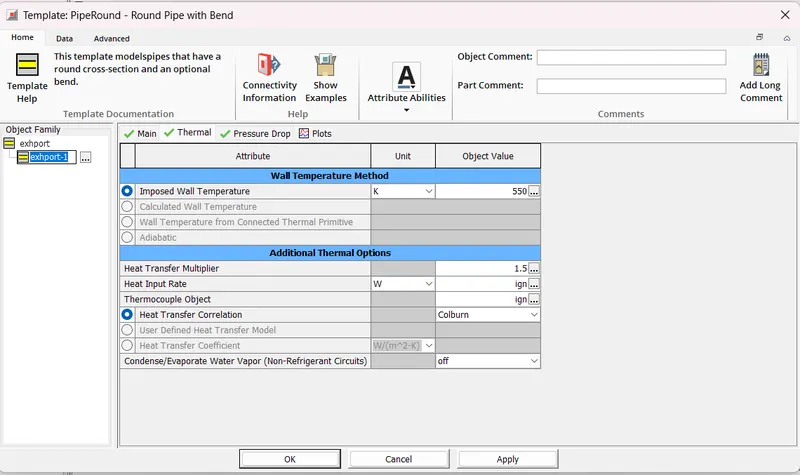
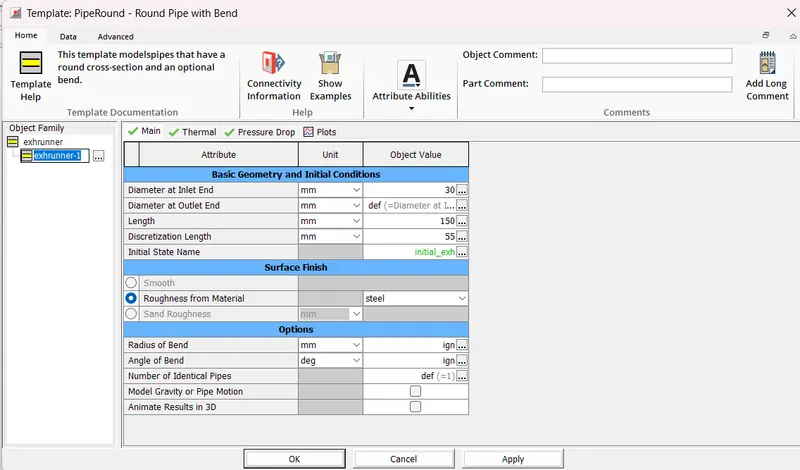
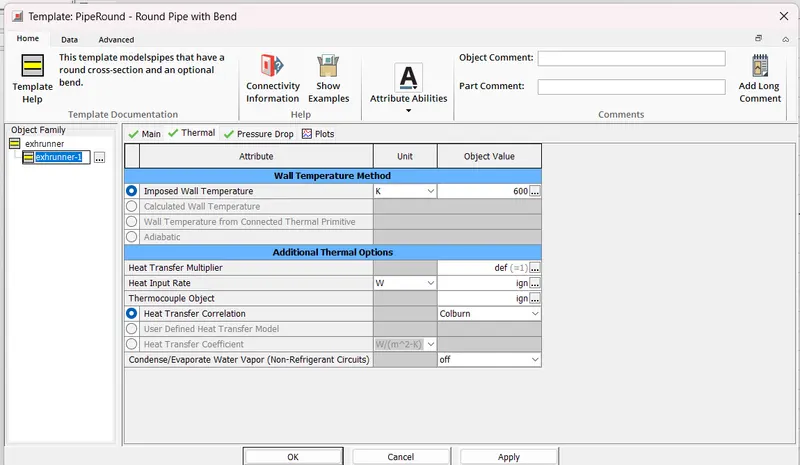
9. Exhaust Runner :
10. Environment-outlet :
After setting up the parameters which simulate the physics, this case is run at 1800rpm.
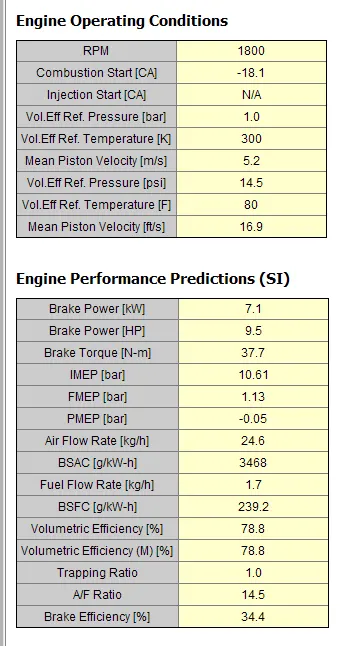
The following engine performance parameters are analysed and understood :
1. Air flow rate - 24.6kg/hr - The mass flow rate of air is calculated by taking into account the A/F ratio and fuel flow rate(defined as the delivery rate(g/s) in SI injector object).
2. Brake Mean Effective Pressure (BMEP) - The average (mean) pressure which, IF imposed on the pistons uniformly from the top to the bottom of each power stroke, would produce the measured (brake) power output.
`BMEP = (2*pi*n*T)/D`
- n = 1 for a two-stroke engine; and
- n = 2 for a four-stroke engine
- T - Brake Torque (N-m)
- D - Engine Displacement (volume)
`D= pi (b/2)^2 l`
D= 500cc
BMEP = 9.475 bar
BMEP can also be calculated by subtracting the friction losses with the the Net Indicated Mean Effective Pressure (which is the average pressure in the cylinders during the complete Thermodynamic cycle)
BMEP = IMEP-FMEP
BMEP = 10.61 - 1.13 = 9.48 bar
3. BSFC - 239.2 g/kW-hr - stands for Brake Specific Fuel Consumption. It tells you how much fuel your engine will use per hour for each horsepower it makes. BSFC changes with engine load and rpm. A lower BSFC value is MORE efficient.
`BSFC = (mf(g/s)) /( P(kW))`
4. In cylinder pressure - The pressure in the engine cylinder during the 4 strokes of engine operation (intake, compression, combustion and expansion, and exhaust).
--------------------------------------------------------------------------------------------------------------------------------------------------------------------------------------------
case-2 Run the simulation at 3600rpm and increase the power output by 10%
Power output of the engine can be increased by changing parameters like cylinder bore, stroke length, compression ratio, A/F ratio.
1. A/F ratio :
| Brake Power [kW] | 16.9 | 16.7 | 15.3 |
| Brake Power [HP] | 22.6 | 22.4 | 20.5 |
| Brake Torque [N-m] | 44.7 | 44.3 | 40.5 |
| IMEP [bar] | 12.97 | 12.85 | 11.89 |
| FMEP [bar] | 1.73 | 1.72 | 1.71 |
| PMEP [bar] | -0.34 | -0.34 | -0.32 |
| Air Flow Rate [kg/h] | 58.8 | 58.6 | 58.3 |
| BSAC [g/kW-h] | 3486 | 3509 | 3819 |
| Fuel Flow Rate [kg/h] | 4.5 | 4 | 3.6 |
| BSFC [g/kW-h] | 267.9 | 241.8 | 238.6 |
| Volumetric Efficiency [%] | 94 | 93.6 | 93.2 |
| Volumetric Efficiency (M) [%] | 94 | 93.6 | 93.2 |
| Trapping Ratio | 1 | 1 | 1 |
| A/F Ratio | 13.01 | 14.51 | 16.01 |
| Brake Efficiency [%] | 30.8 | 34.1 | 34.5 |
The A/F ratio is changed from 14.5 to 13(rich) and 16(lean). Air is the limiting factor in the combustion reaction, so increasing the amount of air(lean mixture) leads to better power output. But in our case to maintain the A/F ratio of 16, the fuel flow rate also decreases which thereby decreases the power output. So, a slight rich mixture is preferred.
2. Compression ratio :
Usually, the compression ratio for SI engines varies from 8 to 12.
| Compression Ratio | 8 | 9.5 | 11 | 12 |
| Brake Power [kW] | 16.1 | 16.9 | 17.4 | 17.7 |
| Brake Power [HP] | 21.6 | 22.6 | 23.3 | 23.7 |
| Brake Torque [N-m] | 42.8 | 44.7 | 46.2 | 46.9 |
| IMEP [bar] | 12.44 | 12.97 | 13.38 | 13.59 |
| FMEP [bar] | 1.69 | 1.73 | 1.77 | 1.8 |
| PMEP [bar] | -0.35 | -0.34 | -0.33 | -0.32 |
| Air Flow Rate [kg/h] | 59.2 | 58.8 | 58.5 | 58.3 |
| BSAC [g/kW-h] | 3673 | 3486 | 3358 | 3294 |
| Fuel Flow Rate [kg/h] | 4.6 | 4.5 | 4.5 | 4.5 |
| BSFC [g/kW-h] | 282.2 | 267.8 | 258 | 253.1 |
| Volumetric Efficiency [%] | 94.7 | 94 | 93.4 | 93.2 |
| Volumetric Efficiency (M) [%] | 94.7 | 94 | 93.4 | 93.2 |
| Trapping Ratio | 1 | 1 | 1 | 1 |
| A/F Ratio | 13.01 | 13.02 | 13.02 | 13.02 |
| Brake Efficiency [%] | 29.2 | 30.8 | 31.9 | 32.5 |
Compression ratio = maximum cylinder volume/ minimum cylinder volume
When the compression ratio increases, the maximum cylinder volume increases or minimum cylinder volume decreases or both, which allows more amount of air-fuel mixture in the cylinder and thus extract more energy.
3. Cylinder Bore and Stroke length :
As the size of the cylinder increases (bore or stroke) the power increases. But bore/stroke ratio ranging from 0.8 to 1.2 has to be maintained.
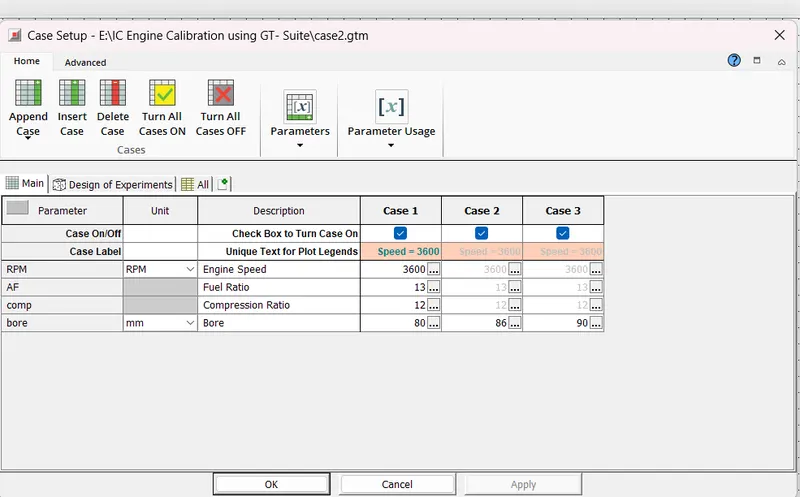
a. Cylinder bore is changed from 86 to 80 and 90.
| Bore [mm] | 80 | 86 | 90 |
| Stroke [mm] | 86.1 | 86.1 | 86.1 |
| Bore/Stroke | 0.929 | 0.999 | 1.046 |
| Compression Ratio | 12 | 12 | 12 |
| Brake Power [kW] | 15 | 17.7 | 19.5 |
| Brake Power [HP] | 20.1 | 23.7 | 26.2 |
| Brake Torque [N-m] | 39.7 | 46.9 | 51.8 |
| IMEP [bar] | 13.31 | 13.59 | 13.69 |
| FMEP [bar] | 1.79 | 1.8 | 1.8 |
| PMEP [bar] | -0.24 | -0.32 | -0.39 |
| Air Flow Rate [kg/h] | 49.2 | 58.3 | 64.5 |
| BSAC [g/kW-h] | 3292 | 3294 | 3303 |
| Fuel Flow Rate [kg/h] | 3.8 | 4.5 | 5 |
| BSFC [g/kW-h] | 253 | 253.1 | 253.7 |
| Volumetric Efficiency [%] | 91 | 93.2 | 94.1 |
| Volumetric Efficiency (M) [%] | 91 | 93.2 | 94.1 |
| Trapping Ratio | 1 | 1 | 1 |
| A/F Ratio | 13.01 | 13.02 | 13.02 |
| Brake Efficiency [%] | 32.6 | 32.5 | 32.5 |
When the cylinder bore is changed to 90mm, the power output increases more than 10% of the initial power produced (16.7 kW)
So, other parameters like stroke length can also be changed for higher power outputs.
Conclusion :
1. The engine simulation was run at 1800rpm (case1) and the important performance parameters have been analysed and understood.
2. The engine simulation was run at 3600rpm (case2) and the power output has been increased by more than 10% by changing various parameters like A/F ratio, compression ratio, cylinder bore and stroke length.