Week 2 Air standard Cycle
Program:
import numpy as np
import matplotlib.pyplot as plt
# Constants
gamma = 1.4 # specific heat ratio for air
R = 0.287 # kJ/kg.K, specific gas constant for air
# Input parameters
compression_ratio = 8 # r = V1/V2
p1 = 100 # kPa
T1 = 300 # K
T3 = 2300 # K (peak temperature after combustion)
# State 1
v1 = 0.0005 # m^3 (initial volume)
v2 = v1 / compression_ratio
# Isentropic Compression (1 -> 2)
T2 = T1 * (compression_ratio)**(gamma - 1)
p2 = p1 * (compression_ratio)**gamma
# Constant Volume Heat Addition (2 -> 3)
v3 = v2
p3 = p2 * T3 / T2
T3 = T3
# Isentropic Expansion (3 -> 4)
v4 = v1
T4 = T3 * (1 / compression_ratio)**(gamma - 1)
p4 = p3 * (1 / compression_ratio)**gamma
# Constant Volume Heat Rejection (4 -> 1)
# returns to initial state
# Compute points for isentropic processes
def isentropic_process(p_start, v_start, v_end, gamma):
v = np.linspace(v_start, v_end, 100)
p = p_start * (v_start / v) ** gamma
return v, p
# Process 1-2 (Isentropic Compression)
v_12, p_12 = isentropic_process(p1, v1, v2, gamma)
# Process 2-3 (Constant Volume Heat Addition)
v_23 = [v2, v3]
p_23 = [p2, p3]
# Process 3-4 (Isentropic Expansion)
v_34, p_34 = isentropic_process(p3, v3, v4, gamma)
# Process 4-1 (Constant Volume Heat Rejection)
v_41 = [v4, v1]
p_41 = [p4, p1]
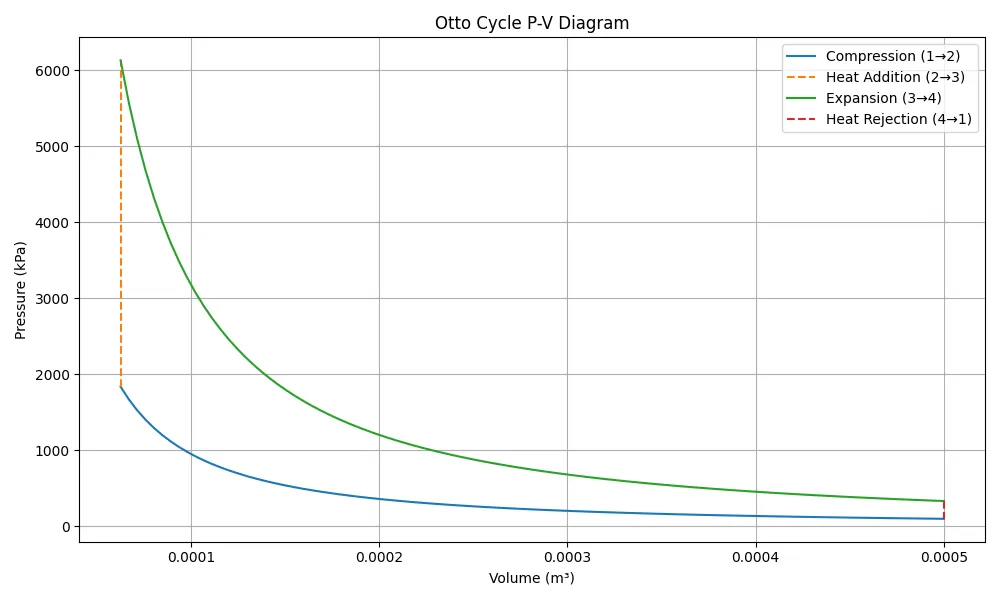
# Plotting the PV diagram
plt.figure(figsize=(10, 6))
plt.plot(v_12, p_12, label='Compression (1→2)')
plt.plot(v_23, p_23, label='Heat Addition (2→3)', linestyle='--')
plt.plot(v_34, p_34, label='Expansion (3→4)')
plt.plot(v_41, p_41, label='Heat Rejection (4→1)', linestyle='--')
plt.xlabel('Volume (m³)')
plt.ylabel('Pressure (kPa)')
plt.title('Otto Cycle P-V Diagram')
plt.grid(True)
plt.legend()
plt.tight_layout()
plt.show()
# Thermal Efficiency of Otto Cycle
efficiency = 1 - (1 / compression_ratio ** (gamma - 1))
print(f"Thermal Efficiency of Otto Cycle: {efficiency * 100:.2f}%")
Output: