Otto Cycle- Engine Kinematics
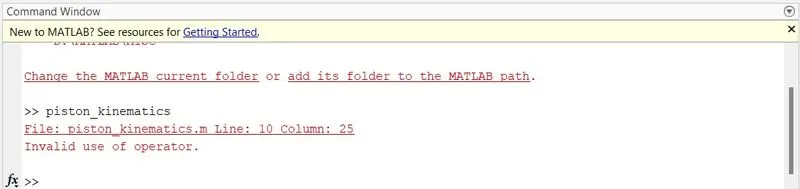
function [V] = piston_kinematics(bore,stroke,con_rod,cr,start_crank,end_crank)
a = stroke/2;
R = con_rod/a;
v_s = (pi/4)*bore^2*stroke;
v_c = v_s/(cr-1);
theta = linspace(start_crank,end_crank,180);
term1 = 0.5*(cr-1);
term2 = R+1-cosd(theta);
term3 = (R^2-sind(theta).^2).^0.5;
V = (1+ term1 * (term2 - term3)).* v_c;
end
clear all % Clears the Workspace
close all % Close all the Tabs
clc % Clears the Command Window
% Input parameters
gamma = 1.4;
t3 = 2000;
% State variables at point 1
p1 = 101325; % Pressure at State point 1
t1 = 500; % Temperature at State point 2
% Engine Geometric properties
bore = 0.1;
stroke = 0.1;
con_rod = 0.15;
cr = 12;
% Swept Volume & Clearance Volume
v_s = (pi/4)*bore^2*stroke;
v_c = v_s/(cr-1);
% Total volume(v1) & Volume at TDC (v2)
v1 = v_s+v_c;
v2 = v_c;
% State Variables at point 2
% p2v2^gamma = p1v1^gamma
p2 = p1*cr^gamma; % Here (v1/v2)=cr
% p2v2/t2 = p1v1/t1
t2 = p2*v2*t1/(p1*v1);
const_c1 = p1*v1^gamma;
V_compression = piston_kinematics(bore,stroke,con_rod,cr,180,0);
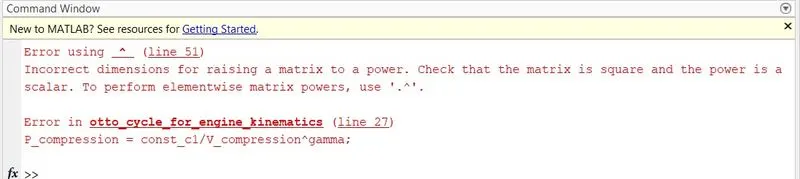
P_compression = const_c1./V_compression.^gamma;
% State Variables at point 3
v3 = v2;
% p3v3/t3 = p2v2/t2
p3 = p2*t3/t2;
const_c2 = p3*v3^gamma;
V_expansion = piston_kinematics(bore,stroke,con_rod,cr,0,180);
P_expansion = const_c2./V_expansion.^gamma;
% State variables at point 4
v4 = v1;
% p4v4^gamma = p3v3^gamma
p4 = p3*(v3/v4)^gamma;
% p4v4/t4 = p3v3/t3
t4 = p4*v4*t3/(p3*v3);
% Thermal Efficiency
thermal_efficiency = 1-(1/(cr^gamma-1));
fprintf('Thermal Efficiency = %1.4f',thermal_efficiency);
% Plotting
figure(1)
hold on
%plot(v1,p1,'x','color','k');
% Plot for Isentropic Compression Process
plot(V_compression,P_compression,'linewidth',2,'color','r');
%plot(v2,p2,'x','color','k');
% Plot for Constant Volume Heat Addition Process
plot([v2 v3],[p2 p3],'linewidth',2,'color','b');
%plot(v3,p3,'x','color','k');
% Plot for Isentropic Expansion Process
plot(V_expansion,P_expansion,'linewidth',2,'color','y');
%plot(v4,p4,'x','color','k');
% Plot for Constant Volume Heat Rejection Process
plot([v4 v1],[p4 p1],'linewidth',2,'color','c');
legend('Isentropic Compression','Constant Volume Heat Addition','Isentropic Expansion','Constant Volume Heat Rejection');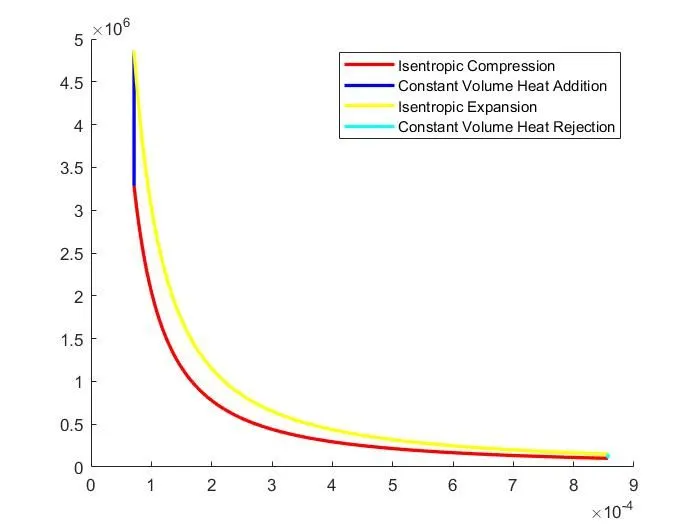
https://drive.google.com/file/d/1ngbCewA3wLLMl4twm2WUXv_n9HrzQekl/view?usp=drivesdk
https://drive.google.com/file/d/1nfbown3Ak2JCWu56UNRWkPLPq3SX--5i/view?usp=drivesdk