Week 2 Air standard Cycle
AIM -
Creating a PV diagram and finding output the thermal efficiency of the engine.
code -
import math
import matplotlib.pyplot as plt

# defining bore, stroke,connecting rode length (con_rod), compression ratio (cr), starting (start_crank) & ending (end_crank) of crank
def engine_kinematics(bore, stroke, con_rod, cr, start_crank, end_crank):

    a = stroke/2                                                  # a = crank pin radius
    R = con_rod/a                                                 # R = constant

    v_s = math.pi* (1/4) * pow(bore,2) * stroke                  # v_s = swept volume
    v_c = v_s/(cr-1)                                            # v_c = clearance volume

    sc = math.radians(start_crank)                             # sc = start crank angle in radians
    ec = math.radians(end_crank)                                # ec = end crank angle in radians

    num_values = 50

    dtheta = (ec - sc)/(num_values-1)                                    # calculating equal 50  intervals between sc & ec

    V = []

    for i in range(0,num_values):
        theta = sc + i * dtheta                                           # to find volume trace equation sliptted to 3 terms
        term1 = 0.5 * (cr-1)
        term2 = R + 1- math.cos(theta)
        term3 = pow(R,2) - pow(math.sin(theta),2)
        term3 = pow(term3 , 0.5)

        V.append((1 + term1 * (term2 - term3)) * v_c)                      # equation to find volume trace to finish otto cycle graph

    return V

p1 = 101325
t1 = 500
g = 1.4
t3 = 2300

# engine geometric parameters
bore = 0.1
stroke = 0.1
con_rod = 0.5                                                                # con_rod = connecting rod length
cr = 12                                                                      # cr = compression ratio

v_s = (math.pi/4) * pow(bore,2) * stroke
v_c = v_s/(cr-1)
v1 = v_c + v_s

v2 = v_c                                                                     # state point 2

# p2v2^g = p1v1^g
p2 = p1 * pow(v1,g)/pow(v2,g)

# p1v1/t1 = p2v2/t2
rhs = p1 * v1/t1
t2 = p2 * v2/rhs
V_comp = engine_kinematics(bore, stroke, con_rod, cr, 180, 0)

constant = p1 * pow(v1,g)

P_comp = []


for V in V_comp:
    P_comp.append(constant/pow(V,g))

v3 = v2                                                                      # state point 3

# p3v3/t3 = p2v2/t2
rhs = p2 * v2/t2
p3 = rhs * t3/v3

V_exp = engine_kinematics(bore, stroke, con_rod, cr, 0, 180)

constant = p3 * pow(v3,g)

P_exp = []


for V in V_exp:
    P_exp.append(constant/pow(V,g))

v4 = v1                                                 # state point 4

# p4v4^g = p3v3^g
p4 = p3 *pow(v3,g)/pow(v4,g)

# p4v4/t4 = rhs
t4 = p4 * v4/rhs

t_eff = 1 -(1/pow(cr,(g-1)))                            # themal efficiency
print(t_eff)

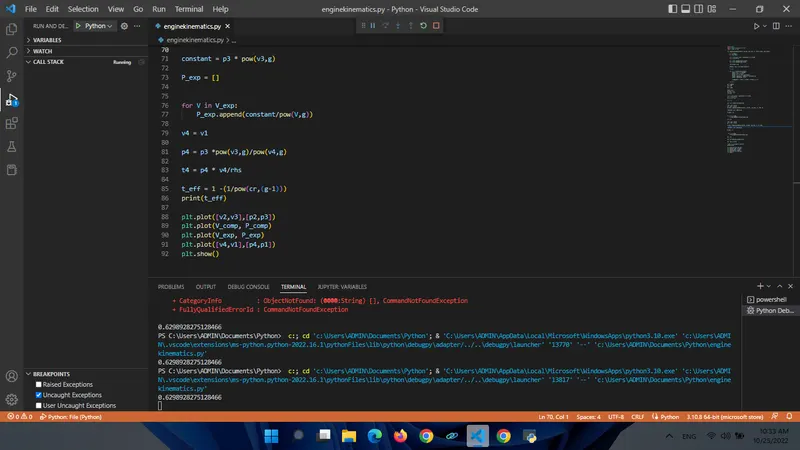
plt.plot([v2,v3],[p2,p3])
plt.plot(V_comp, P_comp)
plt.plot(V_exp, P_exp)
plt.plot([v4,v1],[p4,p1])
plt.show()
answer -
thermal effeciency obtained = 0.6298
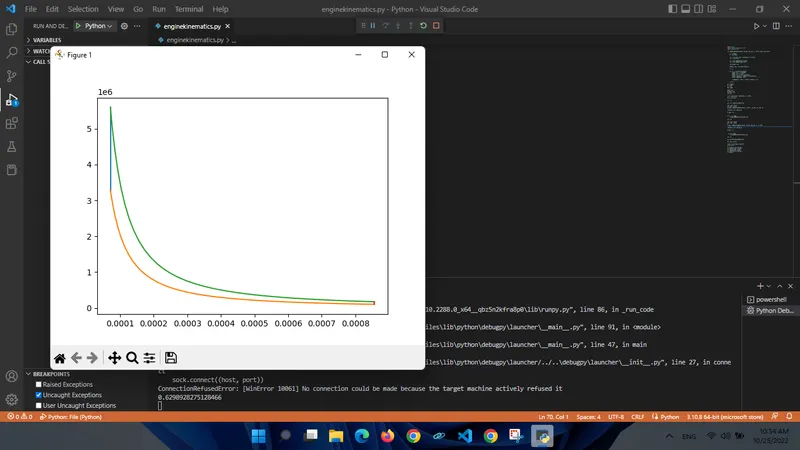
conclusion - an otto cycle consists of 0 - 1 = constant pressure (air sucked)
1 - 2 = adiabatic compression (TDC to BDC)
2 - 3 = constant volume heat transfer ( at TDC before combustion)
3 - 4 = adiabatic expansion ( power stroke )
4 - 1 = constant volume heat rejection ( at BDC)
1 - 0 = constant pressure process (air released)
imported math & matplotlib.pyplot modules into the program.