Project - Data Handling and Interpolation
1, code -
[data1] = xlsread('VI.xlsx');
V = data1(:,1);
I = data1(:,2);
x= -17.3:0.1:0.9;
y = interp1(V,I,x,'spline');
subplot(211);
plot(V,I,'r*',x,y);
title('VIgraph');
xlabel('Xaxis');
ylabel('Yaxis');
legend('VIgraph');
grid on;
vv = [-17.2 -13 -11 -9 -6 -1 0.11 0.25 0.5 0.61 0.66]
ii = interp1(V,I,vv);
z = [vv ii]
fileID = fopen('vvii.txt','w');
fprintf(fileID,'vv','ii');
fclose(fileID);
answer - 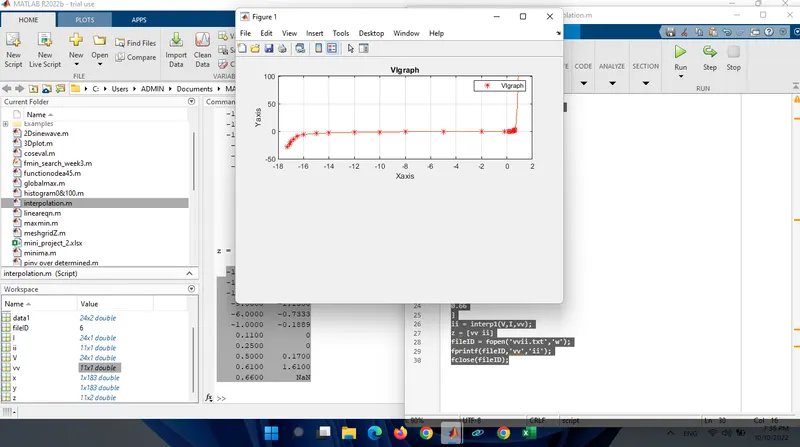
interpolated voltage and current values . voltage in first column and current in second.
-17.2000 -26.0000
-13.0000 -2.5000
-11.0000 -1.6500
-9.0000 -1.1500
-6.0000 -0.7333
-1.0000 -0.1889
0.1100 0
0.2500 0
0.5000 0.1700
0.6100 1.6100
0.6600 NaN
-13.0000 -2.5000
-11.0000 -1.6500
-9.0000 -1.1500
-6.0000 -0.7333
-1.0000 -0.1889
0.1100 0
0.2500 0
0.5000 0.1700
0.6100 1.6100
0.6600 NaN
conclusion -
interpolation is the determination of unknown values using the known values.here the VI excel sheet is read in to the matlab using xlsx.read function. then voltage (v) and current (i) values are read in to the desired variables. then the range is provided as per the question. then using interp1 interpolation is done aganist V & I. a graph is plotted. interpolated voltage (vv) and using this value interpolated current (ii) is marked in the graph. this interpolated values of vv & ii are stored in z . this values are saved as text file (vvii.txt) using function .txt & is value is printed using function printf and this file is called using fclose function.