Week 6 - Data analysis
code -
import matplotlib.pyplot as plt
from scipy.integrate import simps
from tabulate import tabulate
import numpy as np
import math

#File input
File = (input('Enter the filename: '))
if File == 'engine_data.out':
	print('File found successfully')
	print('Proceeding to compatability check')
else:
	print('File not recogonized. Please provide a valid CONVERGE output file')
	exit()

#To get the titles of the data file
titles = []
for line in open(File):
	if '#' in line:
		titles.append(line.split())

#Compatability check
if 'CONVERGE' in (titles[0]):
	print("Compatability check successful")
	print('File consists of datas given below')
	print('n')
else:
	print("File not recognized. Please provide a valid CONVERGE output file")
	exit()

#To get the column numbers from the data file
S_num = []
for sn in titles[1]:
	if '#' not in sn:
		if 'column' not in sn:
			S_num.append(sn)

#To get the Parameters from the data file
Parameters = []
for p in titles[2]:
	if '#' not in p:
		Parameters.append(p)

#To get the Units of the parameters from the data file
Units = []
for u in titles[3]:
	if '#' not in u:
		Units.append(u)

#Printing the parameters with units and column numbers
headers = ['S.No','Parameters','Units']
data    = tuple(zip(S_num,Parameters,Units))
print(tabulate(data,headers=headers))
print('n')

#To take column numbers as the input and plot the respective columns
x = 1
while x==1:

	a = int(input('Enter column number of the required parameter_1: '))
	b = int(input('Enter column number of the required parameter_2: '))
	print('n')

	#To automatically generate the labels for the plot
	x_L = Parameters[a-1]
	y_L = Parameters[b-1]

	#To store the required values to plot
	value_1 = []
	value_2 = []

	#To calculate the workdone of the engine from p-v curve
	Pressure = []
	Volume = []

	#Creating a loop to get the required values from the data file
	for line in open(File):
		if '#' not in line:
			value_1.append(float(line.split()[a-1]))
			value_2.append(float(line.split()[b-1]))
			Pressure.append(float(line.split()[1]))
			Volume.append(float(line.split()[7]))

	#Calculating area under PV plot
	Area = simps(Pressure,Volume)
	print('Area under P-V curve: '+str(Area))
	print('Work done by the enigne: '+str(Area*1e6))
	print('n')

	#Calculating the power output of the engine
	rpm = int(input('Enter the rpm value to calculate power output: '))
	rps = rpm/60
	S_c = rps/2
	power = (Area*1e6)*(S_c/1000)
	print('Power output of the engine: '+str(power)+' KW ')
	print('n')

	#Calculating the specific fuel consumption
	r = int(input('Enter the value of fuel consumption per stroke in mg: '))
	sfc = r/power
	sfc = sfc*3.6
	print('Specific fuel consumption of the engine: '+str(sfc)+' kg/KWhr ')

	#To plot the parameters according to the user input
	plt.plot(value_1,value_2,linewidth=3)
	plt.title(y_L+" vs "+x_L)
	plt.xlabel(x_L)
	plt.ylabel(y_L)
	plt.grid()
	plt.savefig(y_L+" vs "+x_L)
	plt.show()
	print('n')

	#To continue or exit the program
	x = int(input('Press 1 to continue 0 to end: '))
output -
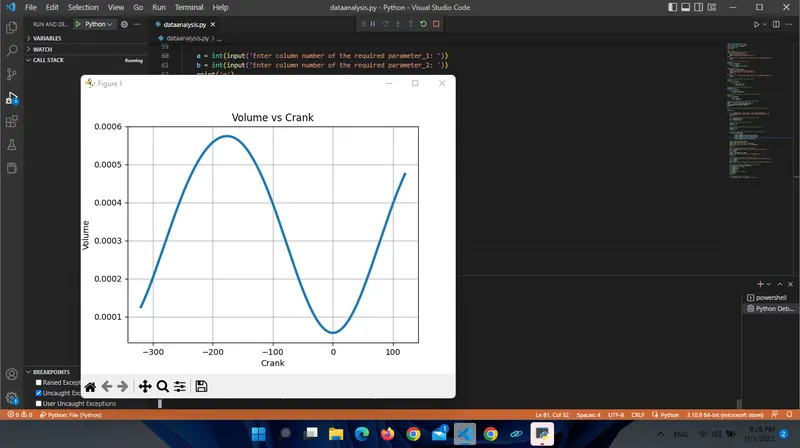
Enter the filename: engine_data.out
File found successfully
Proceeding to compatability check
Compatability check successful
File consists of datas given below
n
S.No Parameters Units
------ ------------- ---------
1 Crank (DEG)
2 Pressure (MPa)
3 Max_Pres (MPa)
4 Min_Pres (MPa)
5 Mean_Temp (K)
6 Max_Temp (K)
7 Min_Temp (K)
8 Volume (m^3)
9 Mass (kg)
10 Density (kg/m^3)
11 Integrated_HR (J)
12 HR_Rate (J/time)
13 C_p (J/kg-K)
14 C_v (J/kg-K)
15 Gamma (none)
16 Kin_Visc (m^2/s)
17 Dyn_Visc (N*s/m^2)
n
Enter column number of the required parameter_1: 1
Enter column number of the required parameter_2: 8
n
Area under P-V curve: 0.0005005864474262364
Work done by the enigne: 500.58644742623636
n
Enter the rpm value to calculate power output: 1500
Power output of the engine: 6.257330592827955 KW
n
Enter the value of fuel consumption per stroke in mg: 20
Specific fuel consumption of the engine: 11.506504080593915 kg/KWhr
PS C:\Users\ADMIN\Documents\Python>
PS C:\Users\ADMIN\Documents\Python> c:; cd 'c:\Users\ADMIN\Documents\Python'; & 'C:\Users\ADMIN\AppData\Local\Microsoft\WindowsApps\python3.10.exe' 'c:\Users\ADMIN\.vscode\extensions\ms-python.python-2022.16.1\pythonFiles\lib\python\debugpy\adapter/../..\debugpy\launcher' '4211' '--' 'c:\Users\ADMIN\Documents\Python\dataanalysis.py'
Enter the filename: engine_data.out
File found successfully
Proceeding to compatability check
Compatability check successful
File consists of datas given below
n
S.No Parameters Units
------ ------------- ---------
1 Crank (DEG)
2 Pressure (MPa)
3 Max_Pres (MPa)
4 Min_Pres (MPa)
5 Mean_Temp (K)
6 Max_Temp (K)
7 Min_Temp (K)
8 Volume (m^3)
9 Mass (kg)
10 Density (kg/m^3)
11 Integrated_HR (J)
12 HR_Rate (J/time)
13 C_p (J/kg-K)
14 C_v (J/kg-K)
15 Gamma (none)
16 Kin_Visc (m^2/s)
17 Dyn_Visc (N*s/m^2)
n
Enter column number of the required parameter_1: 1
Enter column number of the required parameter_2: 8
n
Area under P-V curve: 0.0005005864474262364
Work done by the enigne: 500.58644742623636
n
Enter the rpm value to calculate power output: 1500
Power output of the engine: 6.257330592827955 KW
n
Enter the value of fuel consumption per stroke in mg: 20
Specific fuel consumption of the engine: 11.506504080593915 kg/KWhr
n
Press 1 to continue 0 to end: 0
conclusion -
required modules are imported.
then the file name that should be analysised should be entered with extension with ".out"
if the entered name is correct then it shows "file found successfully Proceeding to compatability check"
To print the parameters of the data file in the output window for the user to choose the column numbers to plot.
Now we have all the column numbers, parameters and units in the 'titles' variable
But if they are printed the way they are stored, the oder will be colapsed and also it gets printed with the '#'
So the second, third and fourth index of the 'titles' variable are given seperate for loop with some conditions and are appended to different variables.
Therefore the column number, parameters and units gets ordered which are then tabulated and printed.
At first, the column numbers are acquired from the user by using the input command.
Since python have 0th index as first index the value from the user input is deduced by 1 whenever used in the program.
To automatically label the plot the parameter variable is assigned with the user input index accordingly.
Then two open variable value_1 and value_2 are created to store the datas of the parameters required by the user.
The values are store in the variable using a for loop by using the line.split command and the index value given by the user.
The line.split command splits the data column which it gives the datas of the column according to the index number, which is then appended to the variables value_1 and value_2 accordingly.
The pressure and volume datas are also appended to the open variables created for calculation purposes.
Then by using the plot, savefig and labeling commands the image is created with the variables, value_1 and value_2.