Week 2 Air standard Cycle
import math
import matplotlib.pyplot as plt
def engine_kinematics(bore,stroke,con_rod,cr,start_crank,end_crank):
    r = stroke/2
    n = con_rod/r
    v_s = (math.pi/4)*pow(bore,2)*stroke
    v_c = v_s / (cr - 1)
    sc = math.radians(start_crank)
    ec = math.radians(end_crank)
    num_values = 100
    dtheta = (ec-sc)/(num_values-1)
    V = []
    for i in range (0,num_values):
        theta = sc+(i*dtheta)
        term1 = 0.5*(cr-1)
        term2 = n+1-math.cos(theta)
        term3 = (pow(n,2)-pow(math.sin(theta),2))
        term3 = pow(term3,0.5)
        V.append((1+term1*(term2-term3))*v_c)
    return V
P1 = int(input('Enter the pressure at 1st stage (in Pa):'))
T1 = int(input('Enter the temperature at 1st stage (in K):'))
gamma = float(input('Enter the specific heat ratio:'))
T3 = int(input('Enter the temperature at 3rd stage (in K):'))
bore = float(input('Enter the bore diameter (in m):'))
stroke = float(input('Enter the stroke length (in m):'))
con_rod = float(input('Enter the length of the connecting rod (in m):'))
cr = int(input('Enter the compression ratio:'))
v_swept = (math.pi/4)*pow(bore,2)*stroke
v_clearance = v_swept/(cr-1)
V1 = v_swept+v_clearance
V2 = v_clearance
P2 = P1*pow(cr,gamma)
T2 = P2*V2*T1/(P1*V1)
V_comp = engine_kinematics(bore,stroke,con_rod,cr,180,0)
C_const = P1*pow(V1,gamma)
P_comp = []
for v in V_comp:
    P_comp.append(C_const/pow(v,gamma))
V3 = V2
P3 = P2*T3/(T2)
V_exp = engine_kinematics(bore,stroke,con_rod,cr,0,180)
C_const = P3*pow(v,gamma)
P_exp = []
for v in V_exp:
    P_exp.append(C_const/pow(v,gamma))
V4 = V1
P4 = P3*pow(V3,gamma)/pow(V4,gamma)
T4 = P4*V4*T3/(P3*V3)
plt.figure()
plt.plot([V2,V3],[P2,P3])
plt.plot(V_exp,P_exp)
plt.plot([V4,V1],[P4,P1])
plt.plot(V_comp,P_comp)
plt.xlabel('Volume (m^3)')
plt.ylabel('Pressure (in Pa)')
plt.title('PV diagram of Otto cycle')
plt.grid()
plt.show()
CODING THE OTTO CYCLE SIMULATOR:
- Import 'math' and matplotlib.pyplot' as plt respectively.
- Define the 'engine_kinematics' function using 'def' command and declare all the required variables.
- Enter the expressions used to calculate each variable respectively and the conditions for whicht the calculations have to be done.
- Give the inputs required to obtain the PV graph and thermal efficiency of the cycle by using the 'input','int' and 'float' command.
- Define the expressions required to calculate pressure, volume and temperature at all the stage points and thermal efficiency of the given cycle
- By using the 'plt' command, plot the obtained volumes and pressures. and enter 'plt.show()' to display the graph
RESULTS:

Given inputs of the cycle and Thermal Efficiency
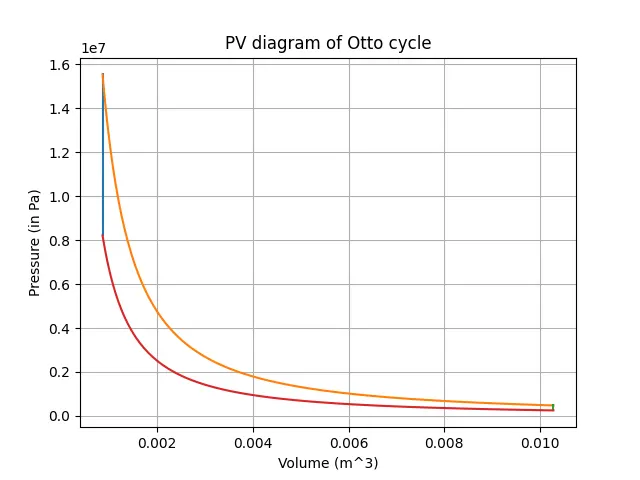
P-V Diagram of the given Otto Cycle