Week -2
Electric Doorbell and Thermistor
AIM: Create Simulink model to simulate electric doorbell and thermistor-based switch.
OBJECTIVE: For electric doorbell
- Create input signal for electric doorbell.
- Generate output for doorbell that corresponds to input signal.
For Thermistor
- Create input signal for thermistor.
- Turn fan on only when temperature is above 25°C.
DODY OF WORK
Electrical Doorbell
The plunger must contact the bell for 2 seconds followed by another 2 seconds in which the plunger can spring back to its original position in which it is not in contact with the bell. This on/off signal is best suited to a digital input with a duty cycle of 50%. The input digital signal must control a switch which opens and closes the electrical circuit, which controls the movement of the plunger. The plunger will then move in phase with the digital input signal assuming negligible plunger mass and zero impedance in electric circuit. The Simulink block diagram for electric doorbell is shown below.
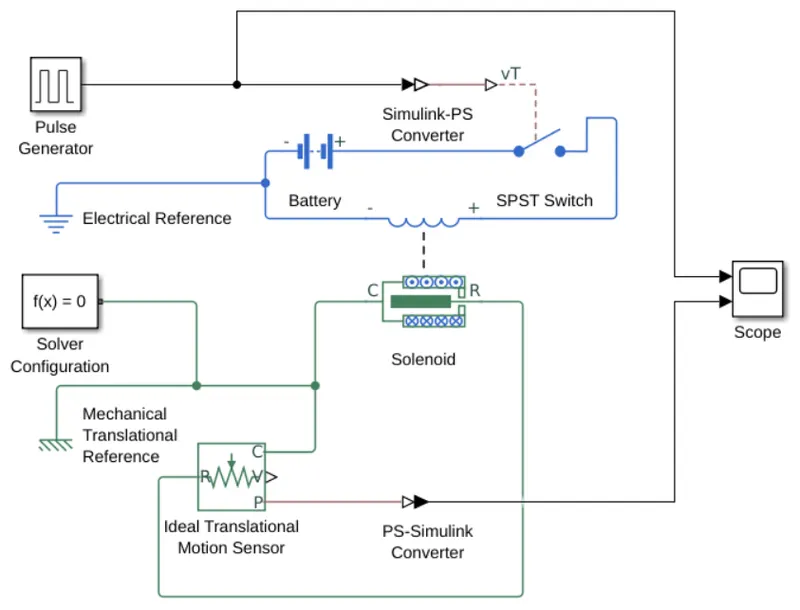
Figure 1- Block Diagram of Electric Bell
The diagram can be divided into two parts. The first is the electrical circuit shown in blue, which opens and closes based on the digital input signal. The second is the mechanical circuit shown in green, which measures the movement of the plunger. The remainder of the diagram consists of the digital signal input and scope block for logging data.
The pulse generator block is used to simulate digital signal input. As described, it has a 50% duty cycle with 2 seconds in the “low” position and two seconds in the “high” position. A Simulink to physical system block is added to convert digital signal to physical system input. The output of the Simulink to PS converter goes to the threshold terminal of a single pole single throw switch. The SPST switch closes the circuit when the input voltage at the threshold voltage terminal is above a threshold value. Otherwise, it remains closed. The threshold value is set between the “high” and “low” values from the pulse generator. The battery provides the voltage to drive the solenoid, which controls the movement of the plunger. Finally, the electrical reference provides a zero-voltage reference for the electrical circuit.
The solenoid converts the voltage in the electrical circuit to translational mechanical motion. By the nature of the plunger the movement will also be oscillating. To measure the movement of the plunger, an ideal translational motion sensor is connected to the mechanical output terminals of the solenoid block. A mechanical translational reference is connected as well as a configuration solver to avoid errors. The output of the translational motion sensor is fed to a physical system to Simulink converter which is then connected to a scope block to log the motion of the plunger. The pulse generator is also connected to the scope block so that the digital signal provided to the circuit and the movement of the plunger may be displayed in the same graph as shown below.
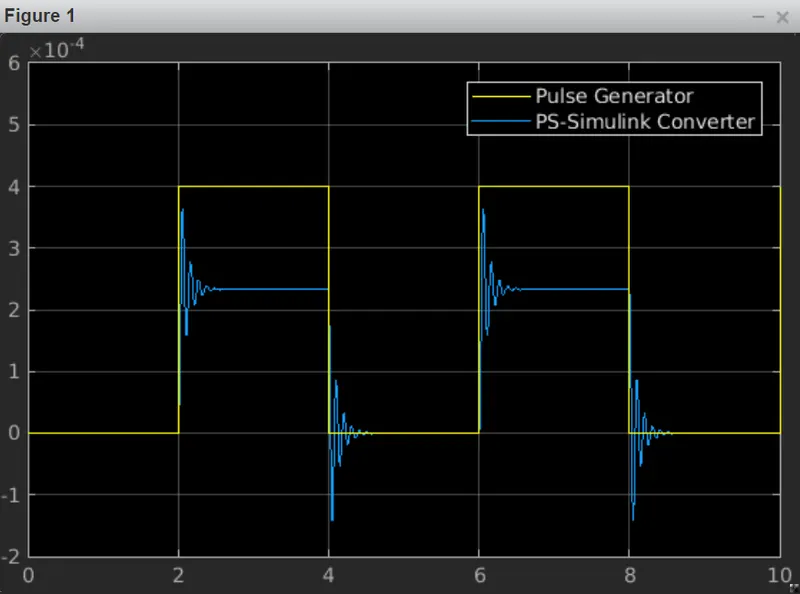
Figure 2- Electric Doorbell Input and Output
The signals logged in the scope are shown above. Voltage and deflection are measure on the vertical axis. The input signal provided by the pulse generator block is shown in yellow. As the signal passes through the Simulink to PS it is converted to 4*10-4 volts in its “high” state and 0 volts at its “low” state. The deflection of the plunger from its rest position is shown in blue. At its rest position its deflection is 0m and its max deflection is set at ~2.3*10-4m. Time is plotted on the horizontal axis. The simulation time is 10 seconds. Scales were reduced to fit both signals on the same graph.
Thermistor Based Switch
A thermistor is a device which changes its electrical resistance based on ambient temperature. In this simulation it is used to turn a fan on if the temperature exceeds 25°C. The block diagram for the thermistor-based fan switch is shown below.
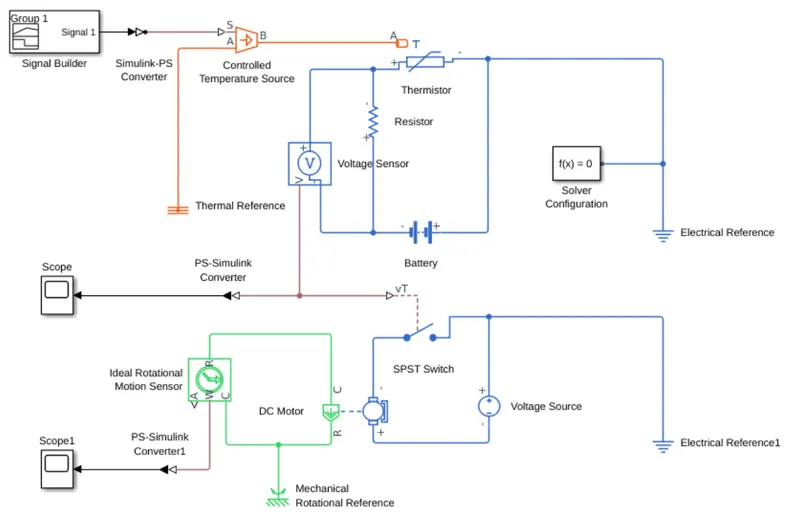
Figure 3- Block Diagram of Thermistor Based Fan Switch
The ambient temperature varies over time. It is 20°C for the first 10 seconds, 27°C from 10 to 30 seconds and 23°C from 30 to 50 seconds. The diagram can be divided into one thermal circuit, two electrical circuits and one mechanical circuit.
The thermal circuit shown in orange, provides the ambient temperature signal to the thermistor. This is done using a controlled temperature source block which receives its signal from a signal builder. The output from the signal builder is converted from a Simulink signal to a temperature signal using a Simulink to PS converter. The values provided by the Signal builder are added to the signal from a thermal reference block which is at absolute zero.
The first electrical circuit shown in blue, consists of the thermistor, battery, resistor in series connection with the thermistor, a voltage sensor, an electrical reference, and a solver configuration. As the resistance of the thermistor changes with the ambient temperature, so too does the voltage drop across the series resistor. The voltage sensor detects the voltage drop across the series resistor and passes the signal on to the threshold terminal of the single pole single throw switch. The reading from the voltage sensor at 25°C is 120mV. The reading from the voltage sensor is logged in a scope block once it is converted to Simulink signal using a PS to Simulink converter.
The second electrical circuit shown in blue, consists of a single pole single throw switch, voltage source, electrical reference, and DC motor. The threshold voltage of the SPST is set at 120mV so that the circuit is closed above 25°C and open below 25°C.
The mechanical circuit shown in green consists of the DC motor, ideal rotational motion sensor and mechanical rotational reference. The speed of the fan is equal to the rotational speed of the dc motor and is measured by ideal rotational motion sensor. The signal from the sensor is logged by a scope block once it passes through a PS to Simulink converter.
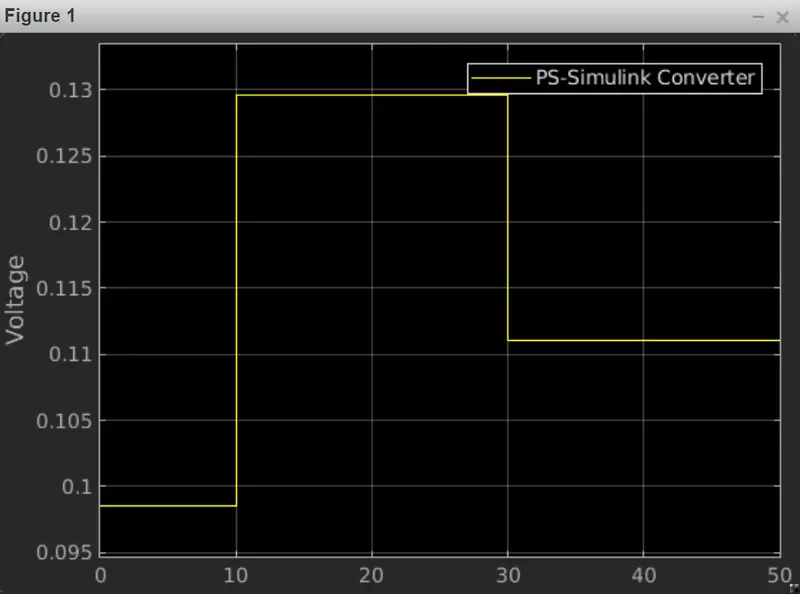
Figure 4- Voltage Sensor Output
The voltage readings from the voltage sensor are shown above. Voltage readings are plotted on the vertical axis in volts. Time is plotted on the horizontal axis in seconds. The voltage exceeds 120mV from 10 to 30 seconds. This corresponds to the time in which the ambient temperature is 27°C.
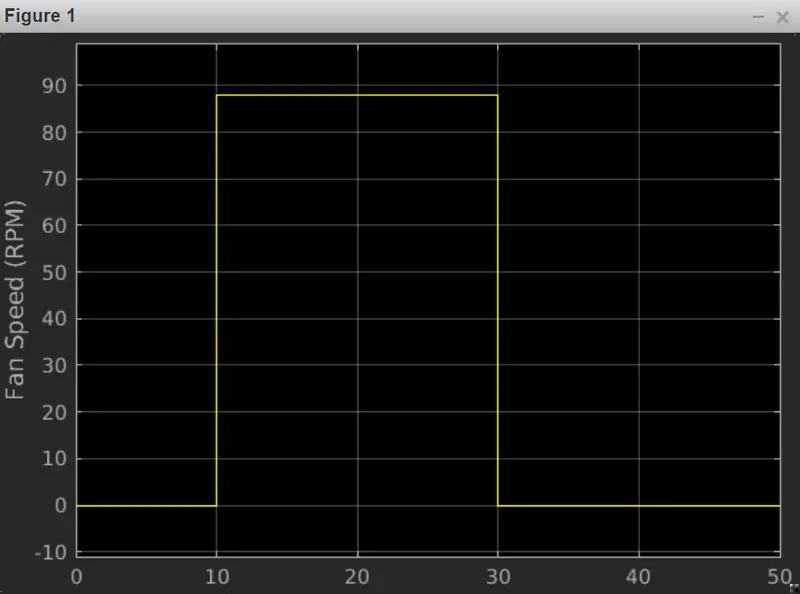
Figure 5- Fan Speed
Fan speed readings are shown above. Fan speed is displayed on the vertical axis in RPM. Time is displayed on the horizontal axis in seconds.
CONCLUSION
The plunger in the electrical bell deflects to hit the bell for 2 seconds and falls back into its rest position for 2 seconds, exactly in phase with the input signal.
The thermistor-controlled fan only rotates from 10 to 30 seconds. This corresponds with the time during which ambient temperature is above 25°C.