Week 2- 2R Robotic Arm Challenge
Report
This challenge requires a nested for loop for iterating each value of thetas and creating a plot/graph for each value of the coordinates.
The 2R robotic arm has 2 arms and 1 manipulator, to keep things simple we concentrate on the movements of the two arms, to put it in engineering terms, the kinematics of the robotic arms are being recorded with the help of plot command and VideoWrite command using MATLAB.
The code is given as follows:
%Forward Kinematics of 2R Robotic Arm.
%There are two arms in a 2R Robotic Arm and a manipulator.

%Inputs
%So the length of Arm 1 is L1 and Arm 2 is L2.
l1=1;
l2=0.5;

%The angle made by Arm1 with respect to the X-axis is Theta1
theta1=linspace(0,90,40);


%The angle made by Arm2 with respect to the X-axis is Theta2
theta2=linspace(0,90,40);

%The range of theta is taken so that we can check the
%various positions of the arm with respect to the angle.

%A counter is defined for the sake of creating a video file
ct = 1;

%In the For loop, we take the range 1 till the length of theta's
for i=1:length(theta1)
    THETA1=theta1(i);
    %Then we assign each value of theta from 1 to 90 in a loop
    %This will enable 10 results with different theta's seperately
    %For creating seperate plots.
    for j=1:length(theta2)
        THETA2=theta2(j);

        %The base/start point of the Arm1 will be (0,0) so,
        x0=0;
        y0=0;

        %The end points of Arm1 will be (x1,y1)
        x1=l1*cosd(THETA1);
        y1=l1*sind(THETA1);

        %The base/start point of Arm2 will be (x1,y1)
        %while the end points will be (x2,y2)
        x2=x1+l2*cosd(THETA2);
        y2=y1+l2*sind(THETA2);

        %now plotting the graph.
        %There will be two lines.
        %line1 = Arm1
        %line2 = Arm2
        %So the X-coordinates of line/Arm1 is (x0,x1)
        %the Y-coordinates of line/Arm1 is (y0,y1)
        %// the X-coordinates of line/Arm2 is (x1,x2)
        %the Y-coordinates of line/Arm2 is (y1,y2)
        %for the sake of thick lines we kept linewidth as 3
        plot([x0 x1], [y0 y1], [x1 x2], [y1 y2],'linewidth',3);

        %this is the axis range of the plot.
        axis([-0.1 1.5 0 1.5]);

        %pausing the results for a short duration because
        %plots will look like an animation/video/gif
        pause(0.01);

        %assigning a value for the counter so that
        %for each count the plot is framed/saved
        M(ct) = getframe(gcf);

        %iterating the count after each theta till the end value
        ct = ct + 1;


    end
end
%two ends for 2 FOR loop

%Creating the movie function to capture the video of plots changing
movie(M);

%this function creates the video in AVI format
videofile = VideoWriter('sample.avi');

%adding all the iterated frames into 1 video file.
open(videofile);
writeVideo(videofile,M);
close(videofile);
- The challenges faced while executing this code are as follows:
1. Speed variations, the pause function is very intricate and needs to be assigned in millisecond values or the microsecond values for generating a smooth flow of the plot/graph including the video.
2. There were multiple error messages while executing the above code.
3. Each time I had to stop the running code as the plots got opened back again.
The error messages are as follows:
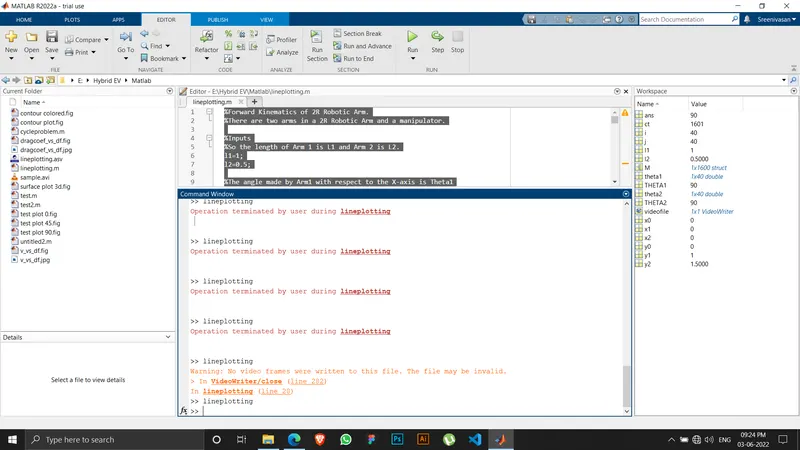
But once I used the videowrite function, it did not repeat and the video was created as told by the tutor.
There was a second error as I forgot to write the WriteVideo() function but then it was also rectified.
There was a warning sign using the getframe() function :
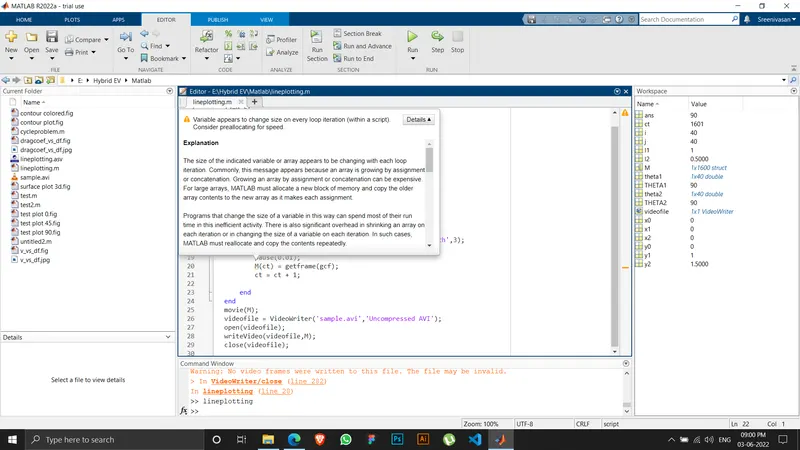
I am not certain how to rectify it as I ignored and followed the tutor's way, I will later check this and read about it to understand more about these warnings in MATLAB.
Result:
Because of internet issues, I did not use the uncompressed version as the video file crosses 1GB. Sorry for the inconvenience.
You can check the result/video in this drive link below:
https://drive.google.com/file/d/1UZ4R-XF_fXbiMtPn3pp7vU7sB_s7zAGI/view?usp=sharing