Project 1 - Parsing NASA thermodynamic data
AIM
File Parsing - using NASA's Thermodynamic data to create a folder and plot grpahs, all using MATLAB code.
1. Write a function that extracts the 14 co-efficients and calculates the enthalpy, entropy and specific heats for all the species in the data file. You will be reading the NASA data.dat file.
The FIRST 7 coefficients are HIGH-temperature coefficients and the SECOND 7 coefficients are LOW-temperature coefficients.
Also use the LOCAL TEMPERATURE RANGES which is unique for each individual species, not the GLOBAL TEMPERATURE RANGE.
2. Calculate the molecular weight of each species and display it in the command window.
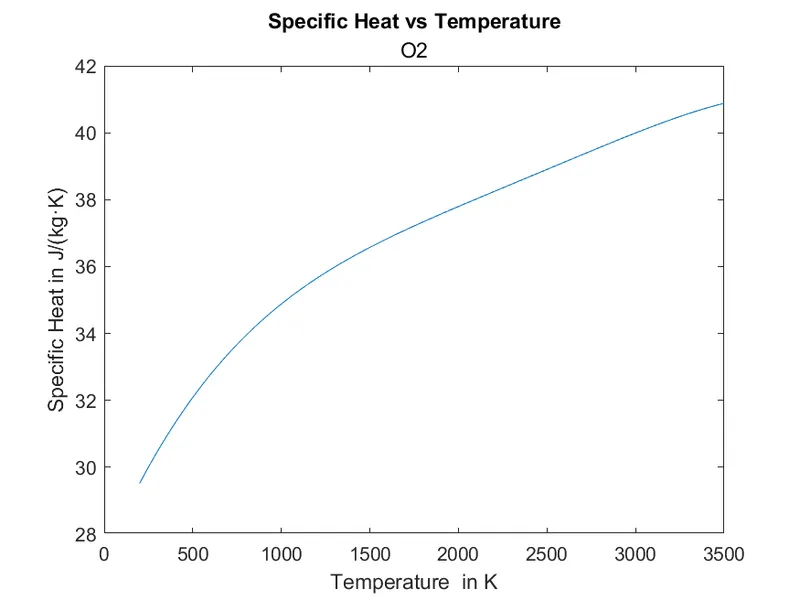
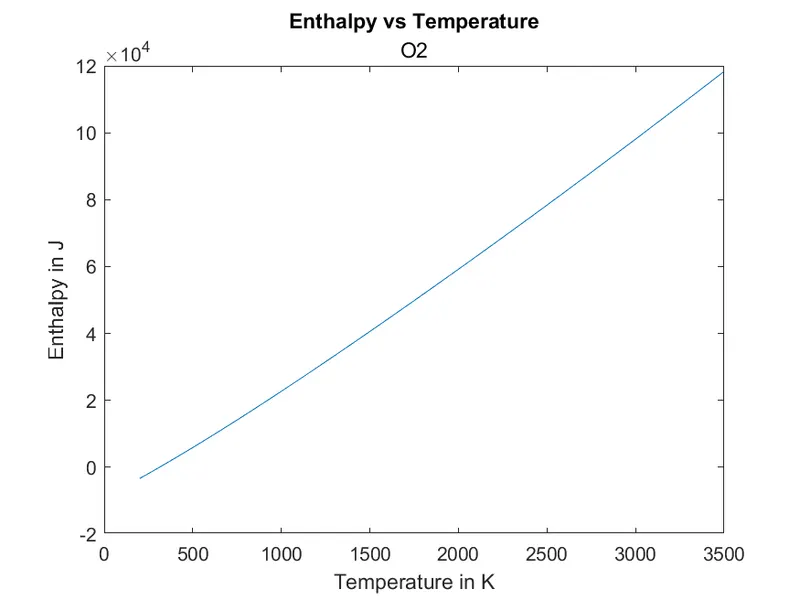
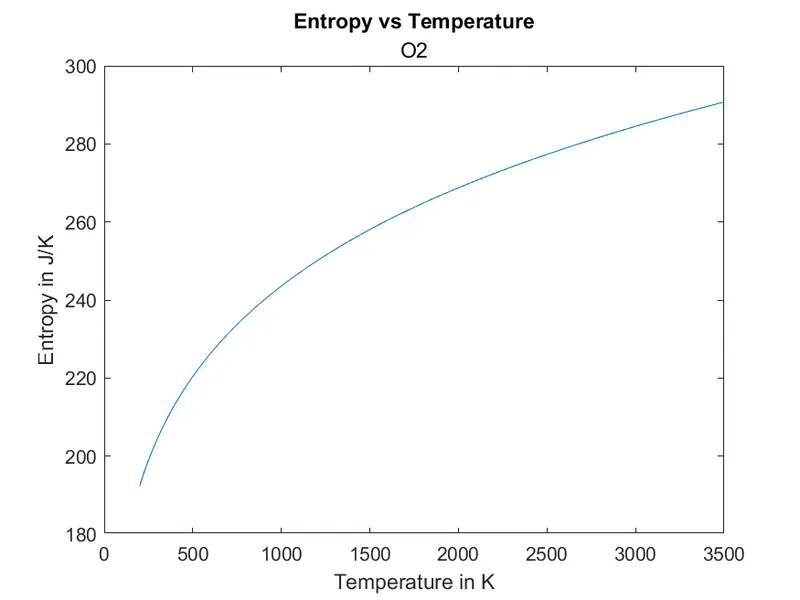
3. Plot the Cp, Enthalpy and Entropy for the local temperature range (low temperature : high temperature) specific for each species.
4. Save the plots as images with appropriate names and dump them in separate folders for each species with suitable name. All these should be generated automatically.
5. The main program that you will submit will just take the "THERMO.dat" file as an input and generate Cp, H and S plots.
GOVERNING EQUATIONS

where,
R - Gas constant
Cp - Specific Heat capacity
H - Enthalpy
S - Entropy
T - Temperatures
PROGRAM - BODY OF THE REPORT
The program for the above challenge is as follows;
% Data parsing in MATLAB
%Using NASA thermodynamic data

%Storing the file to be read in N1
%opening the file with 'fopen'
N1 = fopen('THERMO.dat', 'r');
%skips the first line
fgetl(N1);
%saving the 2nd line to a variable
X = fgetl(N1);

% to get global tempertaure limits
% separating data in string with space
A = strsplit(X, '  ');
% converting string data to a number
GLT = str2num(A{2});
GLM = str2num(A{3});
GLH = str2num(A{4});

% To neglect comment lines
fgetl(N1);
fgetl(N1);
fgetl(N1);

% Universal gas constant
R = 8.314;

%Taking the lines of all the species and seperating
for i = 1:inf
    material_line = fgetl(N1);
    L_T= strsplit(material_line, '  ');

    % To end the loop at last line
    if L_T(1) == "END"
        break;
    else
        % Assigning values to the local temperature limits
        LLT = str2num(L_T{end -3});
        LHT = str2num(L_T{end -2});
        LMT = str2num(L_T{end-1});

        % defining temperature range
        T = linspace(LLT, LHT, 1000);
        % First line of constants
        first_line = fgetl(N1);
        % Reading the locations of E in the 1st line string and storing it in x
        x = findstr(first_line, 'E');
        % Second line
        second_line = fgetl(N1);
        % Reading the locations of E in the 2nd line string and storing it in y
        y = findstr(second_line, 'E');
        % Third line
        third_line = fgetl(N1);
        % Reading the locations of E in the 3rd line string and storing in z
        z = findstr(third_line, 'E');
        % The high temperature
        % "first_line(x(1)+4: x(2)+3)" is a string
        % str2num() converts the string into integer
        ht1 = str2num(first_line(1:x(1)+3));
        ht2 = str2num(first_line(x(1)+4: x(2)+3));
        ht3 = str2num(first_line(x(2)+4: x(3)+3));
        ht4 = str2num(first_line(x(3)+4: x(4)+3));
        ht5 = str2num(first_line(x(4)+4: x(5)+3));
        ht6 = str2num(second_line(1:y(1)+3));
        ht7 = str2num(second_line(y(1)+4: y(2)+3));

        % The low temperatures
        lt1 = str2num(second_line(y(2)+4: y(3)+3));
        lt2 = str2num(second_line(y(3)+4: y(4)+3));
        lt3 = str2num(second_line(y(4)+4: y(5)+3));
        lt4 = str2num(third_line(1:z(1)+3));
        lt5 = str2num(third_line(z(1)+4: z(2)+3));
        lt6 = str2num(third_line(z(2)+4: z(3)+3));
        lt7 = str2num(third_line(z(3)+4: z(4)+3));

        % Calculating Cp, H, S:
        % Using if condition to calculate for 2 different input values of low and high temperature.
        if T < LMT
            Cp = R*(lt1+ lt2*T+ lt3*T.^2 + lt4*T.^3 + lt5*T.^4);
            H = R*T.*(lt1 + lt2*T/2 + lt3*T^.2/3 + lt4*T.^3/4 + lt5*T.^4/5 + lt6./T);
            S = R*(lt1*log(T)+ lt2*T + lt3*T.^2/2 + lt4*T^.3/3 + lt5*T^.4/4 +lt7);
        else
            Cp = R*(ht1+ ht2*T+ ht3*T.^2 + ht4*T.^3 + ht5*T.^4);
            H = R*T.*(ht1 + ht2*T/2 + ht3*T.^2/3 + ht4*T.^3/4 + ht5*T.^4/5 + ht6./T);
            S = R*(ht1*log(T)+ ht2*T + ht3*T.^2/2 + ht4*T.^3/3 + ht5*T.^4/4 +ht7);
        end

    % reading the data in matrix for the species names:
    str = cell2mat(L_T(1));
    % Recorging for the species name in matrix form
    % Array with element names
    s = ["H" "O" "C" "N" "A"];
    % respective atomic weights
    atomic_weight = [1, 16, 12, 14, 40];
    mol_weight = 0;
        for j = 1:length(str)
            for k = 1: length(atomic_weight)
                if strcmp(str(j), s(k))
                    % Comparing for str(j) with s(k) and if similar  atomic_weight(k) is added to mol_weight
                    mol_weight = mol_weight + atomic_weight(k);
                    % regestering the location of the atom
                    position = k;
                end
            end

            % Calculating molecular weight of each element
            % reading the numeric values in str(j)
            number = str2double(str(j));
            if number > 1
                % If a number is greater than 1.
                mol_weight = mol_weight +atomic_weight(position)*(number-1);
            end
        end
    M = mol_weight;
    fprintf("\n The molecular weight of %s is %d g/mol", str, M);

    % Naming the species to the folder
     nasa = str;
    % Creating the directory/folder for saving the data
    mkdir(nasa);
    %using the pwd command to find the current folder
    current_dir = pwd;
    %creating the folder for each species
    cd(nasa)
        % Plotting
        figure(1)
        plot(T, Cp)
        % Plotting 'Cp' vs 'T'
        title('Specific Heat vs Temperature', str)
        xlabel('Temperature  in K')
        ylabel('Specific Heat in J/(kg·K)')
        %saving the plot as a figure
        saveas(gcf, 'Cp.fig');

        % Plotting 'H' vs 'T'
        figure(2)
        plot(T, H)
        title('Enthalpy vs Temperature', str)
        xlabel('Temperature in K')
        ylabel('Enthalpy in J')
        saveas(gcf, 'H.fig');

        % Plotting 'S' vs'T'
        figure(3)
        plot(T, S)
        title('Entropy vs Temperature', str)
        xlabel('Temperature in K')
        ylabel('Entropy in J/K')
        saveas(gcf, 'S.fig');
        cd(current_dir)
    end

end
RESULTS
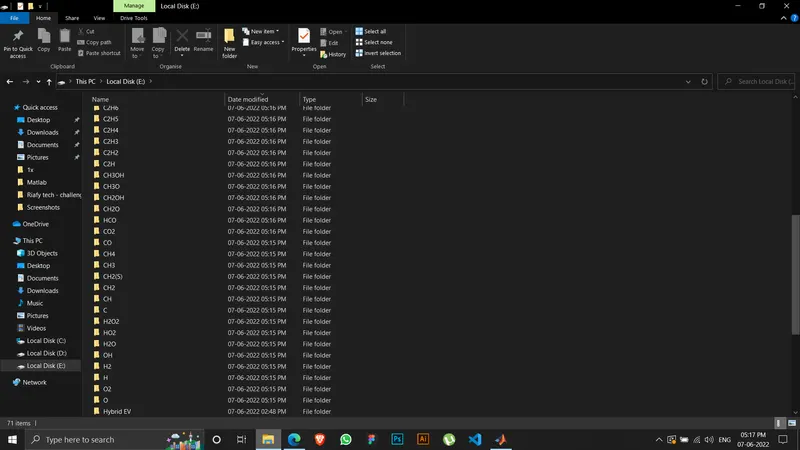
The output of this code is pretty big and all the 53 species were successfully registered in the folder along with the plot figures.
The folders that were auto saved;
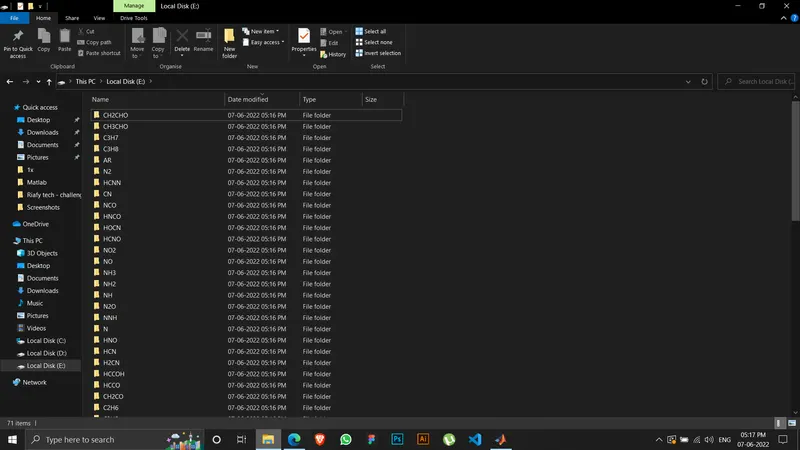
Second photo to complete all the 53 of the species;
The molecular weights were printed successfully which is as follows;
 The molecular weight of O is 16 g/mol
 The molecular weight of O2 is 32 g/mol
 The molecular weight of H is 1 g/mol
 The molecular weight of H2 is 2 g/mol
 The molecular weight of OH is 17 g/mol
 The molecular weight of H2O is 18 g/mol
 The molecular weight of HO2 is 33 g/mol
 The molecular weight of H2O2 is 34 g/mol
 The molecular weight of C is 12 g/mol
 The molecular weight of CH is 13 g/mol
 The molecular weight of CH2 is 14 g/mol
 The molecular weight of CH2(S) is 14 g/mol
 The molecular weight of CH3 is 15 g/mol
 The molecular weight of CH4 is 16 g/mol
 The molecular weight of CO is 28 g/mol
 The molecular weight of CO2 is 44 g/mol
 The molecular weight of HCO is 29 g/mol
 The molecular weight of CH2O is 30 g/mol
 The molecular weight of CH2OH is 31 g/mol
 The molecular weight of CH3O is 31 g/mol
 The molecular weight of CH3OH is 32 g/mol
 The molecular weight of C2H is 25 g/mol
 The molecular weight of C2H2 is 26 g/mol
 The molecular weight of C2H3 is 27 g/mol
 The molecular weight of C2H4 is 28 g/mol
 The molecular weight of C2H5 is 29 g/mol
 The molecular weight of C2H6 is 30 g/mol
 The molecular weight of CH2CO is 42 g/mol
 The molecular weight of HCCO is 41 g/mol
 The molecular weight of HCCOH is 42 g/mol
 The molecular weight of H2CN is 28 g/mol
 The molecular weight of HCN is 27 g/mol
 The molecular weight of HNO is 31 g/mol
 The molecular weight of N is 14 g/mol
 The molecular weight of NNH is 29 g/mol
 The molecular weight of N2O is 44 g/mol
 The molecular weight of NH is 15 g/mol
 The molecular weight of NH2 is 16 g/mol
 The molecular weight of NH3 is 17 g/mol
 The molecular weight of NO is 30 g/mol
 The molecular weight of NO2 is 46 g/mol
 The molecular weight of HCNO is 43 g/mol
 The molecular weight of HOCN is 43 g/mol
 The molecular weight of HNCO is 43 g/mol
 The molecular weight of NCO is 42 g/mol
 The molecular weight of CN is 26 g/mol
 The molecular weight of HCNN is 41 g/mol
 The molecular weight of N2 is 28 g/mol
 The molecular weight of AR is 40 g/mol
 The molecular weight of C3H8 is 44 g/mol
 The molecular weight of C3H7 is 43 g/mol
 The molecular weight of CH3CHO is 44 g/mol
 The molecular weight of CH2CHO is 43 g/mol>>
There was one error while working out this because I understood that working in any programming based software or language, it is very good practise to output chuncks of code to ensure less possibility of errors. You can select the part you can to execute and right clikc - evaluate section in command window or hit 'F9'.
So the only warning I couldn't avert is the for loop;
>> nasaparsing
Warning: Too many FOR loop iterations. Stopping after 9223372036854775806 iterations.
> In nasaparsing (line 29)
Since I am not very good with logical programming I evaluated with infinity probabilities but I am learning to correct my mistakes one by one.
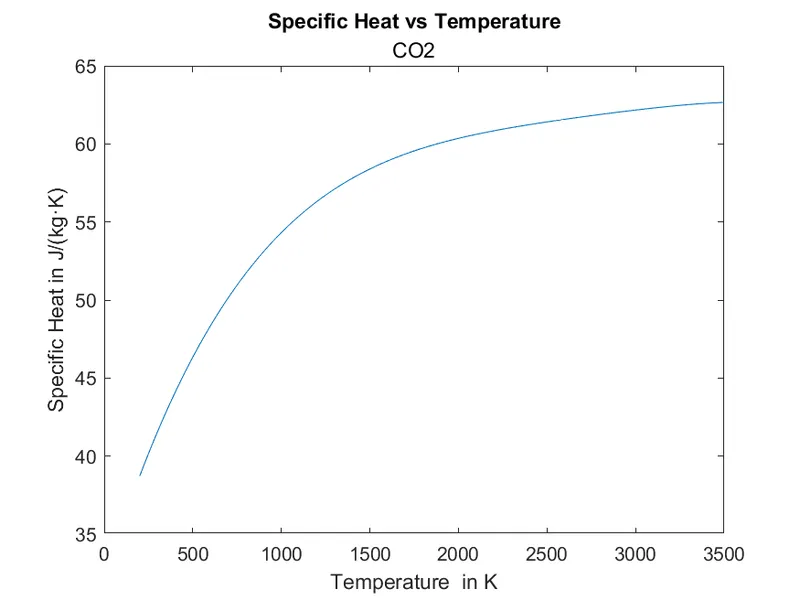
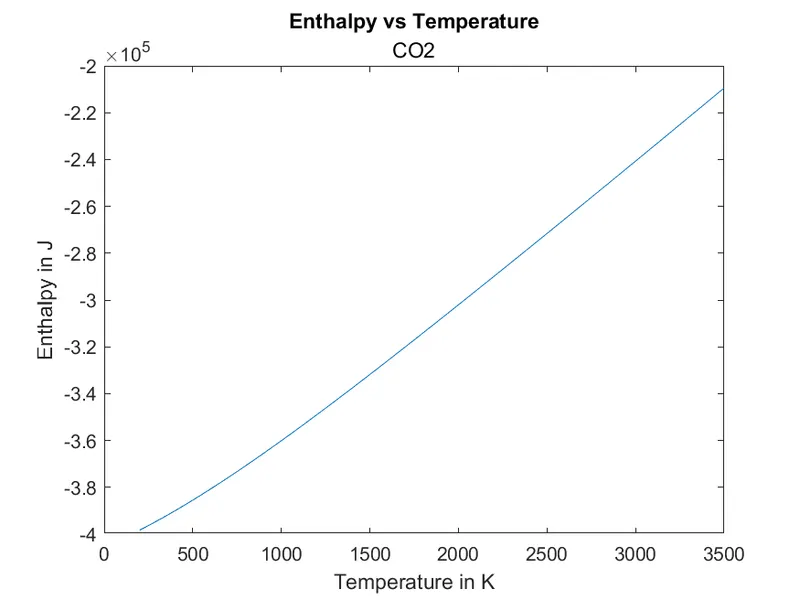
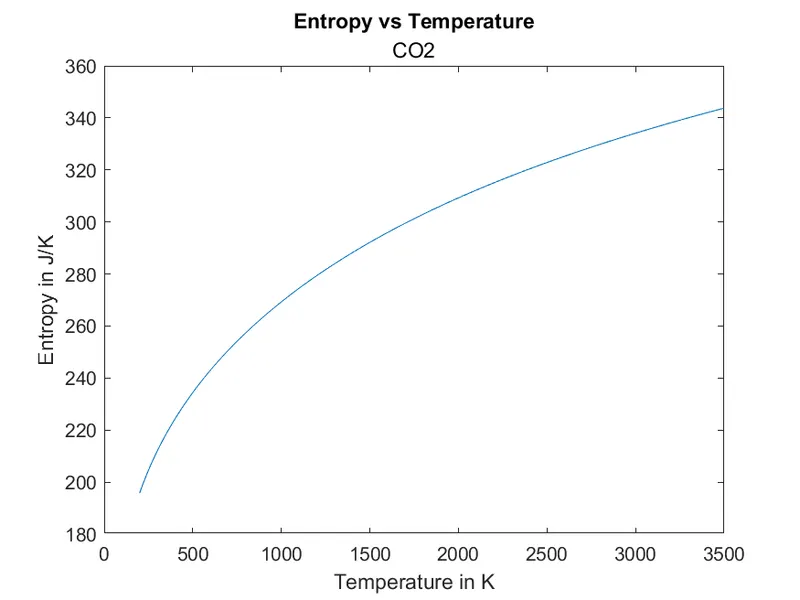
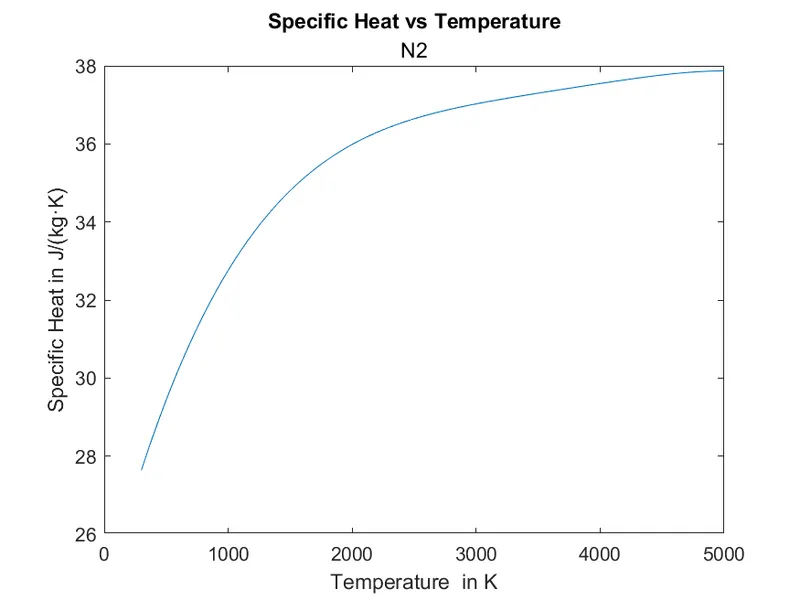
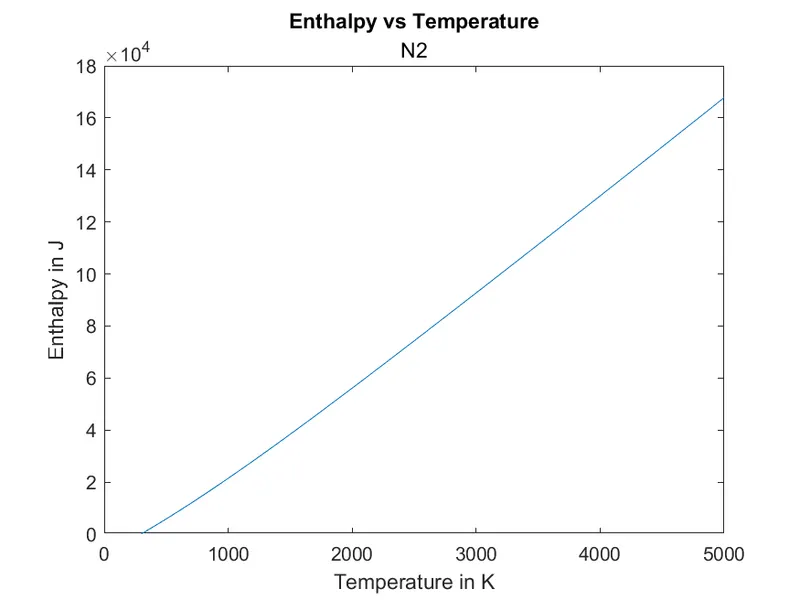
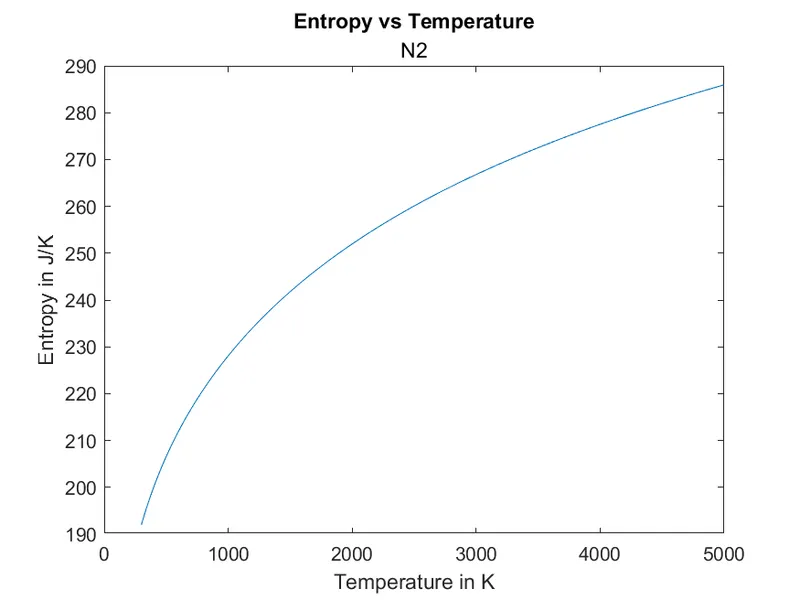
The plots were successfully saved and here are the three [(Cp,S & H) vs T] plots for 'O2', 'N2' and 'CO2' as I cannot take up more space in this report by pasting all the 53X3 plots that would take up 159 images.... so the plots are as follows;
CONCLUSION
Successfully completed this project that took up most time as the logic and writing the program was a bit tricky, I could've made 3 sub programs for calculating the 'Cp', 'H' and 'S' making them functions, defining and calling them but I think I will try out more iterations as to what i can improve in this program.
REFERENCE
1. Best way to parse text file - (mathworks.com)
2. HOW TO WRITE A DETAILED REPORT? : Skill-Lync