Week 2- 2R Robotic Arm Challenge
Video link : https://youtu.be/AIVqNIe3urw
Code :
clear all
close all
clc

% Simulating Forward_Kinematics of a 2R Robotic Arm Manipulator
% Alloting length values to LINK 1(l1) and LINK 2(l2)
l1=1;
l2=0.5;

% Defining an array of 5 values between 0 to 90 degrees for different orientations of the links
% Decreasing the resolution for demostration purpose
alpha1 = linspace(0,90,15);
alpha2 = linspace(0,90,15);

s=1; % defining counter variable as 1 to keep a count on number of frames.
% for loop is used for changing the orientation of LINK 1
% Loop counter variable for "1st for loop"
for i = 1 : length(alpha1)
    ALPHA1 = alpha1(i)
% Executing each value of alpha1 at a time and saving it in variable ALPHA1
% 2nd for loop is used to show all possible orientaions/inclinations of LINK 2 for a given position of LINK 1
    for j = 1:length(alpha2)
        ALPHA2 = alpha2(j);
% COORDINATES OF END POINTS OF THE LINKS:
% 1st point :
            x0=0;
            y0=0;
% 2nd point :
            x1 = l1*cosd(ALPHA1);
            y1 = l1*sind(ALPHA1);
% 3rd point :
            x2 = x1 + l2 *cosd(ALPHA2);
            y2 = y1 + l2 *sind(ALPHA2);

% Replacing two line commands with a single plot command
% PLot command takes the color of the most recent used plot,that's y
% we're seeing a single blue color when plot
%'figure' command can be removed bcoz the movie can be shown in a single plot command
% For avoiding overwriting of plots

            plot([x0 x1],[y0 y1],[x1 x2],[y1 y2],'linewidth',3)
            axis([-0.1 2 0 2])
            % Removing 'pause' command since it pauses the code which is not very efficient

            % getting individual frame and saving it in an array M
            % 's' represents each frame
            % 'getframe' command is getting every individual figure window
            % and saving it in array M
            M(s)=getframe(gcf);
            s=s+1; % Incrementing the frame after saving it
        end
end


            movie(M) % Matlab is going to create a movie with all the frames in M
            %creating avi files to dump out all the frames
            % Creating videofile using commmand ,VideoWriter'
            videofile=VideoWriter("Forward_Kimematics_Simulator.avi",'Uncompressed AVI');
            open(videofile) % Opening this videofile
            writeVideo(videofile,M) % Writing in the frames that we captured in the videofile
            close(videofile) % closing the videofile

            % First an animation and then a movie will be shown.
Report :
- Firstly,the length of the links were assigned to a variable named as l1 and l2.
- Then,two arrays of inclination angle that the links l1 and l2 will make with the x-axis during the entire simulation is generated.
- Now,for changing these angle that the links makes with x-axis needs to be changed automatically & for we used for loop.
- 1st for loop is used to change the orientation of the link 1 between 0 and 90 degrees and for each orientation of the link 1,link 2 is needs to be varied between 0 and 90 degrees.
- So,2nd for loop is used for this variation i.e., for each value of alpha1,we're looping through the values of alpha2 and performing the above operations as shown above.
- Initially,for generating plots,two "line" commands were used,which generated 9 plots in total showing different positions of the Robotic Arm & clearly that was not convenient way to represent the plot because we're in need of a single animation that shows the entire motion of the links
- And also, for storing different no. of these plots,figure command is used along with a counter variable 's' defined & initially set to 1 just before the 1st for loop and is incremented by 1 after execution of each plot.
- So,plot command is employed instead of 'line' command and still it yield 16 plots in total and just a single red link is shown now which represents both the links.
- This is because the plot command uses the most recent plot it executed which is red here.
- So,to avoid overwriting of the plots,we'll use 'hold on' before the plot command.
- Advantage of using 'plot' command is we can remove 'figure(s)' and use 'pause' command to give a pause between various orientations of the robotic arm.
- But,even this is not enough because visualizing all the postions in single plot seems a bit confusing.
- Using a single 'plot' command even gives almost the same plot of different colors which changes randomly.
- Removing 'hold on' command ,we'll get an animation showing for each value of alpha1,how alpha2 varies.
- Now,fixing the x and y axes for getting a clear animation.
- Increase the size apha1 and alpha2 array for getting a smoother plot and now we get to know how to create an animation on screen.
- Usage of 'pause' comand is not recommended because it pause the code which is not very efficient.
- Creating a Movie out of this program:
- Getting individual frame which is represented by' s' variable and saving it in and array 'M' defined just after plot command.
- 'Movie(M)' command is used to create a movie with all the frames
- Creating a videofile using VideoWriter command with the filename 'Forward_Kinematics_Simulator.avi' and profile as 'Uncompressed AVI'.
- Opening this videofile using open command.
- Writing in the frames we captured to this videofile using command writeVideo command.
- Finally,closing this videofile by close command.
- Decreasing the resolution ultimately for demostration purpose.i.e.,array size is decreased to 15.
- After performing the above steps an animation will be shown and a movie will be played.
Plots :
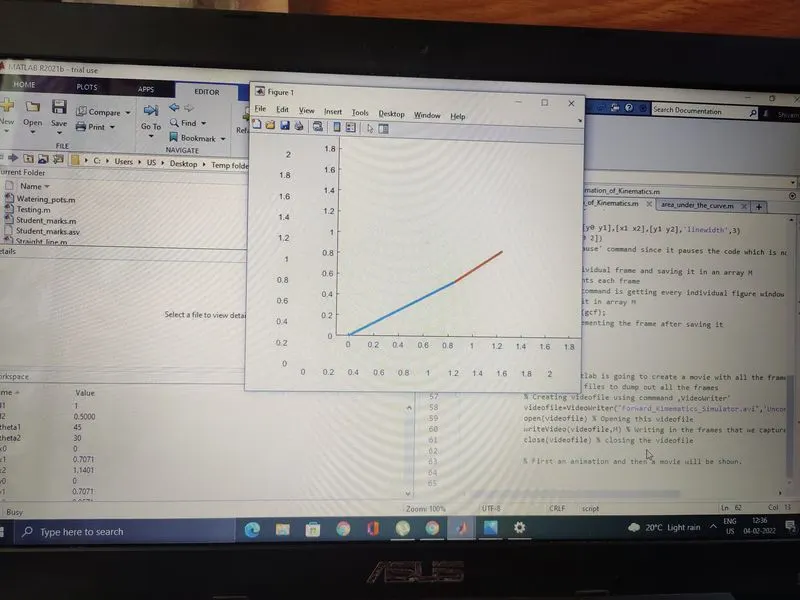
The below screenshots shows various plots obtained at different stages of the code execution:
When a single plot was obtained without the use of For loop:
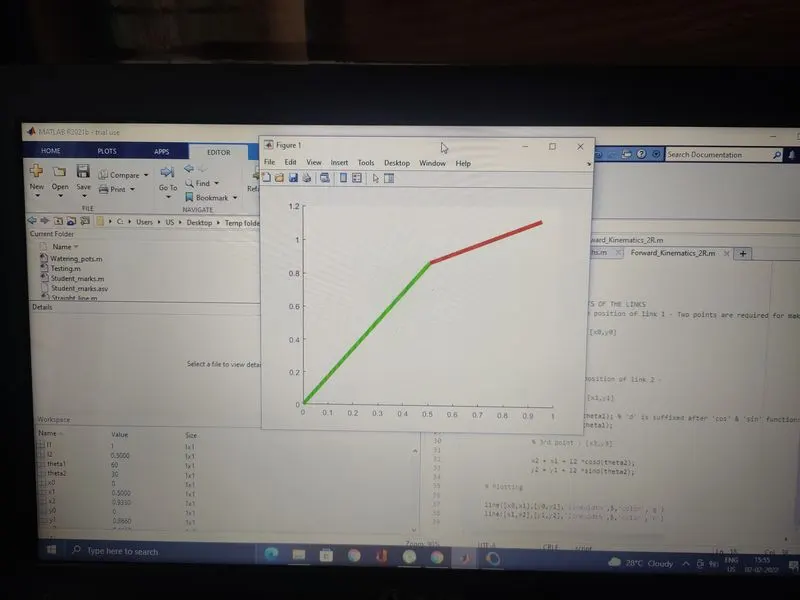
Refer point 12 : A simulation showing all the possible variations of the links in a single plot.
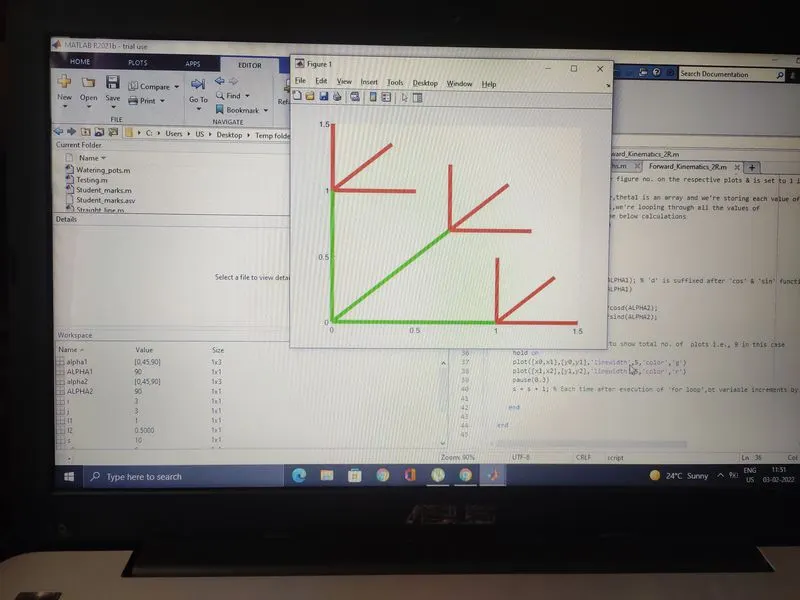
Refer point 13 : Using a single plot command instead of two.
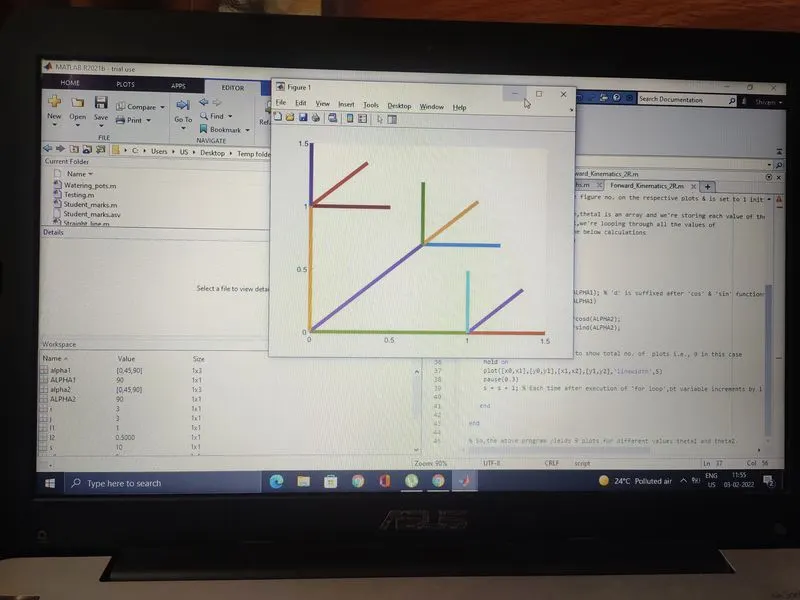
Refer point 26 :
- Removing hold on command and setting my axes to get a clear animation followed by a movie.
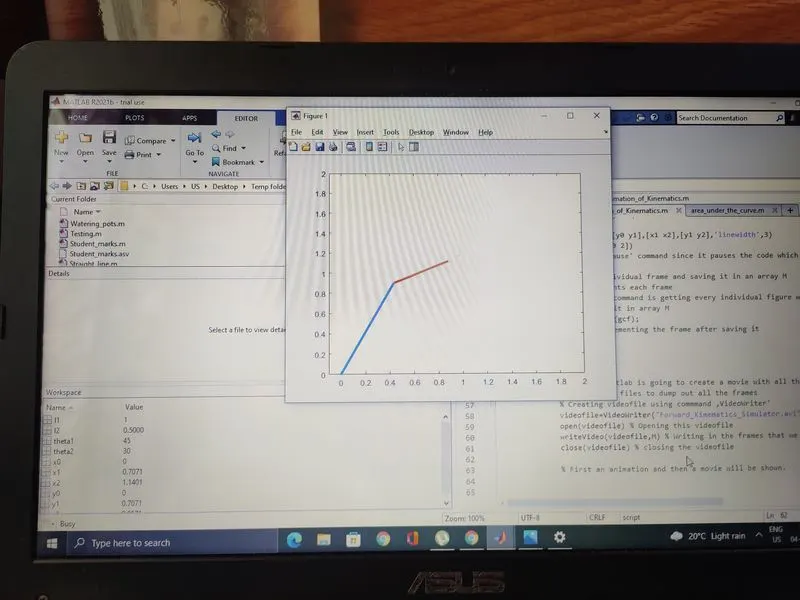
Errors:
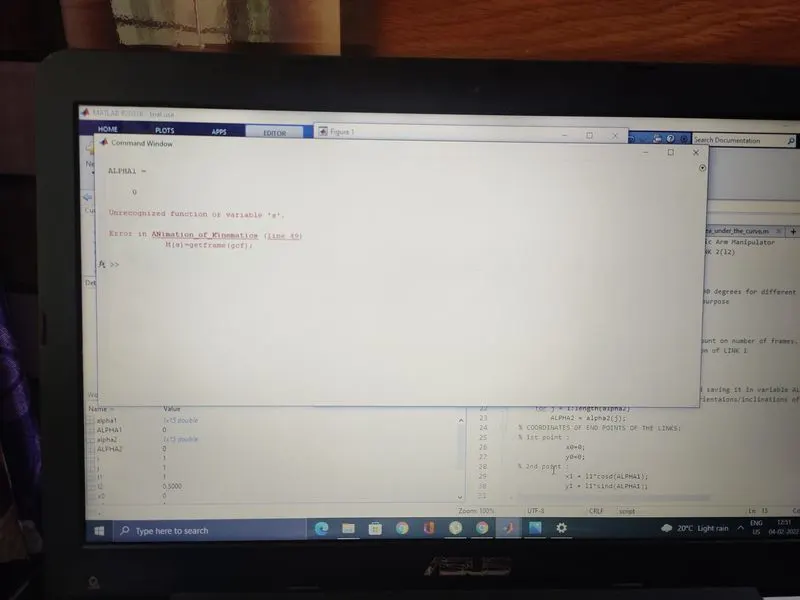
- The error came on the command window because I haven't defined the 's' variable and using it for saving it in the array M,so defining it outside the 1st for loop.