Project 1 - Parsing NASA thermodynamic data
Aim :-
- To write a function that extracts 14 coefficients and calculates the Enthapy(H),Entropy(S) and Specific Heat (Cp) for all the species in data file.
- Calculate the molecular weight of each species and display it in the command window.
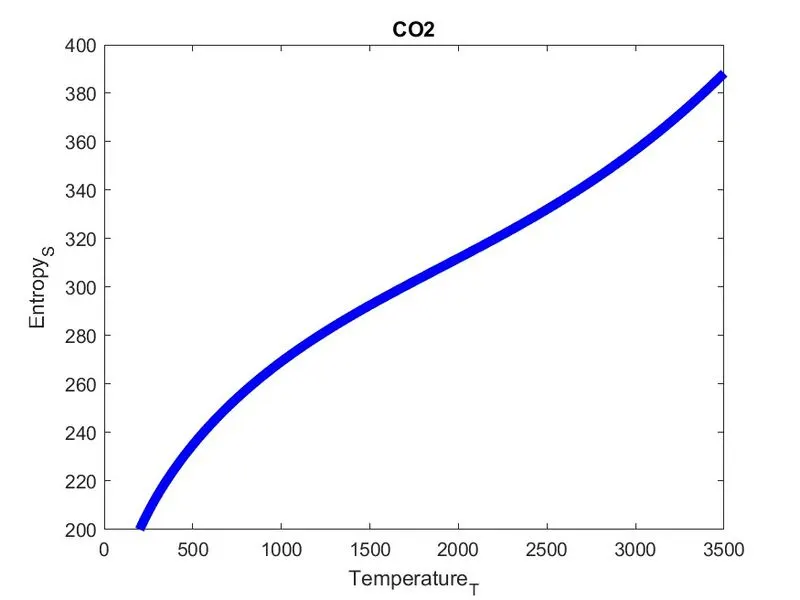
- Plot the Cp,H & S for the local temperature range specific for each species.
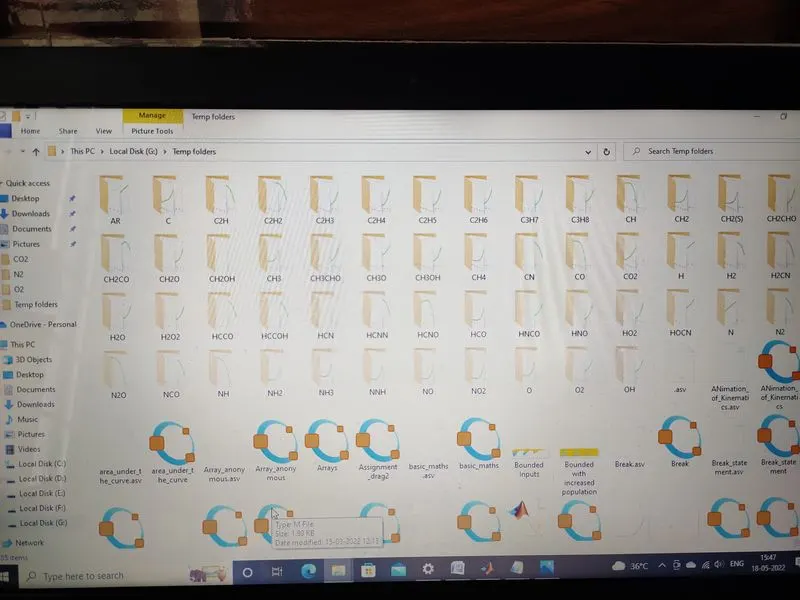
- Save the plots as images with appropriate names and dump them in separate folders for each species with suitable.All these should be generated automatically.
Governing Equations :-
`Cp/R=a1+a2 T+a3 T^2+a4 T^3+ a5*T^4`
`H/RT=a1+a2 T/2+ a3 T^2/3+ a4 T^3/4+ a5 T^4/5+a6/T`
`S/R=a1 lnT+a2 T+a3 T^2/2+ a4 T^3/3+ a5 T^4/4+ a7`
where Cp – Specific heat of species
R – Universal gas constant
H – Enthalpy
S – Entropy
T- Temperature
a1,a2,a3,a4,a5,a6,a7,a8,…a14 – coefficients of the polynomial (given in THERMO.dat file)
In the above formula we need put the 1st seven coefficients from the THERMO.dat for high temperature range and the rest seven for low temperature range.
Main program code :-
clear all
close all
clc

% Universal Gas Constant(J/K-mol)
R = 8.314;

%Reading Header Information from THERMO.dat file
f = fopen("THERMO.dat",'r');
Heading = fgetl(f);
% Getting the global temp line
tline = fgetl(f);
% Splitting the global temp values using string split command i.e.,strsplit
A = strsplit(tline,' ');
global_low_temp = str2double(A{2});
global_mid_temp = str2double(A{3});
global_high_temp = str2double(A{4});

%Skipping the three commnents line
for i = 1:3
    fgetl(f)
end


% 2nd loop to extract the species data and coeffecients
for j = 1:53
% There are total 4 rows in every species
% 'tline1 stores 1st species' row
tline1 = fgetl(f);
B = strsplit(tline1,' ');
% extracting the name of the species from the beginning of 1st line
% Storing the species name in cmpd_name variable
cmpd_name = B{(1)};

% Storing local temperatures specific to each species
local_low_temp = str2double(B{end-3});
local_high_temp = str2double(B{end-2});
local_mid_temp = str2double(B{end-1});
temp_range = linspace(local_low_temp,local_high_temp,1000);

line2 = fgetl(f);% 1st coefficient line
line3 = fgetl(f);% 2nd coefficient line
line4 = fgetl(f);% 3rd coefficient line

% Coefficients of 1st line
% Finding the 'E' character
a = strfind(line2,'E');

s1 = line2(1:a(1)+3); %1st coefficient
s2 = line2(a(1)+4:a(2)+3); % 2nd coefficient
s3 = line2(a(2)+4:a(3)+3); % 3rd coefficient
s4 = line2(a(3)+4:a(4)+3); % 4th coefficient
s5 = line2(a(4)+4:a(5)+3); % 5th coefficient


% Coefficients of 2nd line

b = strfind(line3,'E');

s6 = line3(1:b(1)+3); % 6th coeff
s7 = line3(b(1)+4:b(2)+3); % 7th coeff
s8 = line3(b(2)+4:b(3)+3); % 8th coeff
s9 = line3(b(3)+4:b(4)+3); % 9th coeff
s10 = line3(b(4)+4:b(5)+3);% 10th coeff


% Coefficients of 3rd line

c = strfind(line4,'E');

s11 = line4(1:c(1)+3); %11th coeff
s12 = line4(c(1)+4:c(2)+3);% 12th coeff
s13 = line4(c(2)+4:c(3)+3);% 13th coeff
s14 = line4(c(3)+4:c(4)+3);% 14th coeff

% Converting these coefficients into numbers for usage
% High Temperature Coefficients
% str2double is used instead of str2num because it gives a double precision array
c1 = str2double(s1);
c2 = str2double(s2);
c3 = str2double(s3);
c4 = str2double(s4);
c5 = str2double(s5);
c6 = str2double(s6);
c7 = str2double(s7);


% Low Temperature Coefficients
c8 = str2double(s8);
c9 = str2double(s9);
c10 = str2double(s10);
c11 = str2double(s11);
c12 = str2double(s12);
c13 = str2double(s13);
c14 = str2double(s14);

% Calling the function for properties calculation
[Cp,H,S] = nasa_formulae_code(c1,c2,c3,c4,c5,c6,c7,c8,c9,c10,c11,c12,c13,c14,R,temp_range,global_mid_temp);

%Step 2:- Calculation of Molecular Weight of Species
% H = 1.00797
% C = 12.011
% N = 14.0067
% O = 15.9994
% Ar = 39.948

% calling the mol_wt function
[mw]= ml_wt(cmpd_name);
fprintf('Molecular wt. of %s is %f',cmpd_name,mw);

% Properties Plotting
% Making a directory
mkdir(cmpd_name);
% Viewing the folder
cd(cmpd_name);

figure(1)
plot(temp_range,Cp,'linewidth',5,'color','r')
xlabel('Temperature_T')
ylabel('Specific Heat_Cp')
title(cmpd_name)
saveas(figure(1),'Specific Heat.jpg')
grid on

figure(2)
plot(temp_range,H,'linewidth',5,'color','g')
xlabel('Temperature_T')
ylabel('Enthalpy_H')
title(cmpd_name)
saveas(figure(2),'Enthalpy.jpg')
grid on

figure(3)
plot(temp_range,S,'linewidth',5,'color','b')
xlabel('Temperature_T')
ylabel('Entropy_S')
title(cmpd_name)
saveas(figure(3),'Entropy.jpg')
grid on

% Changing the current folder
cd ..


end
Function code for Properties calculation :-
% Cp,H & S are Specific Heat,Enthalpy and Entropy
function [Cp,H,S] = nasa_formulae_code(a1,a2,a3,a4,a5,a6,a7,a8,a9,a10,a11,a12,a13,a14,R,T,global_mid_temp)

% Gas constant (in J/K-mol)
% R = 8.314;


if (T>global_mid_temp)
Cp = (a1 + a2.*T + a3.*T.^2 + a4.*T.^3 + a5.*T.^4).*R ;
 H = (a1 + a2.*T./2 + (a3.*T.^2)./3 + (a4.*T.^3)./4 + (a5.*T.^4)./5 + a6./T)*R.*T ;
 S = (a1*log(T) + a2.*T + (a3.*T.^2)./2 + (a4.*T.^3)./3 + (a5.*T.^4)./4 +a7)*R ;

else
 Cp = (a8 + a9.*T + a10.*T.^2 + a11.*T.^3 + a12.*T.^4).*R ;
 H = (a8 + a9.*T./2 + (a10.*T.^2)./3 + (a11.*T.^3)./4 + (a12.*T.^4)./5 + a13./T)*R.*T ;
 S = (a8*log(T) + a9.*T + (a10.*T.^2)./2 + (a11.*T.^3)./3 + (a12.*T.^4)./4 +a14)*R ;

end
end
Function code for Molecular weight calculation :-
% Function for calculating molecular weight
function [mw] = ml_wt(cmpd_name )

%Creating an array of elements
ele_array  = {'H','C','N','O','A','S'};

% Storing the value of atomic mass
at_mass = [1,12,14,16,39.94,32];

% Initializing molecular weight,mw = 0
mw = 0 ;
for i = 1 : length(cmpd_name)
    for j = 1:length(ele_array)
        if strcmp(cmpd_name(i),ele_array(j))
            mw = mw + at_mass(j)

            % Storing the position for further use
            a = j ;
        end
    end
     n = str2num(cmpd_name(i));

     if(n>1)
            % molecular_weight = molecular_weight+(atomic_weight(a)*(n-1))
            mw = mw +at_mass(a)*(n-1)
       end

end

end
Workflow :-
Main Code :-
- The main objective of this project is to read the datas from the given “THERMO.dat” and use them to calculate the properties and make their corresponding plots.
- Opening the data file using fopen command to access its contents and reading from it using ‘r’ and denoting it with a file pointer ‘f’
- Reading the Header Information :Use fgetl along with the file pointer f to access the 1st line of the data file i.e., ‘THERMO’.
- Again using fgetl to read the 2nd line which is our global temperature range and storing it in tline .
- Now,since the 2nd line obtained is a string,we need to split it and convert it into a number for our usage using strsplit and str2double commands and saving the temperatures obtained as global temperature values.
- When using strsplit for splitting the string temperature values we use space as a delimiter.
- Now,the next three lines in the data file are comments so skipping it using a for loop with fgetl command.
- After these lines our 1st species ‘O’ line comes along with its local temp range followed by 3 lines containing total 14 coefficients .
- Storing the species in ‘tline’ variable and then using ‘strsplit’ command to split the species name and the local temp values which will be used for properties calculation and accessing the molecules names .
- Storing the species name in cmpd_name variable and local_low,mid &high temp variables.
- Getting the next lines using fgetl and storing it line2,line3 and line4.
- For reading the coefficients,the logic is that since every coefficient is given in scientific notation,so, we need to find the location of ‘E’ and once this is found out using ‘strfind’the next three values after that gives one coefficient and we can obtain the other coefficients using proper indexing of these strings and storing them in s1,s2,s3,….,s14 variables.
- The 1st seven coefficients are high temperature coefficients and rest seven are the low temperature coefficients.
- Converting these into a double precision array and storing in c1,c2,c3,…,c14 variables.
- Calling the properties function and molecular weight function “nasa_formulae _code” and “ml_wt” for properties and molecular weight calculation.
- Printing molecular weight usimg fprintf.
- Creating folder with name stored in variable cmpd_name using ‘mkdir’ command.
- Now,viewing this folder using ‘cd’ command and saving the three property plots inside it as images in .jpg format.
- And,finally using ‘cd . .’ to move from the current folder.
- We need to repeat the above set of commands for all the 53 species.So,we’ll use a for loop.
Function Code :-
Function code (nasa_formulae_code) for properties calculation :-
- Creating function and passing in the required parameters.
- For properties calculation the logic is, if my local temperature(T) for a particular species is > global_mid_temp i.e.,1000 , the properties are calculated using High temperature coefficients (c1,c2,..,c7) ie.,at high temperature.
- And for the rest of all the local temperature(T) values lying below 1000,the properties are calculated using Low temperature coefficients (c8,c9,..,c14).
- The coefficient values a1,a2,a3,…,a14 in the function code corresponds to c1,c2,c3,…,c14 when called in the main code.
Function code (ml_wt) for molecular weight calculation :-
- At first,storing the name and atomic mass of the elements in the ele_array and at_mass array respectively.
- Now,for molecular weight calculation assigning molecular weight,mw = 0.
- Checking the entire string i.e. species (cmpd_name) at each of its position using first for loop and comparing it with all the elements array (ele_array) values.
- Using ‘strcmp’ comparing each string value in cmpd_name with all the 6 ele_array values.
- If the above condition becomes true,molecular weight is calculated and storing this position of the 2nd for loop in ‘a’ variable.
- Now,for calculating the molecular weight of diatomic,triatomic and polyatomic molecules,another if condition is used inside the 1st for loop to check for the number of atoms of an element and calculating its corresponding molecular weight.
- In this manner the molecular weight of the entire 53 species is found out.
Plots :-
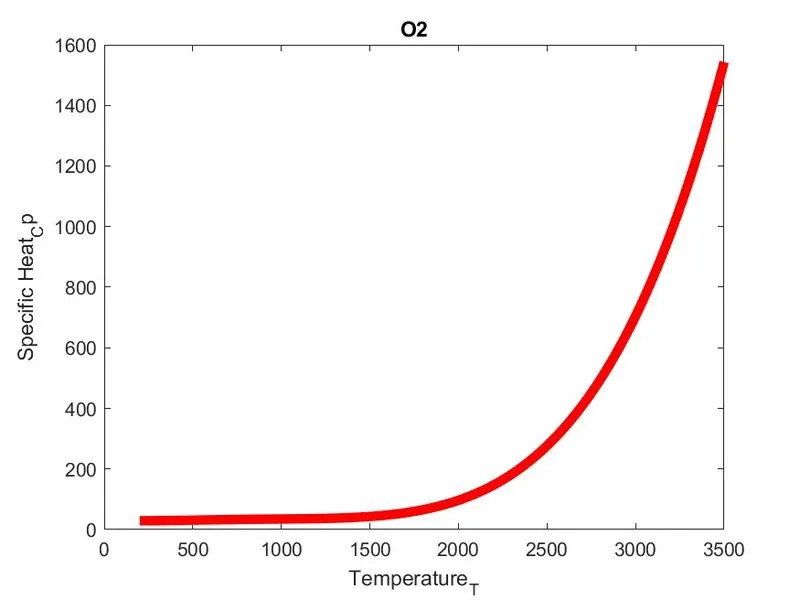
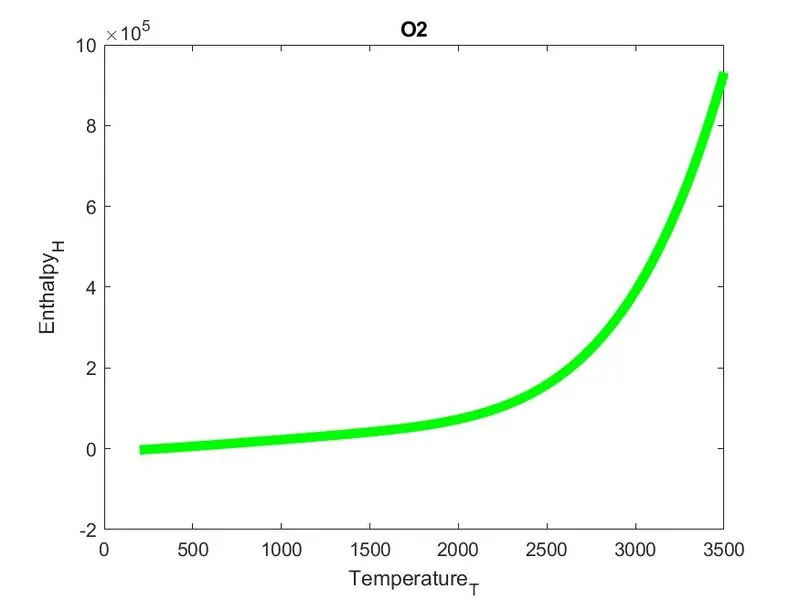
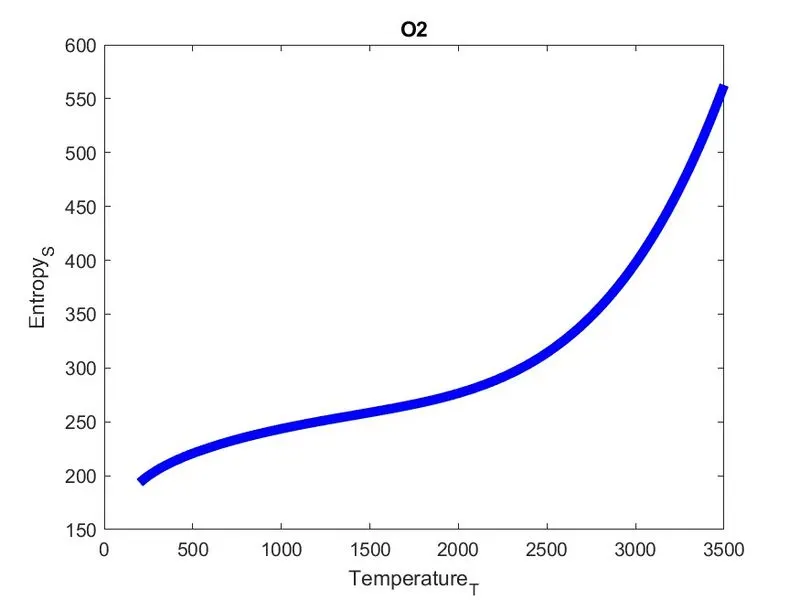
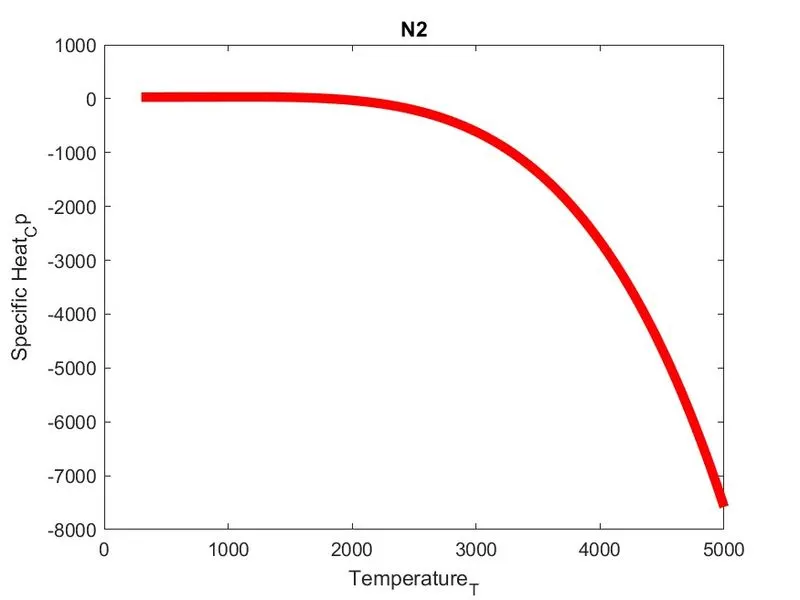
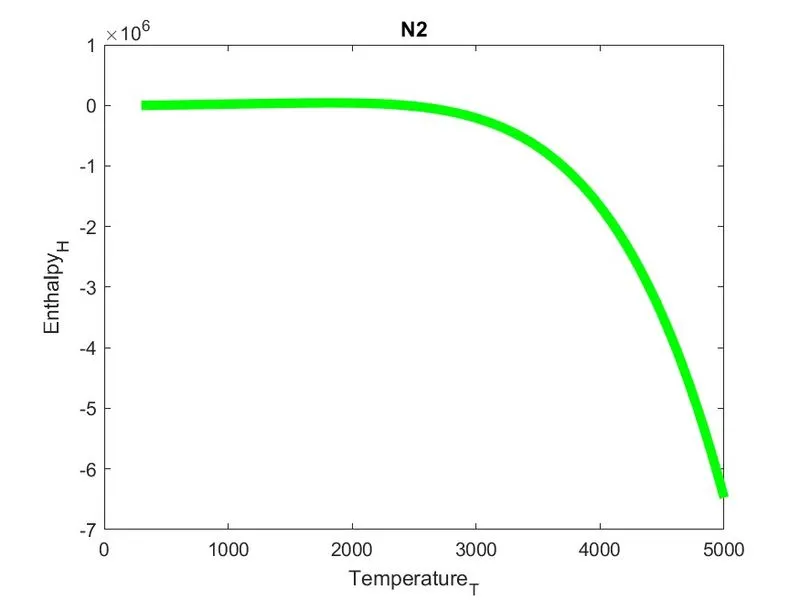
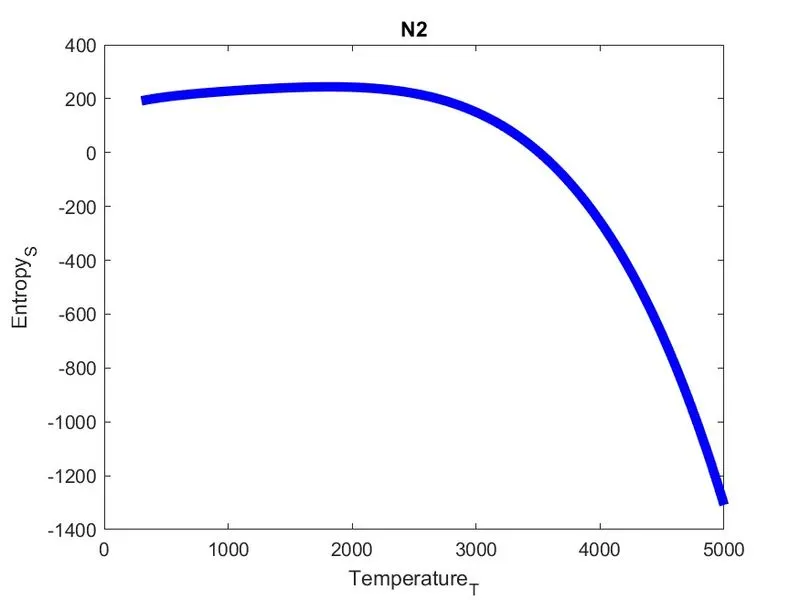
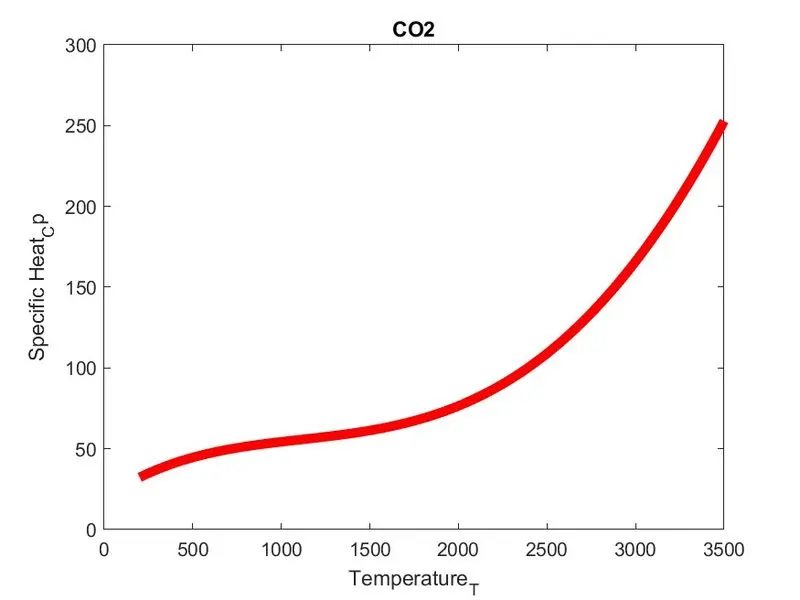
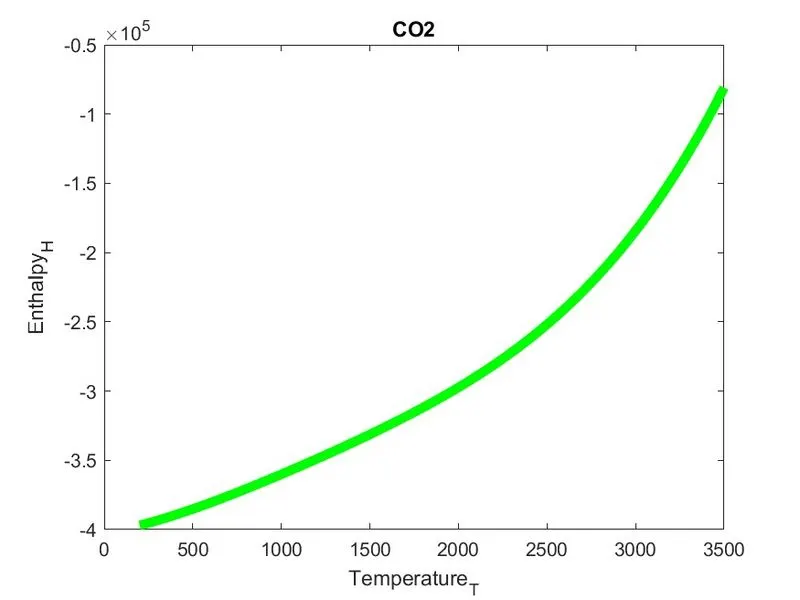
Screenshot:-
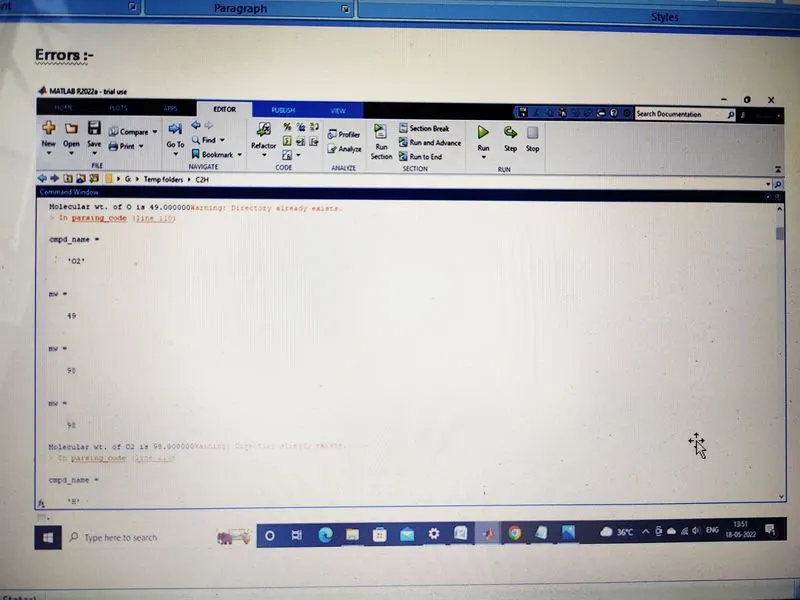
Errors :-
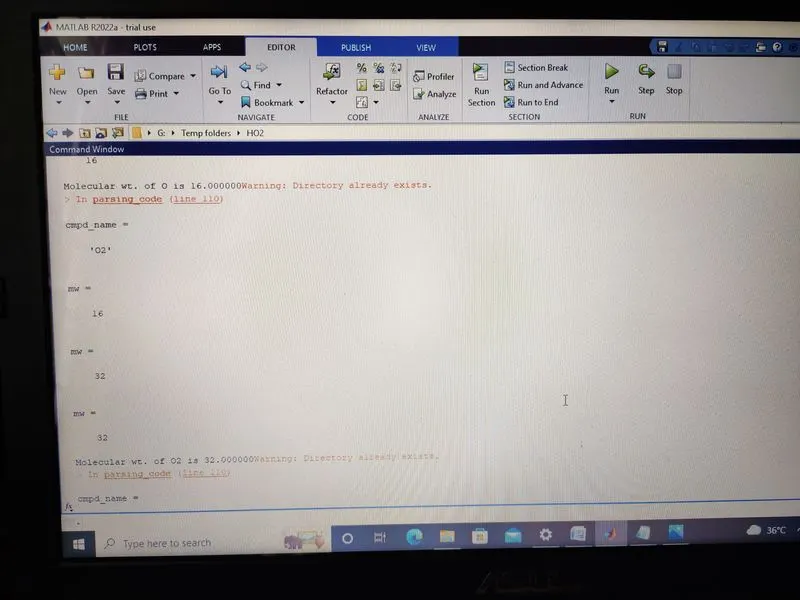
Solution: -
- As evident from above,the atomic mass of O,O2 and the rest other species is coming incorrect because,I’ve defined the atomic mass of the elements in the at_mass array inside single quotes ‘ ‘.
- So,defining these numbers as it is in the array without quotes will give correct values of molecular weight as shown below.
Conclusion:-
- From this project we learnt that how to read data from a file and use this data in our MATLAB progran.
- To create different folders,move into it & finally coming out of it after saving the plots as images.