Week 2- 2R Robotic Arm Challenge
Simulation of forward kinematics workspace of a 2R robotic arm
A 2R robotic arm is a type of robot which is capable of performing operations such as welding, painting, assembly etc and is commonly used in manufacturing and packaging industry. It comprises of 2 links and 2 joints (motors), which allow the links to rotate about its base. The final part of this robot is called manipulator or end effector which can be a painting tool, welding tool etc.
One joint is attached to a Base, about which one link can rotate. At the end of this link, is the second joint, again on which second link is attached. The manipulator is fitted at the end on the second link, providing the robot with 2 degrees of freedom. The joints usually allow for 145 degrees of maximum rotation in real world applications.
Kinematics refers to the relationship between the position of the different links and its relative velocity and acceleraation. Considering the position of the joints and end effector is plotted on Cartesian coordinates, there are two types of kinematic determinations-
- Forward Kinematics: When the coordinates for the joints are known and the aim is to determine the position of the end effector
- Inverse Kinematics: When the coordinates of the end effector are known and the aim is to determine the position of the joints
Explanation:
The aim of the Matlab program is to animate the workspace of a 2R robotic arm. First, some considerations are made-
Length of the first link l1=1 (m) (connected to the base with a joint)
Length of second link l2=0.5 (m) (usually, the second link is shorter than the first to provide stability)
Coordinate of first joint `(x0,y0)=(0,0)`
If link 1 makes an angle `θ1` with respect to the base and link 2 makes angle `θ2` with along the base,
Coordinate of second joint will be-
`x1=l1.cos(θ1)`
`y1=l1.sin(θ1)`
Thus, coordinate of the end effector (x2,y2) can be calculated relative to the coordinated of second joint
`x2=x1+l2.cos(θ2)`
`y2=y1+l2.sin(θ2)`
Once coordinates are calculated, the plot is made.
Code:
clear all
clc
l1=1;                   %length of link 1
l2=0.5;                 %length of link 2
t1=linspace(0,90,10);   %array for angles made by link 1 w.r.t base
t2=linspace(0,90,10);   %array for angles made by link 2 w.r.t base
ctr=1;                  %counter
for i=1:length(t1)      %first for loop
   T1=t1(i);            %T1 variable stores ith value from t1 array
    for j=1:length(t2)  %second for loop
        T2=t2(j);       %T1 variable stores ith value from t1 array
        x0=0;           %Coordinates for joints
        y0=0;
        x1=l1*cosd(T1)
        y1=l1*sind(T1)
        x2=x1+l2*cosd(T2)
        y2=y1+l2*sind(T2)

        %Plot
        plot([x0 x1],[y0 y1],[x1 x2],[y1 y2], 'LineWidth',3);
        axis([-0.5 2, 0 2]);    %specified the range of x axis & y axis
        pause(0.5);
        V(ctr)=getframe(gcf);   %V array stores frames of the plot
        ctr=ctr+1;              %counter incremented
    end
end                             %closed for loops
movie(V)                        %movie command to generate video
video_file=VideoWriter('Forward_kine_2R_robot_arm.avi', 'Uncompressed AVI');
open(video_file);
writeVideo(video_file,V);
close(video_file);
%program end
Link to Gdrive video file:
https://drive.google.com/file/d/1lMG5GiLc31-zpZBvl1hUDXfzQJBsBtfQ/view?usp=sharing
Code explanation:
The lengths of the links are already specified, so variables l1 and l2 were defined. Since the angles θ1 and θ2 are supposed to change from 0 to 90 (example taken for this problem), arrays t1 and t2 were defined using the linspace command, each containing 10 points between 0 and 90.
The next step is to use a nested for loop to calculate the relative coordinates of the joints. Each for loop gets executed 10 times (the number of different angles of θ1 and θ2). A variable ctr is defined as a counter. Two new variables T1 and T2 are defined to call the elements of t1 and t2 arrays respectively, within the nested loop. The formulas for calculating the coordinates are then defined and plot command is used to obtain the graph. For each execution of the for loop, a pause command is added. Then, getframe command is used to capture each plot with each execution of for loops and store it in an array called V. The counter ctr is incremented by 1 before closing the for loops.
Next, Movie(V) command is used to stitch all the frames from array V to create a video file. The remaining commands are about specifing video file name (to be saved as .avi format), opening the video file, writing to it and closing.
Errors encountered:
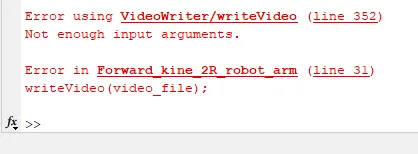
There was only one instance of error, due to array V not specified as input in line 30.
writeVideo(video_file);Respective error message: