Week 2- 2R Robotic Arm Challenge
This is the link to my animation video on youtube of my plot of the 'simulation of the forward kinematics of a 2R Robotic Arm manipulator'.https://youtu.be/BbqLP7PfpDE
% Forward kinematics of a 2R robotic arm manipulator

close all
clc

% inputs (for link1 & link2)
l1=1.5;
l2=1;

theta1=linspace(0,90,10);
theta2=linspace(0,90,10);

ct=1;
for i=1:length(theta1)
    THETA1=theta1(i);
    for j=1:length(theta2)
        THETA2=theta2(j);

% coordinates (by trigonometric ratios)
x0=0;
y0=0;

x1=l1*cosd(THETA1);
y1=l1*sind(THETA1);

x2=x1+l2*cosd(THETA2);
y2=y1+l2*sind(THETA2);

% plotting
plot([x0 x1],[y0 y1], [x1 x2],[y1 y2],'LINEWIDTH',3)
axis([-0.1 2.6 0 2.6])
pause(0.03)
M(ct)=getframe(gcf);
ct=ct+1;
    end
end

movie(M)
videofile=VideoWriter('forward_kinematic.avi','Uncompressed AVI');
open(videofile)
writeVideo(videofile,M)
close(videofile)
The above are the codes with their comments which I used in my program to simulate 'the forward kinematics of a 2R Robotic Arm manipulator'. With that, I also attached the MATLAB files of the type(.m) of the program named 'Challenge_forward_kinematics_of_a_2R_robotic_arm' ( 'forward kinematics of a 2R Robotic Arm manipulator'). And also I have given the youtube link of the respective animation video of the simulation of this program at the first line of this challenge.
I also use semi-colons at the end of some codes as it prevents the program to display on the command window but it gets executed. In other words, the semi-colon gives us the option to print or unprinted the output on the command window.
- Step-wise explanation of my codes as follows:
- Now, explaining the codes with their outputs as screenshots and also explaining the results of the codes of the program named as 'forward kinematics of a 2R Robotic Arm manipulator'
1.
close all
clc
% inputs (for link1 & link2)
l1=1.5;
l2=1;
theta1=linspace(0,90,10);
theta2=linspace(0,90,10);
The output of the above codes can be seen in the below screenshot after the explanation of the above codes.
The first two codes 'close all' & 'clc' can/can't be used (not compulsory) but I used as during initiation if there is any window like 'figure' opened then it will be closed automatically by using the code
close alland if there is anything displayed or printed as an output in the command window then it will be cleared by using the code
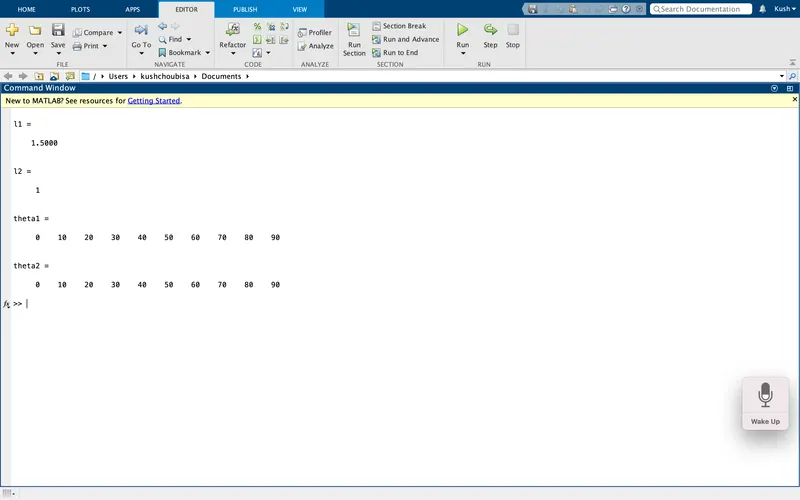
clcAnd the codes ('l1') & ('l2') as shown above are the variables to which we assign a value(scalar number) which gets executed on running these codes and gets printed on the command window as an output (as shown below).
But the code
linspaceis not a simple code but is an inbuilt code also known as the command of the MATLAB which is used to create a 1D array of the numbers from the first to the last with a desired no. of values as in the above example the numbers are from 0 to 90 with 'ten' values is assigned to the variables as 'theta1' & 'theta2' as can be seen in the below screenshots in the 'command' window of the MATLAB.
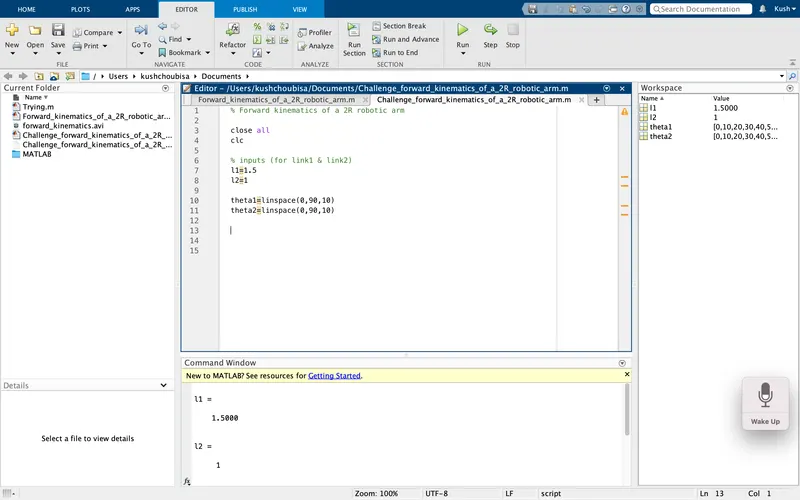
The above is the screenshot of the codes which are written in the 'editor window' of MATLAB.
And the below screenshot contains the outputs in the command window of the above screenshot and also the outputs can be seen in the 'workspace' of the above screenshot.
2.
ct=1;The above code 'ct' is used when we are going to make an animation of the simulation of the robotic arm at every value of 'theta1' & 'theta2'. And this code in full terms is known as counter. Actually, this code is the command of MATLAB for making an animation or movie of the simulation of the program as with this command, we can control the frames of the simulations. So this code consists of all the frames which can be like the 'figure' window which are used to make an animation.
So to initiate a frame for an animation, we have to make
ct=1;'ct' is equal to '1' and this should be done before the 'for loop' (which I will explain in the next) if we are going to use the 'for loop' to run the program. For the simulations like an animated video (but actually not an animation), we have to run a 'for loop' in the MATLAB program with the 'pause()' command but this command decreases the performance of the program at every execution of the code so we make the animation using the above-highlighted code.
3.
for i=1:length(theta1)
    THETA1=theta1(i);
    for j=1:length(theta2)
        THETA2=theta2(j);

% coordinates (by trigonometric ratios)
x0=0;
y0=0;

x1=l1*cosd(THETA1);
y1=l1*sind(THETA1);

x2=x1+l2*cosd(THETA2);
y2=y1+l2*sind(THETA2);

% plotting
plot([x0 x1],[y0 y1], [x1 x2],[y1 y2],'LINEWIDTH',3)
axis([-0.1 2.6 0 2.6])
pause(0.03)
M(ct)=getframe(gcf);
ct=ct+1;
    end
end
In this, the codes are written under 'for loop' to change the values of 'theta1' & 'theta2' using the program i.e. the values should change automatically by using the 'for loop' rather than manually for the simulation.
The output of the 'for loop' can be seen in a 'figure' window as well as in the animation video for that I attached a youtube link of that at the starting of the report. And also the output of this 'for loop' can be seen in the 'command' window but I didn't attach its screenshot as it has more than 100 values of its variables as well as other predefined codes because the output of this 'for loop' in the 'command' window contains the structure arrays also, which consists of many types of data. So it will be inconvenient to attach the screenshot of the output in the 'command' window as it will be much bigger. But you can see its animation video as an output that I attached.
Now, under the 'for loop', I am explaining each & every code that I use and why I use it, I am explaining this as follows:
-
i=1:length(theta1)
Here, 'i' is the loop operator of this 'for loop' as the loop operator 'i' is used to execute the codes under this 'for loop' (with the same loop operator) at many times with different assigned values at each time with each value out of the different assigned values.
Here, you can see that on the R.H.S. of loop operator 'i', it is written as '1:length(theta1)' which means that the loop operator 'i' operates the 'for loop' from '1' to the 'length(theta1)', as 'length(theta1)' is nothing, it is just the total no. of contained values in the array 'theta1'. Here, in this program 'length('theta1') is equal to '10' as 'theta1' contains ten values. So the loop operator 'i' operates the 'for loop' 10 times with each value of 'theta1' at each time.
ii.
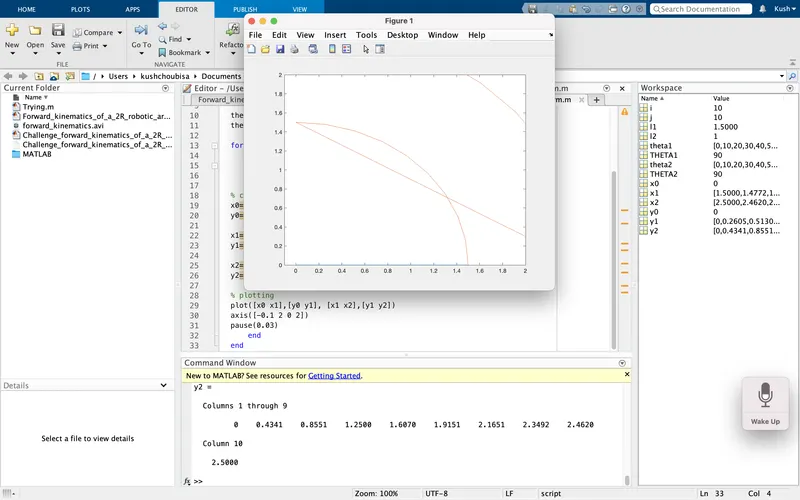
THETA1=theta1(i)We want to run a 'for loop' for 'theta 1' as well as for 'theta2' (as for different positions of link1 & link2) to change their values automatically using programming. We need to change each & every value of 'theta1' that's why we use the loop operator 'i' after this as an input for the particular value of 'theta1'. As you can see from the above codes that I assign a variable as THETA1 (to the L.H.S.) to 'theta1(i)', similarly, it will be for 'theta2(i)' also. What happens, if we do not assign a variable to it? If we do not assign a variable to it then its execution gets malfunctioned and it will give us a different plot as output and similarly, this will be applied for 'theta2(i)' also which now I am going to explain to you. And this malfunctioned or miss-compilation of code can be seen in the form of the different plots (inappropriate plot) as follows:
iii.
for j=1:length(theta2)Under the previous 'for loop', we run another 'for loop' for 'theta2' with the loop operator as 'j'.
We run this 'for loop' for 'theta2' under the 'for loop' of 'theta1' as at each value of 'theta1'(each position of link1), 'theta2' takes its each & every value( each & every position of link2) that means that at each position of link1, link2 takes it's each & every(multiple) position which all depends on the values of 'theta1' & 'theta2'. That's why we run the 'for loop' of 'theta2' (with the loop operator as 'j') under the 'for loop' of 'theta1'. And the concept of R.H.S. of the loop operator 'j' of the above code line is similar to that of the previous 'for loop' operator 'i'. So this 'for loop' will compile/run many times on the basis of 'length(theta2)'.
iv.
THETA2=theta2(j);We need to change each & every value of 'theta2' that's why we use the loop operator 'j' after this as an input for the particular value of 'theta2'. As you can see from the above codes that I assign a variable as THETA2 (to the L.H.S.) to 'theta2(j)'.
If we do not assign a variable to 'theta2(j)' then its execution gets malfunctioned and it will give us a different plot as an output. And this malfunctioned or miss-compilation of code can be seen in the form of the different plots (inappropriate plot) as can be seen in the above screenshot.
v.
% coordinates (by trigonometric ratios)
x0=0;
y0=0;

x1=l1*cosd(THETA1);
y1=l1*sind(THETA1);

x2=x1+l2*cosd(THETA2);
y2=y1+l2*sind(THETA2);
The above are the coordinates of link1 & link2 of the robotic arm, which are defined and written in the form of codes for the execution. The coordinates 'x0=0' & 'y0=0' is the coordinate of the starting point of the link1 as well as the origin of the 2D X-Y coordinate system under which we analyze the simulation of the robotic arm.
x1=l1*cosd(THETA1);
y1=l1*sind(THETA1);
The above code lines are the (x,y) coordinates of the ending point of the link1 of length 'l1' and the starting point of the link2.
And these coordinates are obtained using trigonometric ratios from the geometry of the 2R robotic arm. And its output in the 'command' window is much bigger as it has the variable 'THETA1' which consists of the array as 'theta1' so I didn't attach the screenshot of the output for convenience.
x2=x1+l2*cosd(THETA2);
y2=y1+l2*sind(THETA2);
The above code lines are the (x,y) coordinates of the endpoint of the link2 of length 'l2' as well as the endpoint coordinates of the whole arm of the 2R robotic arm that's why it is the sum of the coordinates of link1 of length 'l1' as well as the link2 of the length 'l2' as you can see from the above code line.
And these coordinates are obtained using trigonometric ratios from the geometry of the 2R robotic arm. And its output in the 'command' window is much bigger as it has the variable 'THETA1' & 'THETA2' which consists of the array as 'theta1' & 'theta2' so I didn't attach the screenshot of the output for convenience.
vi.
% plotting
plot([x0 x1],[y0 y1], [x1 x2],[y1 y2],'LINEWIDTH',3)
axis([-0.1 2.6 0 2.6])
pause(0.03)
M(ct)=getframe(gcf);
ct=ct+1;
    end
end
This is the plotting section under 'for loop'. So I am explaining each & every code as follows:
plot([x0 x1],[y0 y1], [x1 x2],[y1 y2],'LINEWIDTH',3)The above code line is used for the plotting of the data. As you can see the first code of the code line is 'plot'. So as the name suggests, it is used for the plotting and it is an inbuilt code of the MATLAB.
After that code 'plot', there is a parenthesis under which we put our inputs as a curve inside the plot with its x & y coordinates with the line/curve specifications as like 'linewidth'(for the desired width of the curve), 'color'(for the desired color of the curve).
And the most important point is that these inputs first expect the x-coordinate, then y-coordinates as you can see from the above code line.
Here, we plot the link1 & link2 of the robotic arm so
at first, we put the inputs of link1 as its x & y coordinates so you can see from the above code line that we put x-coordinates of link1 first as [xo x1] then its y-coordinates as [y0 y1], then in a similar manner we put for the link2 also. And after that, we put the line/curve specifications (here, it is as 'linewidth' which is 3).
axis([-0.1 2.6 0 2.6])The above code line is used when we want to fix the x & y limits of the axes. So you can see from the above code line that this code line starts with the inbuilt code as 'axis'.
After the code 'axis', there is a parenthesis under which we put our x & y limits as inputs.
The same concept applies here as of the previous one as the MATLAB first expects the x inputs/coordinates then y inputs/coordinates.
Here, in the above code line under parenthesis with square brackets, '-0.1' & '2.6' are the x-limits and '0' & '2.6' are the y-limits. The above entities are under the square brackets because these entities are stored in the form of the array as MATLAB stores every entity of the same type in the form of an array.
pause(0.03)The above code 'pause' with input in the parenthesis is used to pause the program when the program uses more than one value as one value at a time just like in 'for loop'. So it is an inbuilt code as 'pause' for the program to be paused for seconds which will be as an input in the parenthesis. As can be seen in the above code that the input of this code is '0.03' which is in seconds by default. So the program is paused for '0.03' seconds and then takes another value from the program and then again executed and then again paused for the given seconds and it keeps on going until it takes all the values from the program.
M(ct)=getframe(gcf);The above code line is used when we want to make an animation or movie of the simulating program. We can analyze the simulating program without the movie or animation but the problem is that for simulation of the program, we used the 'pause()' command which pauses the program again & again which decreases the performance of the program so we make an animation of the simulating program so as to stop the usage of the 'pause()' command.
Here, in the above code line, 'ct' is an array that contains all the frames or figures windows which all are used to make an animation video so for collecting all the frames, the array 'ct' is assigned to a variable 'M'.
Note: for all this, we need to define 'ct=1' to initiate the frame and it is done before the 'for loop'.
And on R.H.S., 'getframe()' is a command of MATLAB which is used to get all the frames with the parenthesis under which we put our input, here our input in the form of 'figure' windows for which we wrote 'gcf' inside the parenthesis.
ct=ct+1;And after all this, we need to increment the 'ct' by 1 so as 'ct=ct+1' as can be seen from the above code line. So that during simulation, each & every frame gets executed/run one by one after each other.
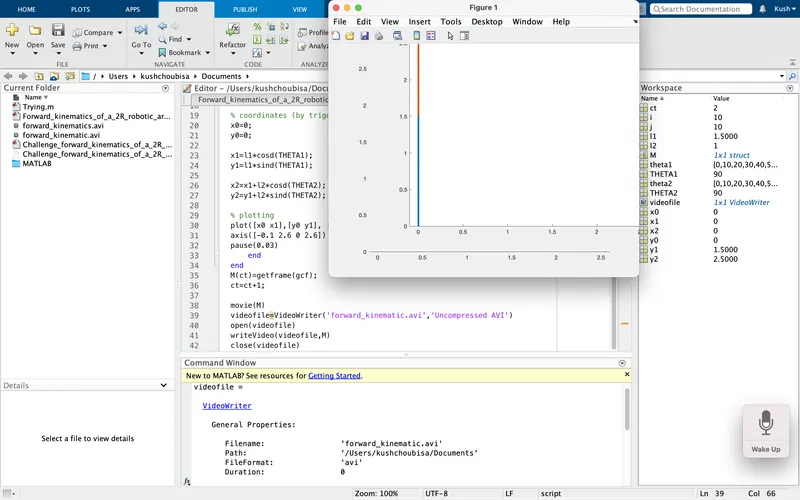
But the above code line should be written inside the 'for loop'. If not, then the simulation will not occur as each & every frame is obtained when the values of the parameters change automatically using 'for loop' so the increment of 'ct' which consists of all the frames must be done inside the 'for loop'. It can be seen in the below screenshot as follows:
end
end
The above codes 'end' is used to close/complete the 'for loop'. Here we use two codes of 'end' as we started two 'for loop'.
4.
movie(M)
videofile=VideoWriter('forward_kinematic.avi','Uncompressed AVI');
open(videofile)
writeVideo(videofile,M)
close(videofile)
The above code lines are used to make a file of a movie/animation.
That's why on the first code line, we use the inbuilt code 'movie' to which we give input as an array 'M' so as to play the movie of all the collected frames in the array 'M'.
videofile=VideoWriter('forward_kinematic.avi','Uncompressed AVI');The above code line is used to make the file of the animating video so we used the command 'VideoWriter()' on R.H.S. to make the video file of the animating video, that's why we assign this to the variable as 'videofile' on R.H.S.
The command 'VideoWriter()' is with the parenthesis is used to make an animating file. The parenthesis with this is used to put an input inside it. And the inputs to this command are the 'file name' and the 'profile' of the file.
As can be seen from the above code line that the file name is 'forward_kinematics.avi' & the profile is 'uncompressed AVI'.
When we run this above code line then its output on the 'command' window gives us the description of the video file as can be seen from the below screenshot:
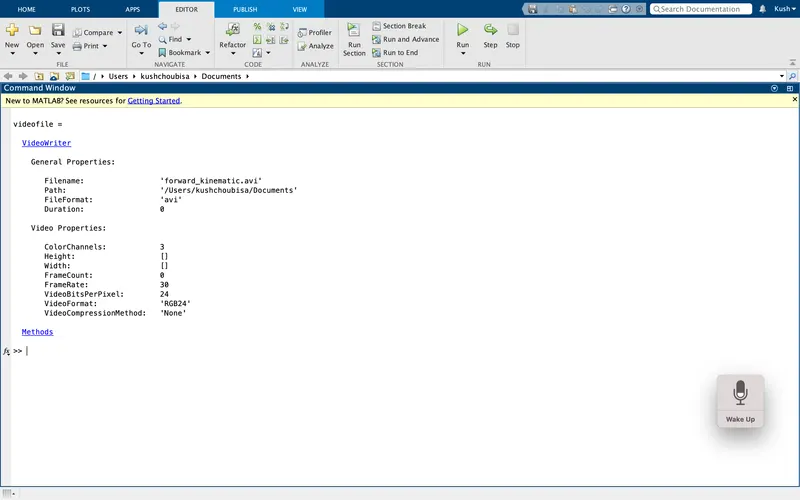
open(videofile)The above command 'open()' is used to add the functionality of opening to the file which is written as an input in the parenthesis with the 'open' command. Here, the input is the name of the file 'videofile'.
writeVideo(videofile,M)The above command 'writeVideo()' with inputs in the parenthesis is used to write the frames in the file name of your video so that as an input in the parenthesis, we put the file name under which we write the frames which are collected in the array 'M'. That's why we put inputs as 'videofile,M' inside the parenthesis as an input.
close(videofile)We make the animation file named 'videofile' using the command 'VideoWriter()' with the file name & its profile as the inputs.
After the making of this file, we need to open the file so we add the functionality of open using the command 'open()' with the input as a file name.
After opening the file, we need to write the frames in the file so we use the command 'writeVideo()' with the file name & array of frames as the inputs. So we can play this video file.
Now, after playing the file, we need to close the file so we add the functionality of closing the file using the command 'close()' with the file name as an input.
- Now, I am going to mention the errors faced while programming with their screenshots and the steps taken to overcome those errors as follows:
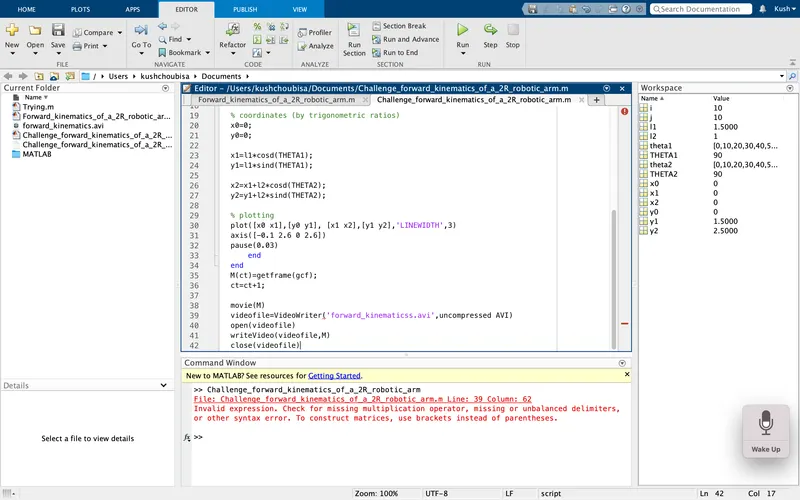
This error was faced when I was making the animation file named 'videofile'. At that time, by giving the input to the command 'VideoWriter', I forget to close the profile of the file inside the inverted commas. So MATLAB throws an error in the 'command' window as can be seen in the above screenshot.
So when I close the profile of the file in inverted commas then I overcome this error and got the animation file inside my system folder.
2. 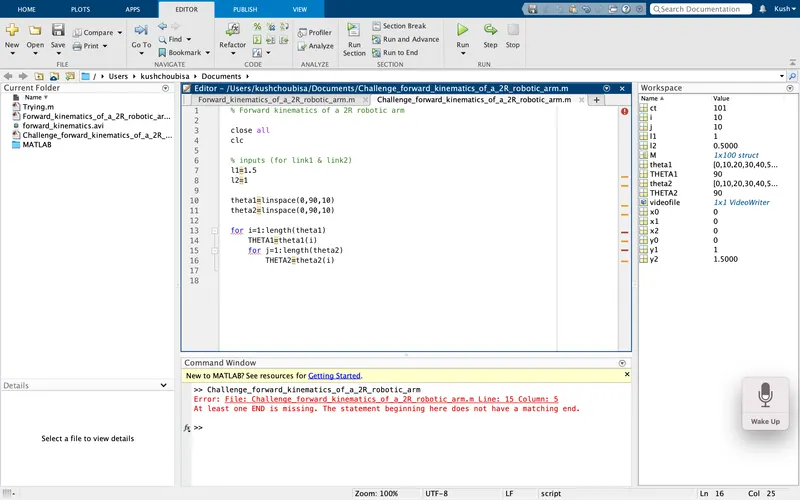
Actually, as you can see in the above screenshot that this was my silly mistake as I run the program in between the 'for loop' when it is incomplete so the MATLAB throws an error in the 'command' window.
To overcome this error, I complete the 'for loop' using the 'end' code, and then the program was executed.
3.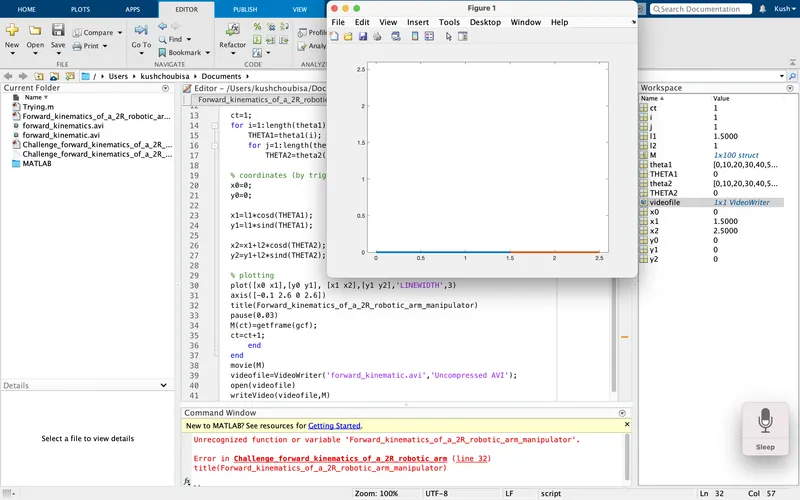
This error occurred because of the title of the plot as can be seen from the above screenshot.
As I tried to insert the title from the 'figure' window option 'insert' but it didn't work then I tried it using the programing but my experiment goes wrong. So I erase the code which is at line 32 to overcome the error but I am unable to insert the title to this plot.
4. 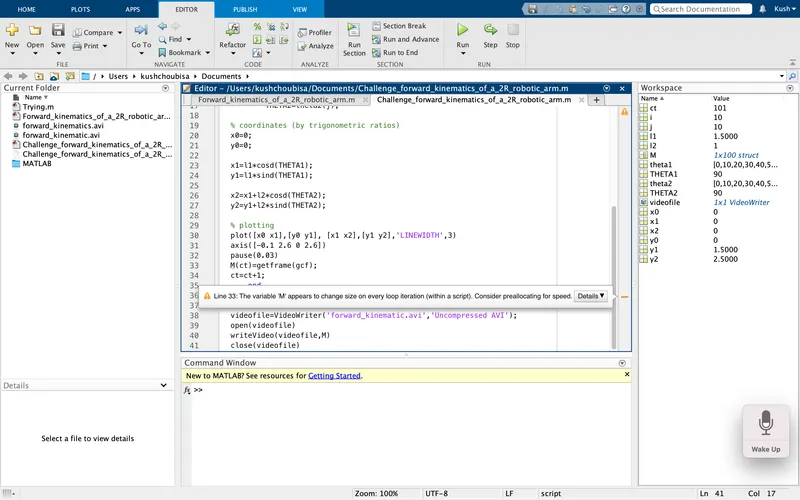
Actually, the error in the above screenshot is not overcome by me be because I don't understand the error as well as it is also not taught in the course video also but I try on thinking about this error but I didn't get any hint about this error so I leave it in this way. But according to me, it doesn't affect the running of my program.
- So I upload the animation on youtube and also I provide you with the link as an attachment on the first line of this report.
- I also insert the codes which I used in my program using the option 'Insert/edit' code sample with its usage & explanation as well as with the screenshots of the output in the 'command' window.
- I also mention the errors that are thrown on the 'command' window with the screenshots, that I faced while programming.
- I mention the steps that I had taken to overcome these errors.
So with all these, I am going to end and submit this challenge.