Project 1 - Parsing NASA thermodynamic data
Aim:- Parsing NASA thermodynamic data
Objectives:-
- Write a function that extracts the 14 coefficients and calculates the enthalpy, entropy, and specific heats for all the species in the data file & read the NASA thermodynamic file using the commands 'fopen' & 'fgetl' command.
- Calculate the molecular weight of each species and display it in the command window.
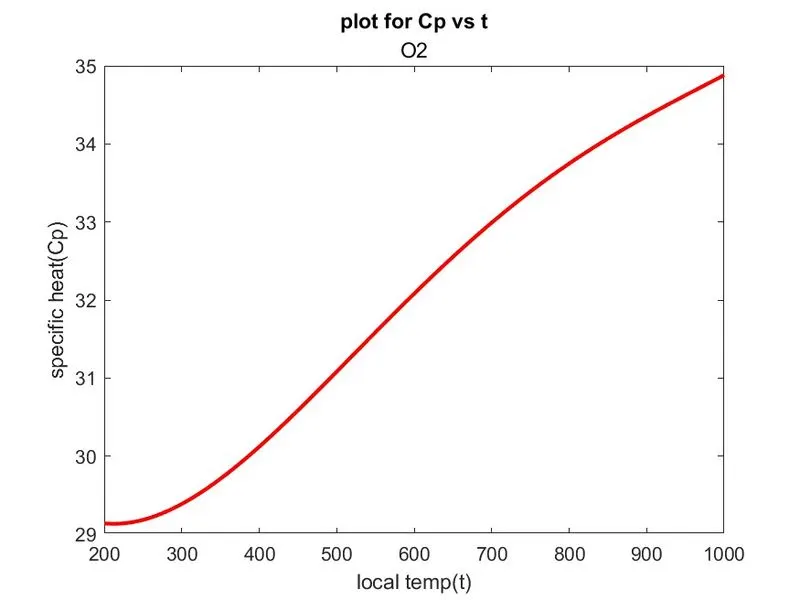
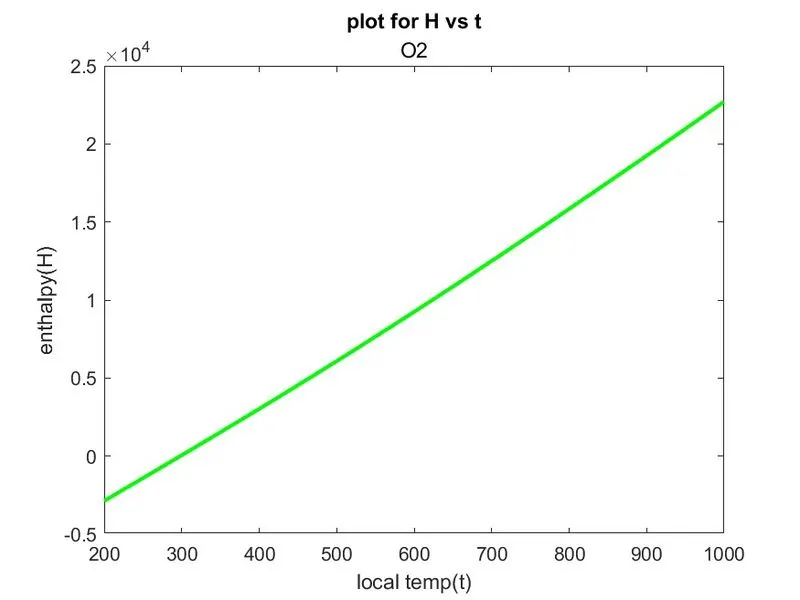
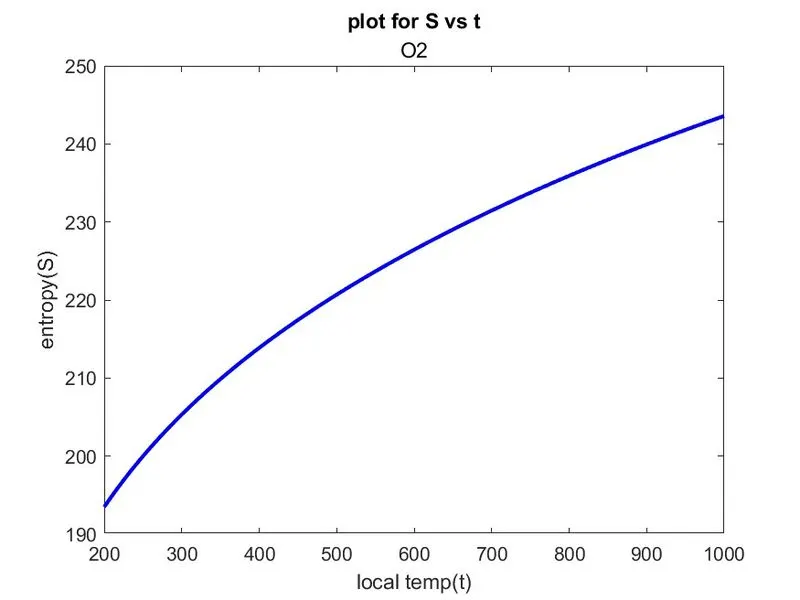
- Plot the Cp, Enthalpy, and Entropy for each species's local temperature range (low temperature: high temperature).
- Save the plots as images with appropriate names and dump them in separate folders for each species with a proper name. All these should be generated automatically.
- The main program that I will submit will just take the "THERMO.dat" file as an input and generate Cp, H, and S plots.
As per Objective 1., The thermodynamic properties such as enthalpy, entropy, & specific heat must be calculated for all species so for that I need to make a function of these thermodynamic properties to calculate it by calling these in our main program. So I am showing & explaining each function one by one as follows:
- Enthalpy:
% function for the enthalpy

% H=(a1+a2T/2+a3T^2/3+a4T^3/4+a5T^4/5+a6/T)*R*temp
%first 7 coeffs. are high temp. coeff & second 7 coeffs. are low temp coeff

function H=enthalpy(a1,a2,a3,a4,a5,a6,a8,a9,a10,a11,a12,a13,temp,R,local_mid_temp)

% Providing condition for the coefficients acc. to low or high temp
if temp<=local_mid_temp
   H=(a8+(a9*temp./2)+(a10*temp.^2)/3+(a11*temp.^3)/4+(a12*temp.^4)/5+(a13./temp)).*(temp*R);
else
   H=(a1+(a2*temp./2)+(a3*temp.^2)/3+(a4*temp.^3)/4+(a5*temp.^4)/5+a6./temp).*(temp*R);
end
end
The above is the function of the enthalpy. The formula to calculate the enthalpy is given according to the low or high-temperature range so on that basis we have to make a function for the enthalpy. So the formula is written in the code form in the function as
% function for the enthalpy

% H=(a1+a2T/2+a3T^2/3+a4T^3/4+a5T^4/5+a6/T)*R*temp
%first 7 coeffs. are high temp. coeff & second 7 coeffs. are low temp coeff

function H=enthalpy(a1,a2,a3,a4,a5,a6,a8,a9,a10,a11,a12,a13,temp,R,local_mid_temp)
For this coded formula containing the coefficients under the parenthesis, we have a condition for using these coefficients (a1-a14) as for low-temperature range, we will use the second 7 coefficients, or for high-temperature range, we use the first 7 coefficients as you can see in the above comment. So to code that we use the 'if' & 'else' commands for low or high temperatures to use the appropriate coefficients as follows:
% Providing condition for the coefficients acc. to low or high temp
if temp<=local_mid_temp
   H=(a8+(a9*temp./2)+(a10*temp.^2)/3+(a11*temp.^3)/4+(a12*temp.^4)/5+(a13./temp)).*(temp*R);
else
   H=(a1+(a2*temp./2)+(a3*temp.^2)/3+(a4*temp.^3)/4+(a5*temp.^4)/5+a6./temp).*(temp*R);
end
We have stored the local temperature ranges for each species from the NASA thermodynamic data. That temperature ranges from low to mid & mid to high so to code the low & high temperatures under the 'if' & 'else' command we use the local_mid_temp with the inequality as you can see in the above 'if' 'else' command section. So if the temperature is low then it will be less than local_mid_temp or vice versa.
ii. Entropy:
% function for the entropy

% s=(a1 logT+a2T+a3T^2/2+a4T^3/3+a5T^4/4+a7)*R
%first 7 coeffs. are high temp. coeff & second 7 coeffs. are low temp coeff

function S=entropy(a1,a2,a3,a4,a5,a7,a8,a9,a10,a11,a12,a14,temp,R,local_mid_temp)

% Providing condition for the coefficients acc. to low or high temp
if temp<=local_mid_temp
    S=((a8*log(temp))+(a9*temp)+(a10*temp.^2/2)+(a11*temp.^3/3)+(a12*temp.^4/4)+(a14))*R;
else
    S=((a1*log(temp))+(a2*temp)+(a3*temp.^2/2)+(a4*temp.^3/3)+(a5*temp.^4/4)+(a7))*R;
end
end
The above is the function of the entropy. The formula to calculate the entropy is given according to the low or high-temperature range so on that basis we have to make a function for the entropy. So the formula is written in the code form in the function as
% function for the entropy

% s=(a1 logT+a2T+a3T^2/2+a4T^3/3+a5T^4/4+a7)*R
%first 7 coeffs. are high temp. coeff & second 7 coeffs. are low temp coeff

function S=entropy(a1,a2,a3,a4,a5,a7,a8,a9,a10,a11,a12,a14,temp,R,local_mid_temp)
For this coded formula containing the coefficients under the parenthesis, we have a condition for using these coefficients (a1-a14) as for low-temperature range, we will use the second 7 coefficients, or for high-temperature range, we use the first 7 coefficients as you can see in the above comment. So to code that we use the 'if' & 'else' commands for low or high temperatures to use the appropriate coefficients as follows:
% Providing condition for the coefficients acc. to low or high temp
if temp<=local_mid_temp
    S=((a8*log(temp))+(a9*temp)+(a10*temp.^2/2)+(a11*temp.^3/3)+(a12*temp.^4/4)+(a14))*R;
else
    S=((a1*log(temp))+(a2*temp)+(a3*temp.^2/2)+(a4*temp.^3/3)+(a5*temp.^4/4)+(a7))*R;
end
We have stored the local temperature ranges for each species from the NASA thermodynamic data. That temperature ranges from low to mid & mid to high so to code the low & high temperatures under the 'if' & 'else' command we use the local_mid_temp with the inequality as you can see in the above 'if' 'else' command section. So if the temperature is low then it will be less than local_mid_temp or vice versa.
iii. Specific heat:
% function for specific heat

% cp = (a1+a2T+a3T^2+a4T^3+a5T^4)*R
%first 7 coeffs. are high temp. coeff & second 7 coeffs. are low temp coeff

function Cp=specific_heat(a1,a2,a3,a4,a5,a8,a9,a10,a11,a12,temp,R,local_mid_temp)

% Providing condition for the coefficients acc. to low or high temp
if temp<=local_mid_temp
    Cp=(a8+(a9*temp)+(a10*(temp).^2)+(a11*(temp).^3)+(a12*(temp).^4))*R;
else
    Cp=(a1+a2*temp+a3*(temp).^2+a4*(temp).^3+a5*(temp).^4)*R;
end
end
The above is the function of the specific heat. The formula to calculate the specific heat is given according to the low or high-temperature range so on that basis we have to make a function for the specific heat. So the formula is written in the code form in the function as
% function for specific heat

% cp = (a1+a2T+a3T^2+a4T^3+a5T^4)*R
%first 7 coeffs. are high temp. coeff & second 7 coeffs. are low temp coeff

function Cp=specific_heat(a1,a2,a3,a4,a5,a8,a9,a10,a11,a12,temp,R,local_mid_temp)
For this coded formula containing the coefficients under the parenthesis, we have a condition for using these coefficients (a1-a14). For the low-temperature range, we will use the second 7 coefficients, or for the high-temperature range, we will use the first 7 coefficients as you can see in the above comment. So to code that we use the 'if' & 'else' commands for low or high temperatures to use the appropriate coefficients as follows:
% Providing condition for the coefficients acc. to low or high temp
if temp<=local_mid_temp
    Cp=(a8+(a9*temp)+(a10*(temp).^2)+(a11*(temp).^3)+(a12*(temp).^4))*R;
else
    Cp=(a1+a2*temp+a3*(temp).^2+a4*(temp).^3+a5*(temp).^4)*R;
end - As per the 2nd Objective, We have to Calculate the molecular weight of each species and display it in the command window.
And to calculate the molecular weight of each species, we can use the given formula directly in the 'for loop' of our main program without using it as a function calling but a single error in this formula disturbs the whole main program which causes to evaluate for the error in each & every code line of the main program which is bit irritating or complexing that's why I code this molecular weight formula in a function form with the given temperature conditions & then call this function in our main program. So, the molecular weight function is as follows:
function [mol]=molecular_weight(species)

% Defining the array of atoms that are common in each & every species of
% THERMO.dat file
atom=['O','H','C','N','A'];

% Defining the array of the atomic wt. of the corresponding atoms which are
% common in 'THERMO.dat' file
atom_weights=[15.999,1.00784,12.011,14.0067,39.948];

% Initiating the mol. wt. from zero
mol = 0;

% Running a 'for loop' for comparing the 'species' & 'atom' to calculate the
% molecular wt. of the species which are in the 'THERMO.dat' file
for i=1:length(species)
    for j=1:length(atom_weights)
        if strcmpi(species(i),atom(j))  % for comparison b/w 'species' & 'atom' 'strcmp' command is used
            mol = mol + atom_weights(j); % mol.wt. is calculated if the comparison is successful
            pos = j;  % 'j' is assigned to the variable 'pos' so that we can run the 'j' outside of the 'for loop' also

        end
    end
    n = str2double(species(i)); % If the species has a no. which is in string form for e.g., 'O2' so make it into a numeric form

    if n>1

        mol = mol + atom_weights(pos)*(n-1); % If the above 'if' condition is satisfied then mol. wt. is calculated
    end

end
end
Now, I am explaining to you the logic behind using each & every code in the above molecular weight function as follows:
This function is a 'molecular_weight' function as we want to find the molecular weight of the species that are used in the THERMO.dat file. So, first, we write a code as:
function [mol]=molecular_weight(species)We want to make it a function so use the 'function' command before the code. Then the function 'molecular_weight' gives us the molecular weight of the species as an output so we write its output '[mol]' as an output array.
Now, we want to find the molecular weight of each species that are in the THERMO.dat file and that species are in many no.s as about to 53. So we need to find the molecular weight of each species but there is no standard formula to calculate the molecular weight of any species, there is one thing in the THERMO.dat file that we can notice and that thing is that from the first to the last species there are some elements which are common in each & every species so we have to make an array of those common elements with their corresponding atomic weight array as
% Defining the array of atoms which are common in each & every species of
% THERMO.dat file
atom=['O','H','C','N','A'];

% Defining the array of the atomic wt. of the corresponding atoms which are
% common in 'THERMO.dat' file
atom_weights=[15.999,1.00784,12.011,14.0067,39.948];
and compare that array to the species array, actually in our main code it is the element array so also during the calling of this function in our main program we call this function input as 'element' not the 'species' as '[mol]=molecular_weight(elements)' as in the function call, no matter what is the name of input or output variable but the no. of inputs & no. of outputs must be same during function calling & defining, that matters. And to compare this we use the 'strcmp' command. But this thing doesn't go in that simple manner as I am explaining so I am explaining to you with the use of each & every code that I have used in my function.
As we have to compare the 'atom' array to the 'species' array using the 'strcmp' command but to compare each & every element of the array, we need to use the concept of 'for loop' for these arrays.
As we are doing all these to find the molecular weight of the species but before calculating the molecular weight, we have to initialize this molecular weight from 'zero' so for that I define the molecular weight for initialization as
% Initiating the mol. wt. from zero
mol = 0;
and then the concept of 'for loop' comes for the comparison purpose as
% Running a 'for loop' for comparing the 'species' & 'atom' to calculate the
% molecular wt. of the species which are in the 'THERMO.dat' file
for i=1:length(species)
    for j=1:length(atom_weights)
        if strcmpi(species(i),atom(j))  % for comparison b/w 'species' & 'atom' 'strcmp' command is used
            mol = mol + atom_weights(j); % mol.wt. is calculated if the comparison is successful
            pos = j;  % 'j' is assigned to the variable 'pos' so that we can run the 'j' outside of the 'for loop' also

        end
    end
    n = str2double(species(i)); % If the species has a no. which is in string form for e.g., 'O2' so make it into a numeric form

    if n>1

        mol = mol + atom_weights(pos)*(n-1); % If the above 'if' condition is satisfied then mol. wt. is calculated
    end

end
Now, I am explaining to you the logic behind each & every code used in this 'for loop' section.
(i).
for i=1:length(species)
The 'for loop' with the loop operator 'i' is used as we want to run this 'for loop' for finding the molecular weight of the species so it will need to run that much time as the no. of species in the THERMO.dat file. That's why it is coded as 'for i=1:length(species)', 'length(species)' means the total no. of species. So it will run over the total no. of species.
Under this 'for loop', we will run another 'for loop' for calculating the molecular weight using the 'atom_weights' array so this for loop is for the 'atom_weights' array so that we can use it in the upcoming formula to calculate the molecular weight of the species. So in code format:
(ii).
for j=1:length(atom_weights)Now, after that, the main task comes for which this 'for loop' executes and that is the comparison of the 'species' array to the common elements which are common in all the species and that array is the 'atom' array.
Here, we use the condition with the comparison and that condition is that, if the comparison is successful then the molecular weight is calculated by our own designed formula & if not then this will be terminated as follows:
(iii).
            if strcmpi(species(i),atom(j))  % for comparison b/w 'species' & 'atom', 'strcmp' command is used
            mol = mol + atom_weights(j);    % mol.wt. is calculated if the comparison is successful
For comparison, we use the 'strcmpi', here in the last letter, I use 'i' to make this comparison insensitive. Under the parenthesis, the inputs must be 'species(i)' & 'atom(j)' as we want to compare them under the loop operators 'i' & 'j'. If this comparison will be successful then the molecular weight of that species will be calculated. But, if we want to calculate the molecular weight of that species that contains di, tri, or more-atoms which are in string form then first, we have to convert them into the numbers form so for that we have to go for the further steps to calculate the molecular weight of that species and we have to do this by using the same loop operator ('j') as you can see in the above code but this loop operator can be used outside its 'for loop' so for that, first we have to assign this loop operator to any variable so that we can use this loop operator outside its 'for loop' as follows:
(iv).
pos = j; % 'j' is assigned to the variable 'pos' so that we can run the 'j' outside of the 'for loop' also
(v).
 end
    end
As you can see above, the first 'end' is to complete the 'if' statement and the second 'end' is to complete our 'for loop'.
As I told you earlier that we have to convert the string numbers into the numeric form and that will be performed in our main 'for loop' so now I am explaining to you that part of this main 'for loop' is as follows:
(vi).
n = str2double(species(i));  % If the species has a no. which is in string form for e.g., 'O2' so make '2' into a numeric form

    if n>1

       mol = mol + atom_weights(pos)*(n-1);  % If the above 'if' condition is satisfied then mol. wt. is calculated
    end
To convert the string-formed number into the numeric form, the 'str2double' command is used. We can also use other commands like 'str2num' to perform this but this command sometimes reduces our code performance.
Now, let's come to the explanation of the coding logic part. We convert it into the numeric form but there is one condition after that & that is if the number is greater than one so to perform this condition, I use the concept of the 'if' statement as you can see above. So when this condition is satisfied then we can go further to calculate the molecular weight of that species by our own designed formula. In this formula, I am using the loop operator outside its 'for loop' by assigning it to the variable named 'pos' as you can see in the above formula.
In the above formula, '(n-1)' is multiplied but not 'n', it is because we are already adding the previously calculated molecular weight 'mol' to this 'atom_weights' in this formula. So, finally when in this formula, it is calculated then this if statement must be completed using the command
endAfter all that, our main 'for loop' as well as this function 'molecular_weight' must be completed respectively so for that as follows:
(vii).
end
end
I have explained the coding logic of the function 'molecular_weight'. Now, the molecular weight of each species in the 'THERMO.dat' file is calculated so I am showing the screenshot of the command window in which the molecular weight of each species is displayed as follows:
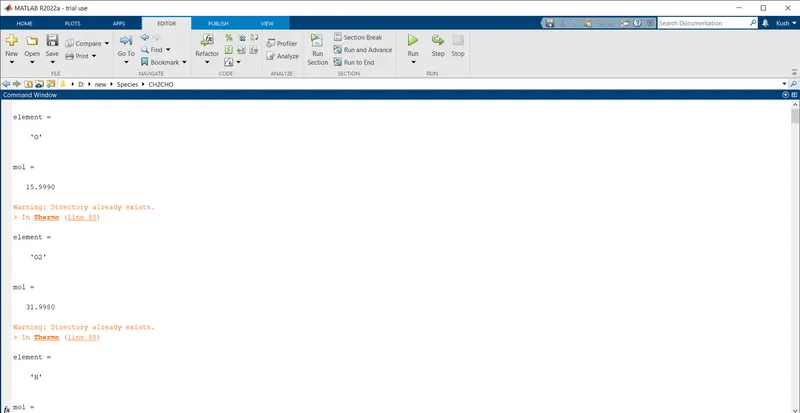
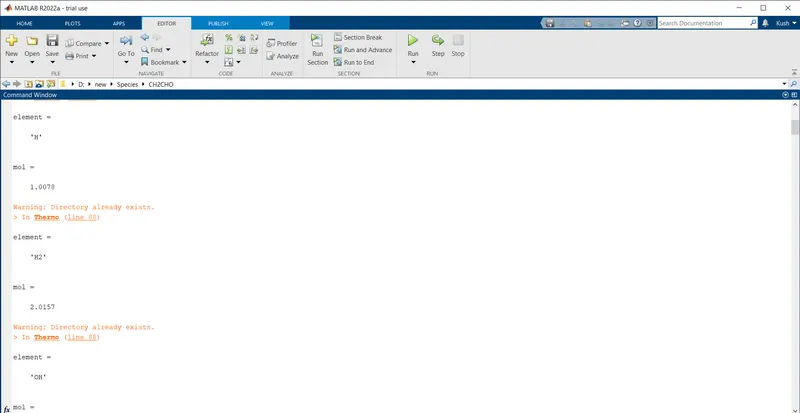
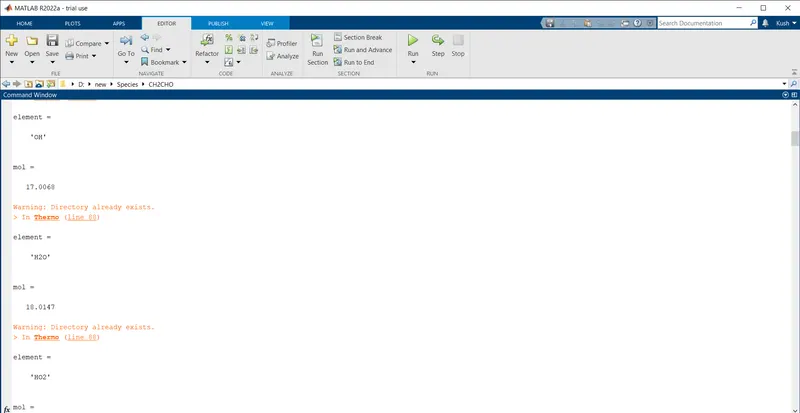
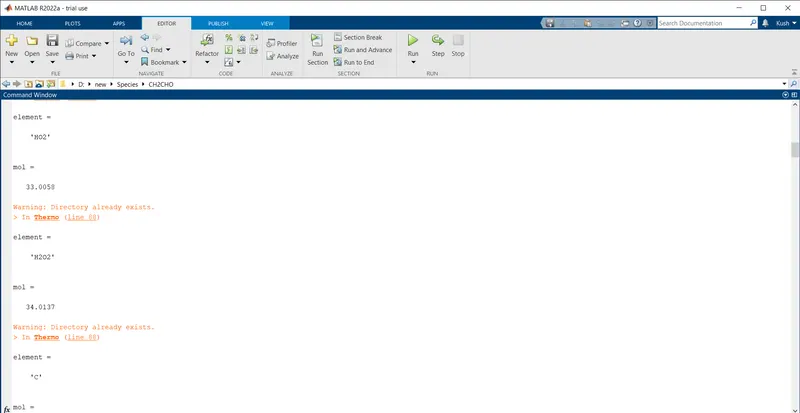
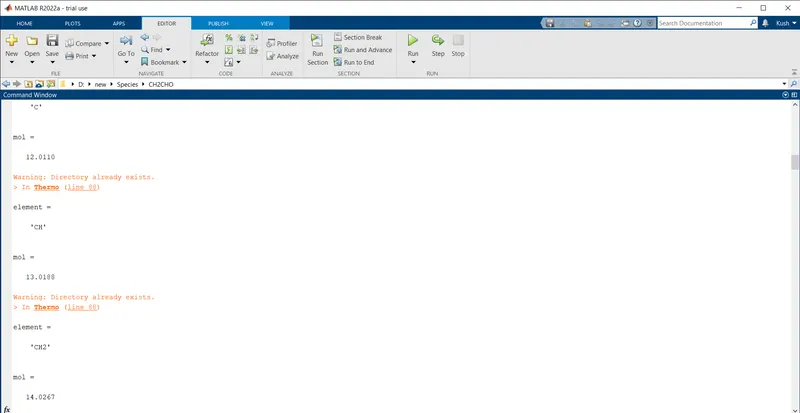
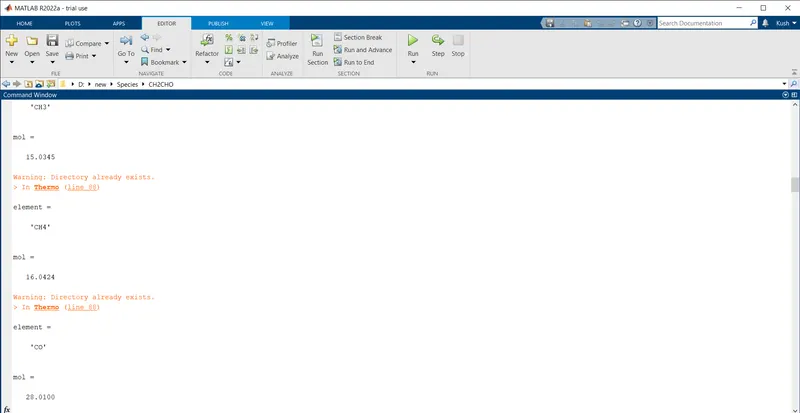
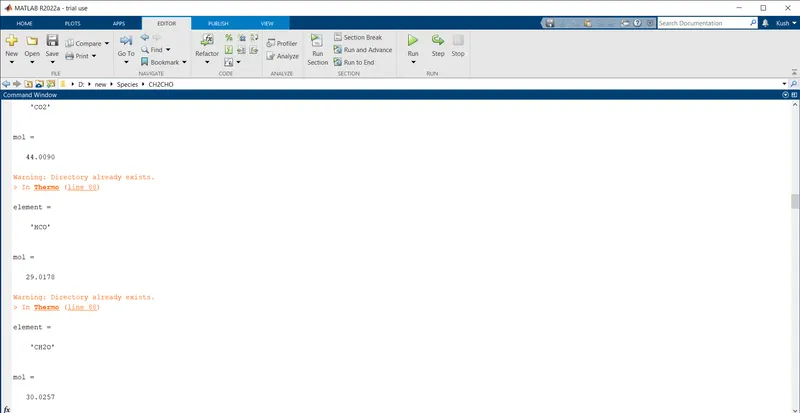
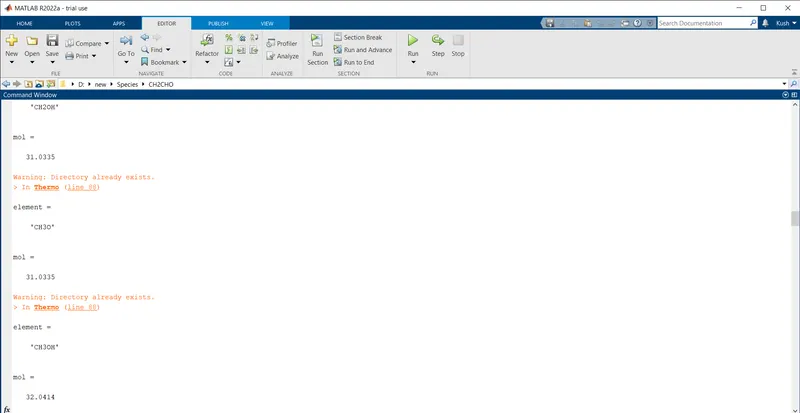
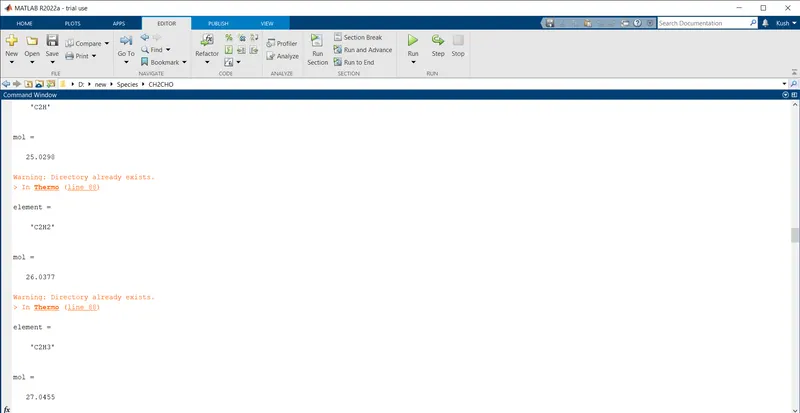
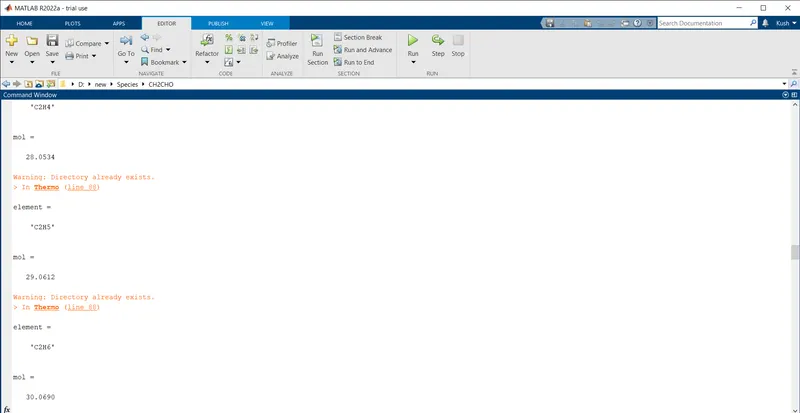
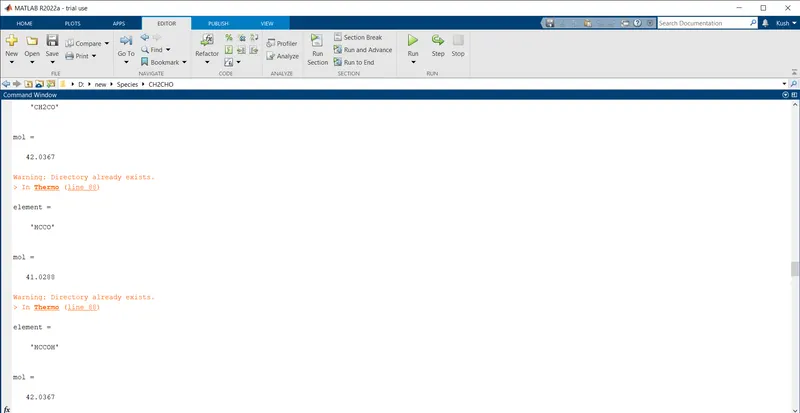
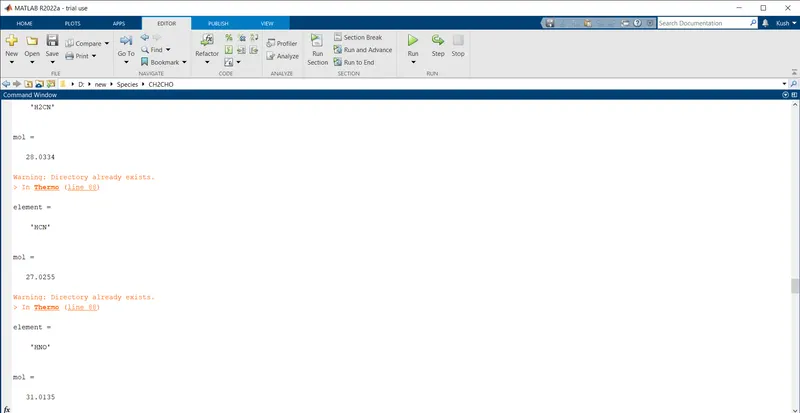
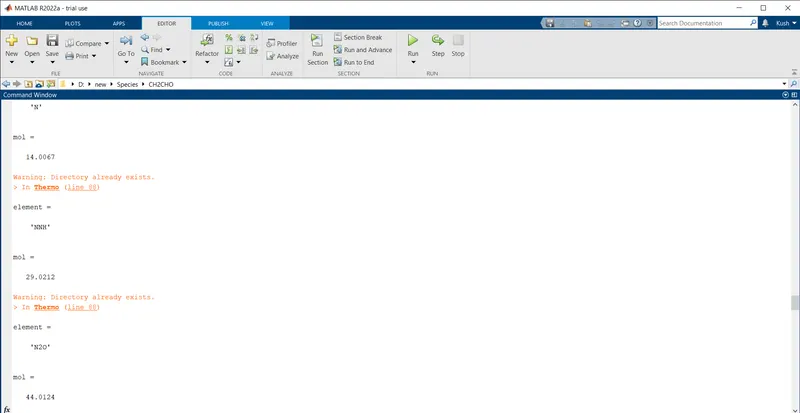
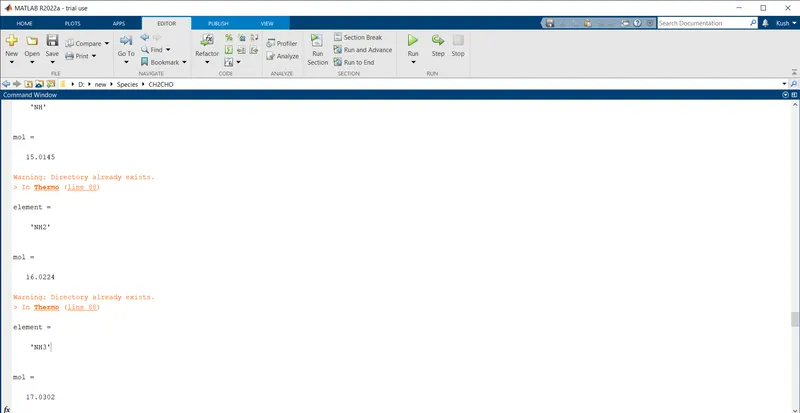
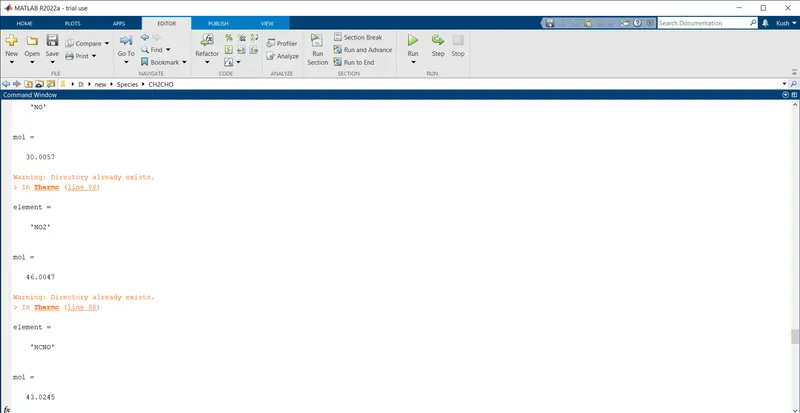
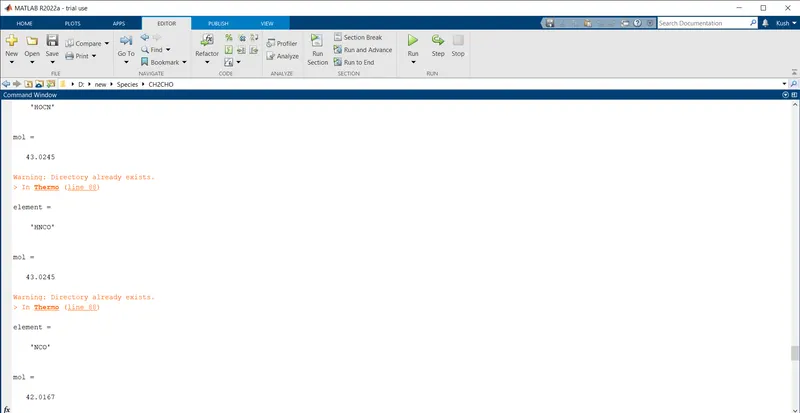
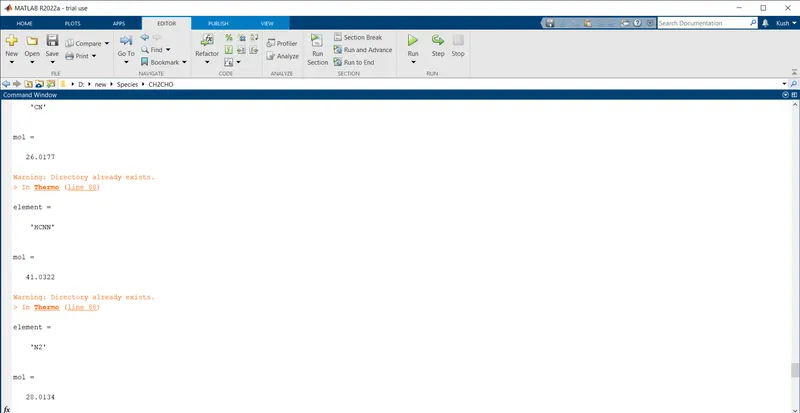
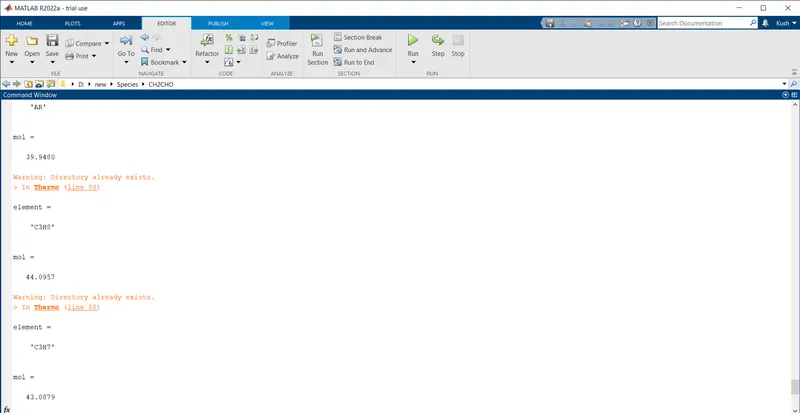
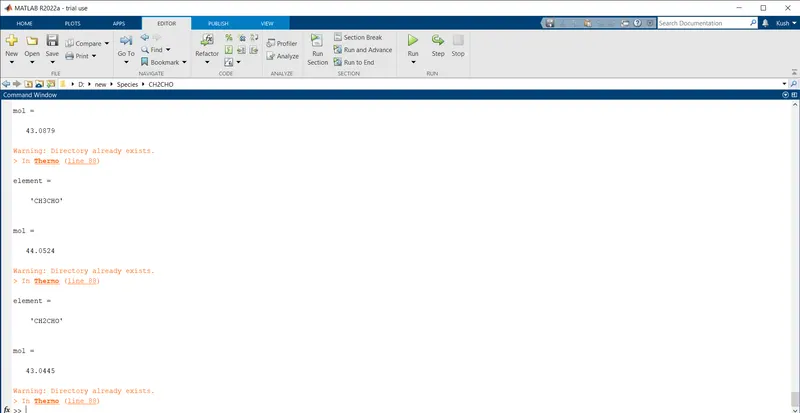
As I have explained the coding logic of all the functions that we will call in our main program so now it's time to explain the coding logic of the main program 'PARSING NASA THERMODYNAMIC DATA'.
The main program 'PARSING NASA THERMODYNAMIC DATA' is as follows:
% PARSING NASA THERMODYNAMIC DATA

clear all
close all
clc

% Reading 'r' the 'THERMO.dat' file by opening the file using 'fopen' command
f1=fopen('THERMO.dat','r');
fgetl(f1); % Store the first line of this file in our MATLAB program using the first 'fgetl' command
tline=fgetl(f1);
A=strsplit(tline,' '); % Split the string line using 'strsplit' command
global_low_temp=str2num(A{2});
global_mid_temp=str2num(A{3});
global_high_temp=str2num(A{4});


R=8.314; % Universal gas constant

fgetl(f1);
fgetl(f1);
fgetl(f1);


% Running a 'for loop' to store all the species & its cofficients that are in data file
for i = 1:53
s=fgetl(f1);
m=strsplit(s,' ');
element = m{1}

% Indexing the local temperature ranges for their corresponding species
local_high_temp= str2num(m{end-1});
local_mid_temp=str2num(m{end-2});
local_low_temp=str2num(m{end-3});

% Local temperature range which is unique for each species
temp=linspace(local_low_temp,local_high_temp,500);

tline=fgetl(f1);
a=strfind(tline,'E'); % Finding a desired/common letter in the string using 'strfind' command for the indexing of the coefficients

a1=tline(1:a(1)+3); % Indexing the coefficients
a1=str2num(a1); % Convert the indexed cofficient which is in string form into a numeric form using 'str2num' command

a2=tline(a(1)+4:a(2)+3);
a2=str2num(a2);

a3=tline(a(2)+5:a(3)+3);
a3=str2num(a3);

a4=tline(a(3)+4:a(4)+3);
a4=str2num(a4);

a5=tline(a(4)+5:a(5)+3);
a5=str2num(a5);

tline2=fgetl(f1);
b=strfind(tline2,'E');

a6=tline2(1:b(1)+3);
a6=str2num(a6);

a7=tline2(b(1)+5:b(2)+3);
a7=str2num(a7);

a8=tline2(b(2)+5:b(3)+3);
a8=str2num(a8);

a9=tline2(b(3)+4:b(4)+3);
a9=str2num(a9);

a10=tline2(b(4)+5:b(5)+3);
a10=str2num(a10);

tline3=fgetl(f1);
c=strfind(tline3,'E');

a11=tline3(1:c(1)+3);
a11=str2num(a11);

a12=tline3(c(1)+4:c(2)+3);
a12=str2num(a12);

a13=tline3(c(2)+4:c(3)+3);
a13=str2num(a13);

a14=tline3(c(3)+4:c(4)+3);
a14=str2num(a14);


mol=molecular_weight(element) % Calling the 'molecular_wt.' function to calculate the molecular wt. of the species

% Calling the functions which are the thermodynamic properties, so as to calculate
Cp=specific_heat(a1,a2,a3,a4,a5,a8,a9,a10,a11,a12,temp,R,local_mid_temp); % Specific_heat function
H=enthalpy(a1,a2,a3,a4,a5,a6,a8,a9,a10,a11,a12,a13,temp,R,local_mid_temp);% Enthalpy function
S=entropy(a1,a2,a3,a4,a5,a7,a8,a9,a10,a11,a12,a14,temp,R,local_mid_temp); % Entropy function

% Making the directory(folder) using 'mkdir' command in our current directory(drive)
mkdir(['D:\new\Species\',element])


% plotting of the thermodynamic properties w.r.t. the local temp. range

figure(1) % figure(1) is for the specific heat 'Cp'
plot(temp,Cp,'linewidth',2,'color','r')
xlabel('local temp(t)')
ylabel('specific heat(Cp)')
title('plot for Cp vs t',element)


figure(2) % figure(2) is for the enthalpy 'H'
plot(temp,H,'linewidth',2,'color','g')
xlabel('local temp(t)')
ylabel('enthalpy(H)')
title('plot for H vs t',element)


figure(3) % figure(3) is for the entropy 'S'
plot(temp,S,'linewidth',2,'color','b')
xlabel('local temp(t)')
ylabel('entropy(S)')
title('plot for S vs t',element)

cd(['D:\new\Species\',element]) % Changing the directory from the current directory

% Saving of all the plots in the new directory
saveas(figure(1),'cpvsT','jpg')
saveas(figure(2),'HvsT','jpg')
saveas(figure(3),'SvsT','jpg')

end
Now, explain the coding logic of this above main program 'PARSING NASA THERMODYNAMIC DATA' as:
I initiate every program from the
clear all
close all
clc
Parsing any data involves the reading or writing of the data. Here, we are reading the data which means we are storing the data in our MATLAB.
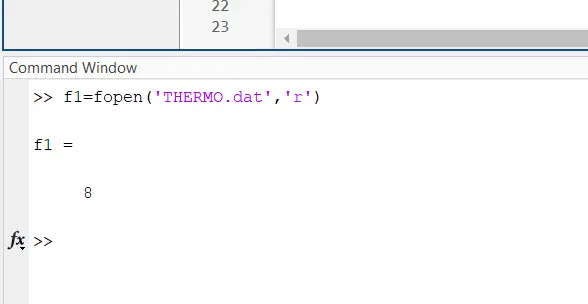
So for writing or reading any data, first we have to open that data file using the command 'fopen()'. Under the parenthesis of this command, we input the data file name with its file extension & permission. Permission means whether you want to read the file or you want to write the file. Here, we are reading the file. And then this command is assigned to any variable, say 'f1', that will be our file handler. So it is used as a code as follows:
(i).
% Reading 'r' the 'THERMO.dat' file by opening the file using 'fopen' command
f1=fopen('THERMO.dat','r');
The output of this above coding is as:
After opening this file with the reading permission 'r'. We need to first store this data line by line so we can read it in our MATLAB software. To store or display this data line by line in our MATLAB, we use the command 'fgetl()'.Under the parenthesis of this command, we insert the file handler, here it is 'f1' as can be seen below:
(ii).
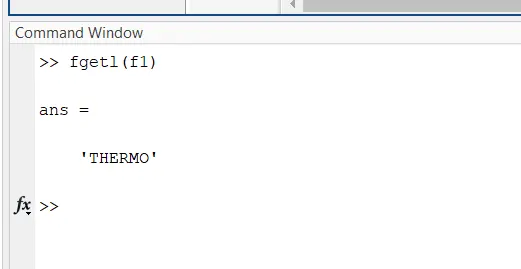
fgetl(f1); % Store the first line of this file in our MATLAB program using the first 'fgetl' commandThe output of this above code is as:
In this manner, we store the data line by line & perform the various operation on this data, line by line. Here, store or display the second line of the data by using the second 'fgetl(f1)' command and assigning it to any variable say 'tline'. It is shown below:
(iii).
tline=fgetl(f1);The output of this above code is as:
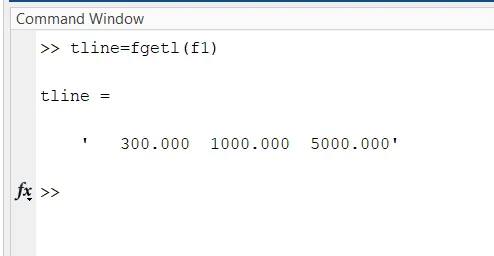
This output is in the string form as it is enclosed in the inverted commas as you can see above. And this data is a global temperature from low to high from the NASA THERMO.dat file. But there is one problem & that is the string form data is undetectable as we want to detach this to get the low, mid as well as high temperatures so to split/detach this string, we are using a command to split it & that is 'strsplit'(). Under the parenthesis of this command, we insert a line name that we want to split with the delimiters like (' ') that we used here. And this command is assigned to a variable say 'A'. So it is shown below:
(iv).
A=strsplit(tline,''); % Split the string line using 'strsplit' commandThe output of this above code is as:
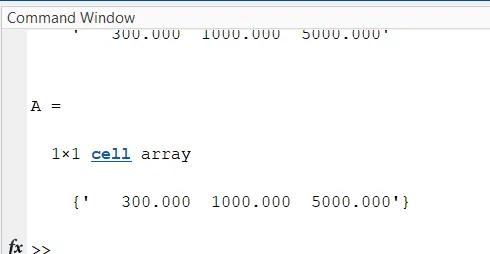
When a string line is split then it becomes a cell array. Cell arrays are those arrays that can contain random entities, they are not categorized as you can see in the above cell array.
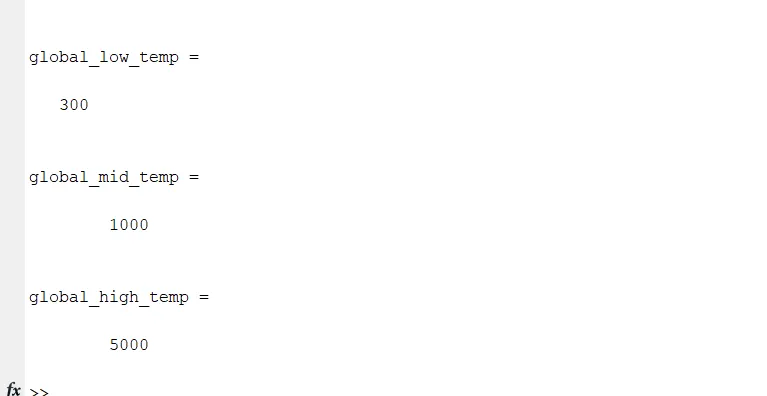
The above according to the NASA THERMO.dat file are global temperatures from low to high and we can extract these temperatures from this cell array 'A' by indexing this cell array 'A'. But after that, the extracted temperatures are in the string form so we convert it into the numeric form using the command 'str2num' & we will do all this in a single coding unlike first extracting the temperatures from the cell array & then converting it into the numeric form. So it is coded as follows:
global_low_temp=str2num(A{2});
global_mid_temp=str2num(A{3});
global_high_temp=str2num(A{4});
The output of this above code is as:
Our main task is to extract all the coefficients of the species and calculate their thermodynamic properties with their molecular weight & plot their thermodynamic properties w.r.t. their specific local temperature ranges, so that task comes here by showing you the coding as:
% Running a 'for loop' to store all the species & its cofficients that are in data file
for i = 1:53
s=fgetl(f1);
m=strsplit(s,' ');
element = m{1}

% Indexing the local temperature ranges for their corresponding species
local_high_temp= str2num(m{end-1});
local_mid_temp=str2num(m{end-2});
local_low_temp=str2num(m{end-3});

% Local temperature range which is unique for each species
temp=linspace(local_low_temp,local_high_temp,500);

tline=fgetl(f1);
a=strfind(tline,'E'); % Finding a desired/common letter in the string using 'strfind' command for the indexing of the coefficients

a1=tline(1:a(1)+3); % Indexing the coefficients
a1=str2num(a1); % Convert the indexed cofficient which is in string form into a numeric form using 'str2num' command

a2=tline(a(1)+4:a(2)+3);
a2=str2num(a2);

a3=tline(a(2)+5:a(3)+3);
a3=str2num(a3);

a4=tline(a(3)+4:a(4)+3);
a4=str2num(a4);

a5=tline(a(4)+5:a(5)+3);
a5=str2num(a5);

tline2=fgetl(f1);
b=strfind(tline2,'E');

a6=tline2(1:b(1)+3);
a6=str2num(a6);

a7=tline2(b(1)+5:b(2)+3);
a7=str2num(a7);

a8=tline2(b(2)+5:b(3)+3);
a8=str2num(a8);

a9=tline2(b(3)+4:b(4)+3);
a9=str2num(a9);

a10=tline2(b(4)+5:b(5)+3);
a10=str2num(a10);

tline3=fgetl(f1);
c=strfind(tline3,'E');

a11=tline3(1:c(1)+3);
a11=str2num(a11);

a12=tline3(c(1)+4:c(2)+3);
a12=str2num(a12);

a13=tline3(c(2)+4:c(3)+3);
a13=str2num(a13);

a14=tline3(c(3)+4:c(4)+3);
a14=str2num(a14);


mol=molecular_weight(element) % Calling the 'molecular_wt.' function to calculate the molecular wt. of the species

% Calling the functions which are the thermodynamic properties, so as to calculate
Cp=specific_heat(a1,a2,a3,a4,a5,a8,a9,a10,a11,a12,temp,R,local_mid_temp); % Specific_heat function
H=enthalpy(a1,a2,a3,a4,a5,a6,a8,a9,a10,a11,a12,a13,temp,R,local_mid_temp);% Enthalpy function
S=entropy(a1,a2,a3,a4,a5,a7,a8,a9,a10,a11,a12,a14,temp,R,local_mid_temp); % Entropy function

% Making the directory(folder) using 'mkdir' command in our current directory(drive)
mkdir(['D:\new\Species\',element])


% plotting of the thermodynamic properties w.r.t. the local temp. range

figure(1) % figure(1) is for the specific heat 'Cp'
plot(temp,Cp,'linewidth',2,'color','r')
xlabel('local temp(t)')
ylabel('specific heat(Cp)')
title('plot for Cp vs t',element)


 figure(2) % figure(2) is for the enthalpy 'H'
 plot(temp,H,'linewidth',2,'color','g')
 xlabel('local temp(t)')
 ylabel('enthalpy(H)')
 title('plot for H vs t',element)


figure(3) % figure(3) is for the entropy 'S'
plot(temp,S,'linewidth',2,'color','b')
xlabel('local temp(t)')
ylabel('entropy(S)')
title('plot for S vs t',element)

cd(['D:\new\Species\',element]) % Changing the directory from the current directory

% Saving of all the plots in the new directory
saveas(figure(1),'cpvsT','jpg')
saveas(figure(2),'HvsT','jpg')
saveas(figure(3),'SvsT','jpg')

end
Extracting all the coefficients of each & every species is a much easier task if you know to extract all the coefficients of a single species. Nothing to do with that, simply extract the coefficient of a single species and then enclosed the coding of the extraction of a single species into the 'for loop' with the no. of loop running times that you want, here I make it from '(i=1:53)' as we have a total of 53 species.
So now, I am explaining to you, how I extract the coefficients of a single species from this THERMO.dat file as:
For extracting the coefficient of the desired species, the first store that line, in our MATLAB program, which contains the species & the coefficients of that species using the 'fgetl' command as shown below:
s=fgetl(f1)Here, I assign this command to the variable 's' as for understanding the purpose that this line is of the species.
The output of this above coding is shown in the command window is as follows:
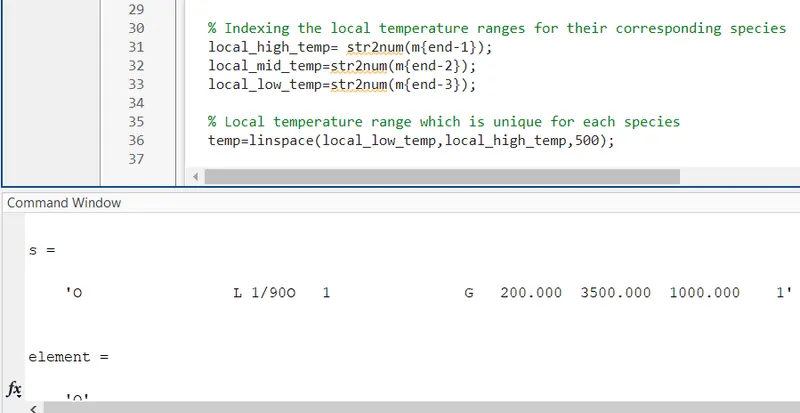
So now as you can see above we have stored the species line in our MATLAB program & this is with the local temperature range of that species.
So firstly we need to split this line to make it into the cell array & then by indexing from the cell array so that we can extract any element of the cell array that we want as per the proper indexing.
To split this above line which is in string form, the 'strsplit' command is used as follows:
m=strsplit(s,' ')Here, we assign this command to the variable 'm'. I explained this command at the beginning of this program. The output of this above coding in the command window is as follows:
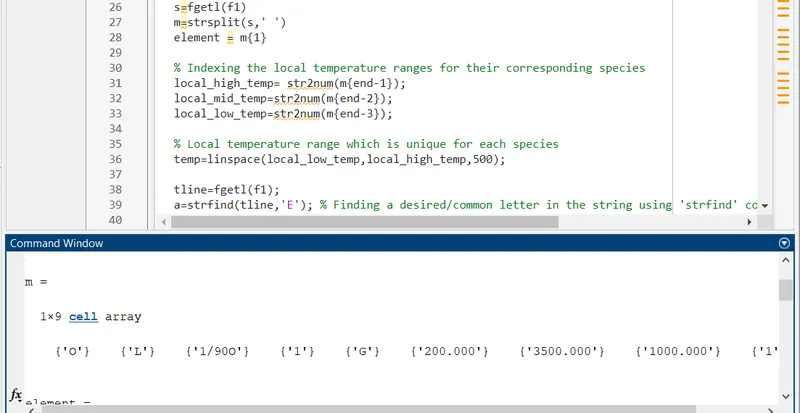
So, on splitting it gets converted into a cell array. Under this cell array, we need to extract the species as well as its local temperatures ranging from low to high so this will be done by indexing as follows:
% Indexing the local temperature ranges for their corresponding species
local_high_temp= str2num(m{end-1});
local_mid_temp=str2num(m{end-2});
local_low_temp=str2num(m{end-3});
On indexing, I got the extracted elements of the cell array which are in the string form so I convert it into the numeric form using the command 'str2num' & I have done all this in a single step as you can see above.
The output of this above coding is as follows:
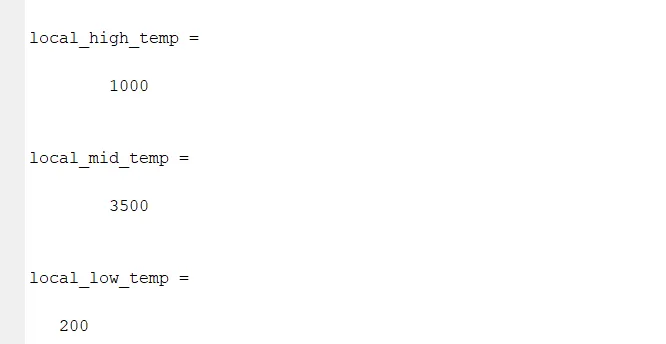
As each species has its own local temperature range so making an array of this local temperature range under 'for loop', it runs for all the species as follows:
% Local temperature range which is unique for each species
temp=linspace(local_low_temp,local_high_temp,500);
Here, I want 500 values in this array so I make it 500 by specifying at the end in the parenthesis.
So, we store the species line in our MATLAB program and extract the species as well as its local temperature range. Now, its time to store the coefficient line to extract the coefficients from that line which are in string form so the further coding to store the coefficient line in our MATLAB program is as follows:
tline=fgetl(f1)Here, I assign this to the variable 'tline'.
The output of this above coding is as:
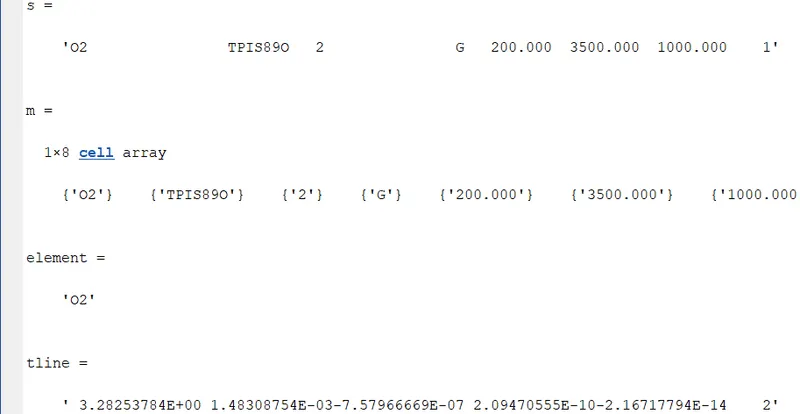
As you can see the above output is 'tline' which has 5 coefficients and we extract these 5 coefficients one by one and convert them into the numeric form as this line is in the string form.
We want each coefficient separately but there is one problem with that and that problem is when we split this string using the 'strsplit' command, it gets split but we can't get each coefficient in a separate manner, they may be in a mixed form with other coefficients as here the separable gaps are not in between each coefficient.
So, we need to go for another trick or hint for this just like to find something which is common for all the coefficients. As you can notice from the line 'tline' in the command window, the 'E' letter is common for all the coefficients.
We can find the positions of the letter 'E' in the line 'tline' using the command 'strfind()' (the inputs in the parenthesis of this command are the line in which we want to find the position of that letter and that letter also) & then make an array of the positions of this letter 'E'. With the help of this position array, we can index the 'tline' & extract the coefficients separately which will be in the string form so after that, we will convert it into the numeric form using the command 'str2num'.
Now, I show you the coding for the extraction of the coefficients from the 'tline' with the whole procedure that I explain to you above as:
a=strfind(tline,'E') % Finding a desired/common letter in the string using 'strfind' command for the indexing of the coefficients
I assign the output of this command to a variable 'a'. The output of this above coding is as:
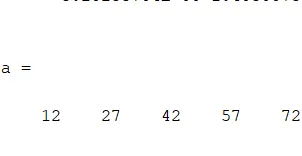
The above output is position array 'a' for the letter 'E' in the 'tline'.
Now, we are using the positions of the letter 'E' in the 'tline' during the indexing of the 'tline' for extracting the coefficients from them.
So the coding for the indexing of this above as:
a1=tline(1:a(1)+3); % Indexing the coefficients In the above coding as you can see 'a(1)' is the position of the letter 'E' in the array 'a'.
So, with this, we extract the first coefficient of this species, & that coefficient is in the string form so we convert it into the numeric form using the command 'str2num' as follows:
a1=str2num(a1); % Convert the indexed cofficient which is in string form into a numeric form using 'str2num' command
So now we got our first coefficient as 'a1' of a species & we have a total of 14 coefficients for each species so the remaining 13 ('a2-a14') can be extracted in a similar way.
After extracting all the coefficients, these coefficients are used during the calling of the functions that we had defined so now it's time to show you the codings for the calling the functions in this our main MATLAB program as:
mol=molecular_weight(element) % Calling the 'molecular_wt.' function to calculate the molecular wt. of the species

% Calling the functions which are the thermodynamic properties, so as to calculate
Cp=specific_heat(a1,a2,a3,a4,a5,a8,a9,a10,a11,a12,temp,R,local_mid_temp); % Specific_heat function
H=enthalpy(a1,a2,a3,a4,a5,a6,a8,a9,a10,a11,a12,a13,temp,R,local_mid_temp);% Enthalpy function
S=entropy(a1,a2,a3,a4,a5,a7,a8,a9,a10,a11,a12,a14,temp,R,local_mid_temp); % Entropy function- Now, the next objective is to Plot the Cp, Enthalpy, and Entropy for the local temperature range (low temperature: high temperature) specific for each species.
So now, I show you the codings of the plotting section:
% plotting of the thermodynamic properties w.r.t. the local temp. range

figure(1) % figure(1) is for the specific heat 'Cp'
plot(temp,Cp,'linewidth',2,'color','r');
xlabel('local temp(t)')
ylabel('specific heat(Cp)')
title('plot for Cp vs t',element)


 figure(2) % figure(2) is for the enthalpy 'H'
 plot(temp,H,'linewidth',2,'color','g');
 xlabel('local temp(t)')
 ylabel('enthalpy(H)')
 title('plot for H vs t',element)


figure(3) % figure(3) is for the entropy 'S'
plot(temp,S,'linewidth',2,'color','b');
xlabel('local temp(t)')
ylabel('entropy(S)')
title('plot for S vs t',element)
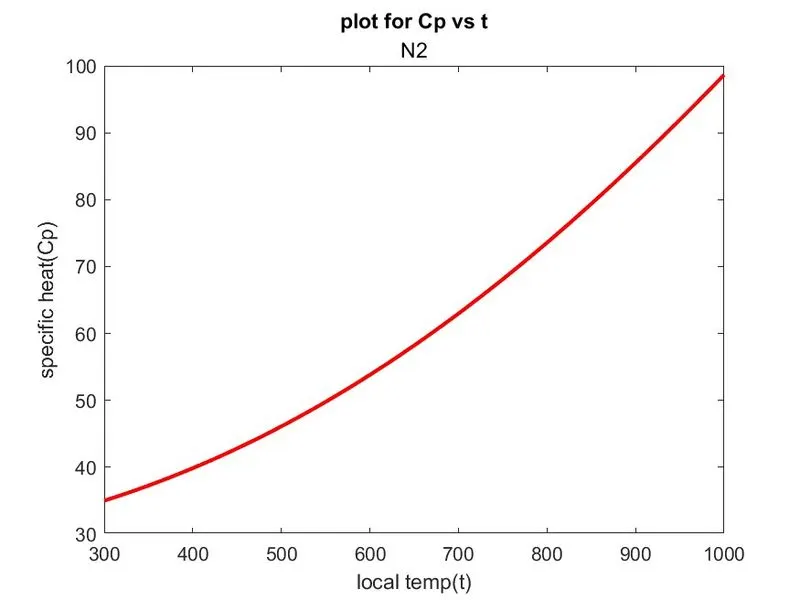
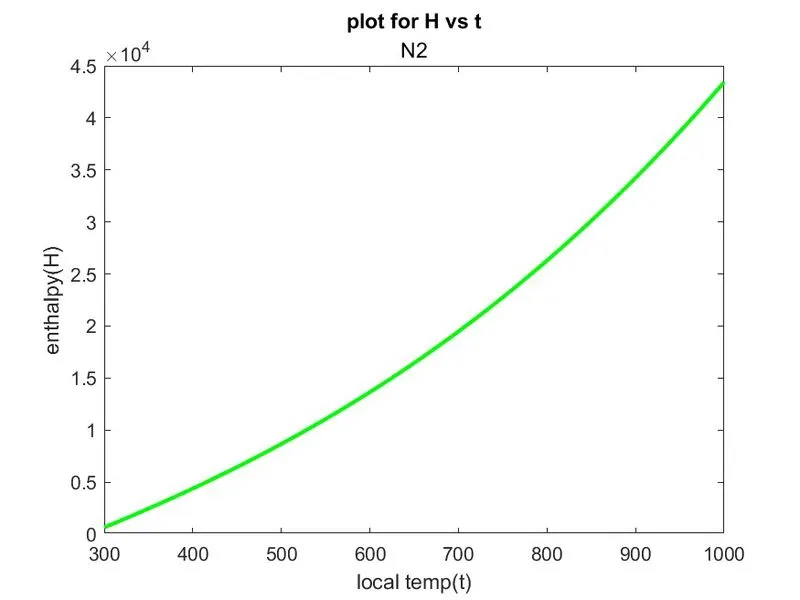
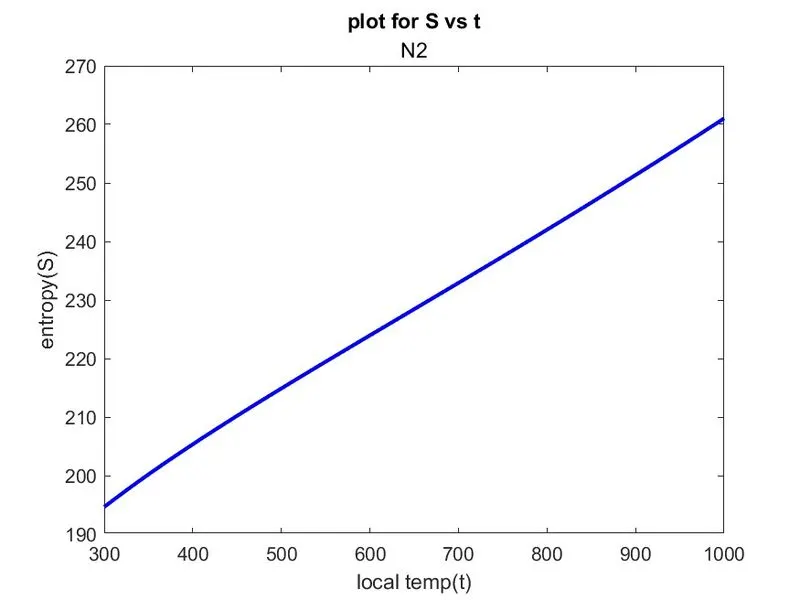
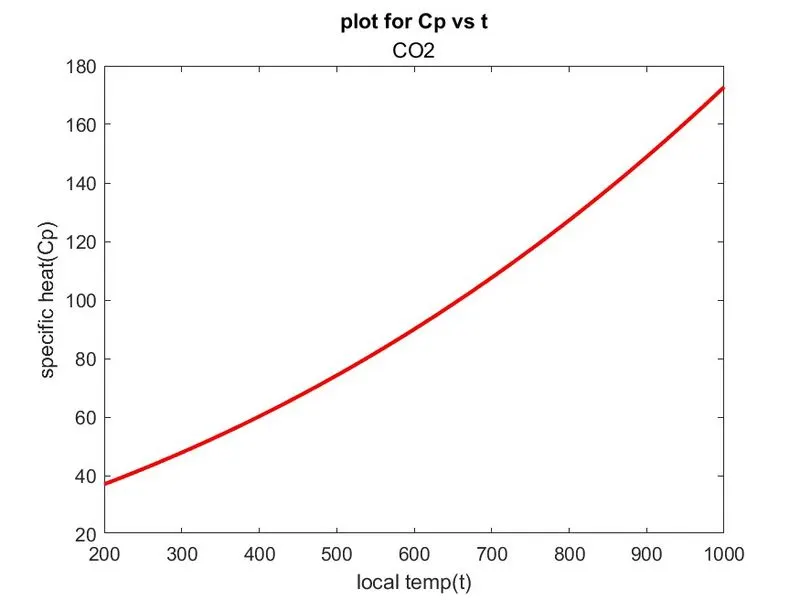
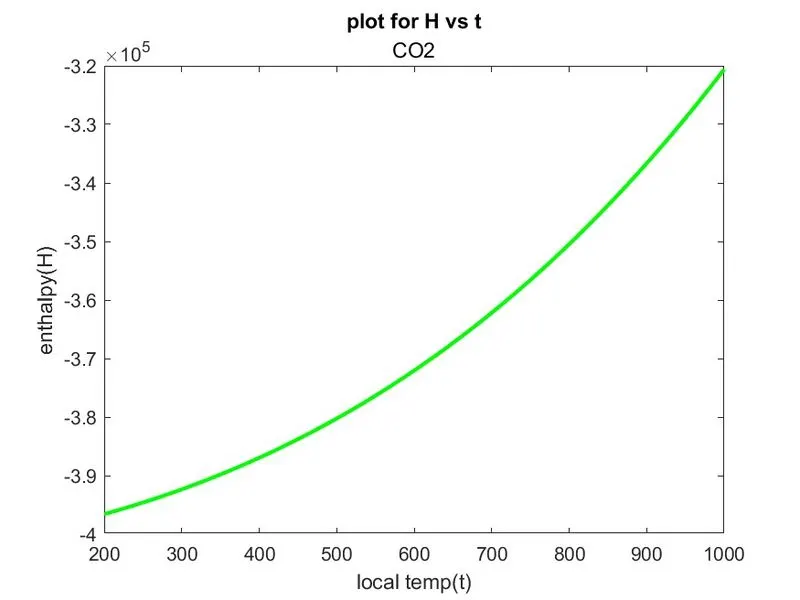
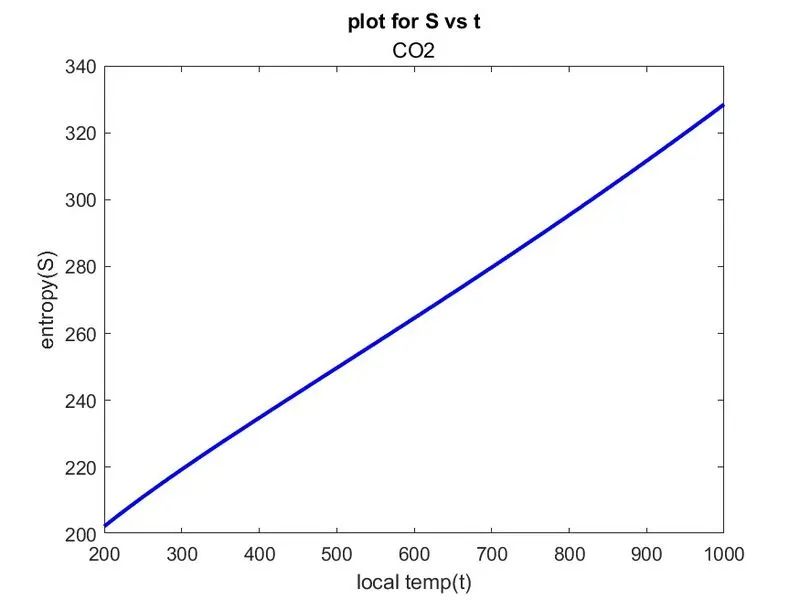
The above plotting in different figure windows is for the thermodynamic properties (Cp, H, S) w.r.t. the local temperature ranges.
I think there is nothing new to explain in the plotting section.
For 2-D plotting, I use the 'plot' command with inputs of the plot under the parenthesis of the 'plot' command such as the plotting variable, and line specifications with its color.
As you can see above under the parenthesis of the 'title' command, I insert 'element' which will be run under the 'for loop' so each time we got a plot with the different element/species name for which the plot is displaying.
Here, we are not using the 'hold on' command as we are plotting in the different figure windows.
As an attachment of the plots in image format, the Plots for o2, N2, and Co2 species are desired by this project so I am attaching the screenshots of these required plots as follows:
- Now, our next objective is to save the plots as images with appropriate names and dump them in separate folders for each species with a suitable name
To save these plots in a separate folder, first, we have to make that folder in a coding manner and then we can save it in that folder.
The coding for making that folder is as follows:
% Making the directory(folder) using 'mkdir' command in our current directory(drive)
mkdir(['D:\new\Species\',element])
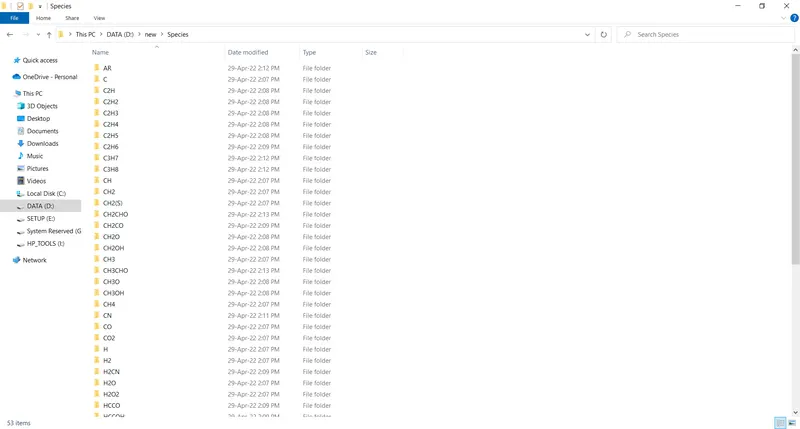
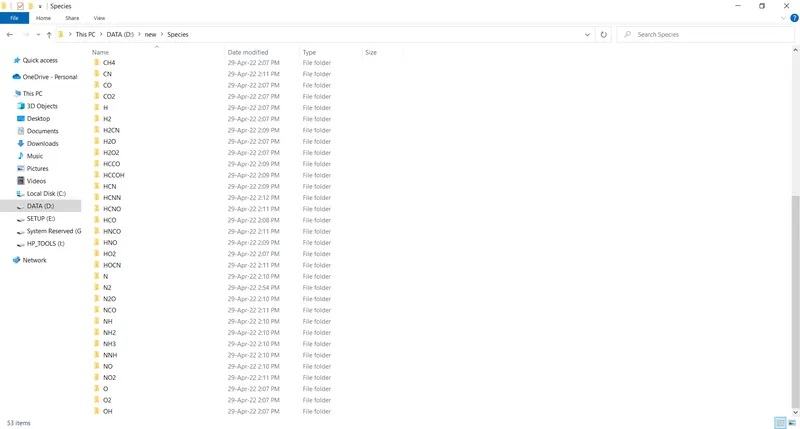
Here, as you can see above, I make a directory using the command 'mkdir'. This command is used when we want to make a directory. In this directory, we are going to save our different figure windows of the plots as images(.jpg) using the command 'saveas()'. Here, as you can see above, under the parenthesis of the command 'mkdir()', I insert the input 'element' at last & that input 'element' which is our species that runs under the 'for loop' & keeps on changing at each run so with that we get the plots as per the species wise as inserting the input 'element'.
The output of this above coding is as:
But before saving all this we need to change our current directory or folder using the command 'cd()' as follows:
cd(['D:\new\Species\',element]) % Changing the directory from the current directoryHere, I want to change the current directory of my MATLAB program using the command 'cd()' So I change my directory and get into my desired directory which is under the parenthesis of this above command 'cd()'.
Now, we are in our desired directory so we save the figure windows of our plots as follows:
% Saving of all the plots in the new directory
saveas(figure(1),'cpvsT','jpg')
saveas(figure(2),'HvsT','jpg')
saveas(figure(3),'SvsT','jpg')
We are using the 'saveas()' command as we want to save the figure windows of our plot.Under the 'saveas()' command, we save the figure windows as 'figure()' & file name with its format type such as 'jpg', 'fig' etc.
After coding all this for a single species, enclosed this whole coding under the 'for loop' so it will be run for all the total no. of the species as we have '53' so it must be just started before the coding of extracting coefficients as
for i=1:53we have 53 species so it will extract the coefficients of all the 53 species.
And when all this is performed by coding we complete this 'for loop' using the command
endI completed all the objectives of this project-Parsing NASA thermodynamic data as you can see above & also verify that.
And also I completed or obeyed all the requirements that are needed for the grading policy:
- My Codes are attached with comments and must be well optimized.
- Outputs for user-specified inputs are obtained & my Plots have proper labels and titles.
- Explanation of my coding logic and logic behind the choosing aspects to parse out of the file
So with all these completions, I am going to submit this project-PARSING NASA THERMODYNAMIC DATA.