Week 12 - Validation studies of Symmetry BC vs Wedge BC in OpenFOAM vs Analytical H.P equation
Objective :
a)To simulate the flow through a pipe of circular cross section (reduced to a wedge for ease of computation)by applying symmetry boundary condition and varying wedge angle to
case1 :10 degrees.
case 2:25 degrees.
case 3: 45 degrees .
b)
- Validate Hydro-dynamic length with the numerical result
- Validate the fully developed flow velocity profile with its analytical profile
- Validate maximum velocity and pressured drop for fully developed flow
- Post-process Shear stress and validate wall shear stress for fully developed flow
- Highligh the differences in both boundary conditions in terms of their usage and aplication
Theory :
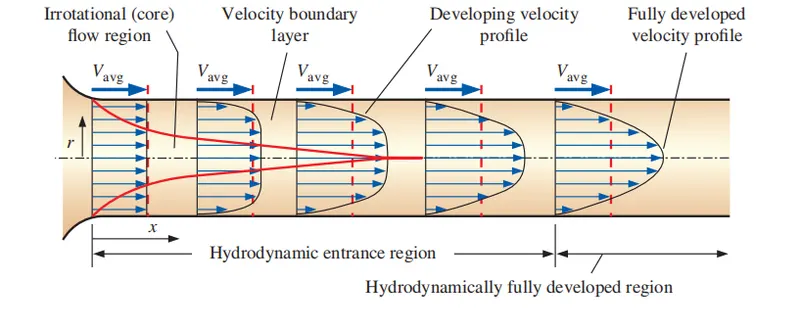
Consider a fluid entering a circular pipe at uniform vellocity . Because of the no-slip condition , fluid particles in contact with the wall of the pipe, come to a complete stop . This layer causes the fluid particles in the adjacent layers to slow down as well due to friction . To make up for this velocity reduction, the velocity of the fluid at the midsection has to increase in order to keep the mass flow rate constant in the pipe . As a result, veocity gradient forms along the pipe .
The region of the flow in which , the effects of the viscous shearing forces caused by fluid viscosity are felt , is called velocity boundary layer or just boundary layer. The hypothetical boundary layer divides the flow into 2 region : the boundary layer region (viscous effects and velocity changes are significant )and the irrotational flow region (frictional effects are insignificant and velocity remains constant in radial direction).
The thickness of the boundary layer increase in the flow direction till the boundary layer reaches the pipe centre and thus fills the entire pipe and the velocity becomes fully develped a little farther downstream . The region from the pipe entrance to the region till which the velocity profile is fully formed is called hydrodynamic entrance region and the length of this region is called hydrodynamic entry length `L_h`. Flow iin the entry region is called hydrodynamically developing flow since this is the region in which the velocity profile is developing . The region beyond which the velocity profile is fully developed is called hydrodynamically fully developed region . The flow is said to be fully developed when the normalized temperature profile remains unchanged. The velocity profile in laminar fully developed flow in parabolic and much flatter in turbulent flow because of the formation of eddys and vigorous mixing of radial direction . The time averaged velocity profile remains unchanged when the flow is fully developed .
`(delu)/(delx)(r,x) = 0 -> u=u(r)`
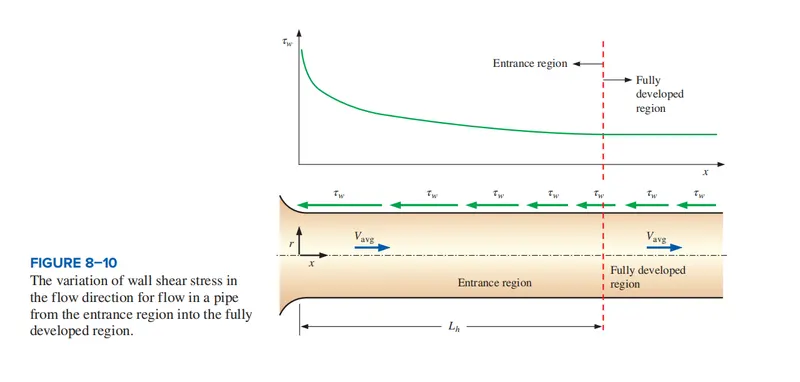
The shear stress at pipe wall `tau_w` is related to the slope of the velocity profile at the surface . Consider the fluid flow in hydrodynamic entrance region of the pipe . The wall shear stress is highest at the inlet region of the pipe where thickness of boundary layer is minimum and decreases gradually to fully developed region. Therefore the pressure drop is always higher in the entrance region of the pipe and the effect of the entrance region always increases the average friction factor for the entire pipe . This increase may be significant for short pipes, but is negligible for long pipes.
Given below is the equation for hydrodynamic length for flow of Re<2300 .
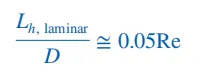
`L_h= .05*Re*D` = .05x2100x.005 = 0.525m
where D is the diameter of the pipe. (assumed value)
Total length of the pipe we consider = L>Lh = 0.1xRexD = 1.05m
Given below is graph for variation of wall shear stress along the hydrodynamic length of a pipe .
Given below are equations for pressure drop and average velocity for an incompressible laminar flow through a pipe .
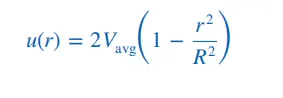
where r/R is the ratio of radius from centre to circumference of the pipe .
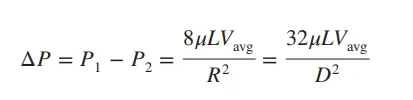
Where
`mu` is the dynamic viscosity
L is the length of the pipe
Vavg = average velocity
D = Diameter of the pipe .
In this case , in order to simplify the calculations , we reduce the pipe into a wedge with wedge angle 3 degrees . This would enable us to reduce the computation time without compromising on the accuracy of the results .
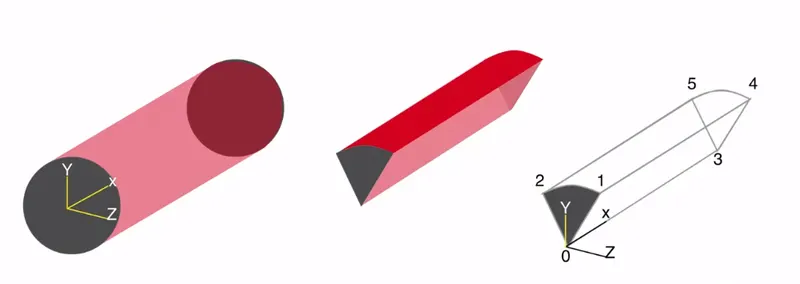
Program code :
Since the code will be same for all 3 cases , I will be showing case set up for only case 1 .
Matlab code :
clear all
close all
clc

D=.005 ;                                               % Diameter
r=D/2 ;                                                % Radius
L= 210*D ;                                             % Length
Re=2100 ;                                              % Reynold's Number
theta=10 ;                                             % Wedge angle
a=sind(theta/2);
b=cosd(theta/2);
y=r*b;
z=r*a;

f1=fopen('blockMeshDict10.txt','w');
fprintf(f1," /*--------------------------------*- C++ -*----------------------------------* \n " );
fprintf(f1,"  =========                 | /n " );
fprintf(f1,"  \\      /  F ield         | OpenFOAM: The Open Source CFD Toolbox \n");
fprintf(f1,"   \\    /   O peration     | Website:  https://openfoam.org \n");
fprintf(f1,"    \\  /    A nd           | Version:  8 \n");
fprintf(f1,"     \\/     M anipulation  |  \n");
fprintf(f1,"*---------------------------------------------------------------------------* \n");
fprintf(f1,"FoamFile \n");
fprintf(f1," { \n");
fprintf(f1,"    version     2.0; \n");
fprintf(f1,"    format      ascii; \n");
fprintf(f1,"    class       dictionary; \n ");
fprintf(f1,"    object      blockMeshDict; \n" );
fprintf(f1,"   } \n");
fprintf(f1,"// * * * * * * * * * * * * * * * * * * * * * * * * * * * * * * * * * * * * * // \n");

fprintf(f1,"convertToMeters 1; \n");

fprintf(f1,"vertices \n");
fprintf(f1,"( \n");
fprintf(f1,"   (0 0 0) \n");                         % Vertex 0
fprintf(f1,"   (0 %d %d ) \n",y,z);                  % Vertex 1
fprintf(f1,"   (0 %d %d) \n",y,-z);                  % Vertex 2
fprintf(f1,"   (%d 0 0) \n",L);                      % Vertex 3
fprintf(f1,"   (%d %d %d) \n",L,y,z);                % Vertex 4
fprintf(f1,"   (%d %d %d))\n",L,y,-z);               % Vertex 5

fprintf(f1,"  ); \n");

fprintf(f1,"blocks \n");
fprintf(f1," ( \n ");
fprintf(f1,"   hex (0 3 5 2 0 3 4 1) (200 50 1) simpleGrading (1 .1 1) \n");
fprintf(f1," ); \n");

fprintf(f1," edges \n ");
fprintf(f1," ( \n ");
fprintf(f1," ); \n ");

fprintf(f1," boundary \n");
fprintf(f1," ( \n " );
fprintf(f1,"   inlet \n ");
fprintf(f1,"   {   \n ");
fprintf(f1,"       type wall; \n");
fprintf(f1,"       faces \n");
fprintf(f1,"       (  \n");
fprintf(f1,"           (0 1 2 0) \n");
fprintf(f1,"       );  \n");
fprintf(f1,"   }  \n");
fprintf(f1,"  Outlet \n ");
fprintf(f1,"   {   \n ");
fprintf(f1,"       type wall; \n");
fprintf(f1,"       faces \n");
fprintf(f1,"       (  \n");
fprintf(f1,"           (3 5 4 3  ) \n");
fprintf(f1,"       );  \n");
fprintf(f1,"   }  \n");

fprintf(f1,"  topWall \n");
fprintf(f1,"    {  \n");
fprintf(f1,"        type wall;  \n");
fprintf(f1,"        faces \n");
fprintf(f1,"        (  \n");
fprintf(f1,"            (1 4 5 2) \n");
fprintf(f1,"        ); \n");
fprintf(f1,"    }  \n");
fprintf  (f1,"  axis \n");
fprintf(f1,"    {  \n");
fprintf(f1,"        type empty;  \n");
fprintf(f1,"        faces \n");
fprintf(f1,"        (  \n");
fprintf(f1,"            (0 3 3 0 ) \n");
fprintf(f1,"        ); \n");
fprintf(f1,"    }  \n");
fprintf(f1,"    front \n");
fprintf(f1,"    { \n");
fprintf(f1 ,"      type wedge;\n");
fprintf(f1,"       faces   \n");
fprintf(f1,"       ( \n");
fprintf(f1,"           (0 3 4 1) \n");
fprintf(f1,"       ); \n");
fprintf(f1,"   } \n");
fprintf(f1,"    back \n");
fprintf(f1,"    { \n");
fprintf(f1 ,"      type wedge;\n");
fprintf(f1,"       faces   \n");
fprintf(f1,"       ( \n");
fprintf(f1,"           (0 2 5 3) \n");
fprintf(f1,"       ); \n");
fprintf(f1,"   } \n");
fprintf(f1,"); \n");

fprintf(f1,"mergePatchPairs \n");
fprintf(f1,"( \n");
fprintf(f1,"); \n");

fprintf(f1,"// ************************************************************************* // ");
Initial and boundary conditions
Pressure :
/*--------------------------------*- C++ -*----------------------------------*\
  =========                 |
  \\      /  F ield         | OpenFOAM: The Open Source CFD Toolbox
   \\    /   O peration     | Website:  https://openfoam.org
    \\  /    A nd           | Version:  8
     \\/     M anipulation  |
\*---------------------------------------------------------------------------*/
FoamFile
{
    version     2.0;
    format      ascii;
    class       volScalarField;
    object      p;
}
// * * * * * * * * * * * * * * * * * * * * * * * * * * * * * * * * * * * * * //

dimensions      [0 2 -2 0 0 0 0];

internalField   uniform 0;

boundaryField
{
     inlet
    {
        type            zeroGradient;
    }

    Outlet
    {
        type            fixedValue;
        value           uniform 0 ;
    }

    topWall
    {
    type                zeroGradient;
    }

    axis
    {
    type                  empty;
    }

    front
    {
        type            symmetry;
    }

    back
    {
        type            symmetry;
    }


}

// ************************************************************************* //
Velocity :
/*--------------------------------*- C++ -*----------------------------------*\
  =========                 |
  \\      /  F ield         | OpenFOAM: The Open Source CFD Toolbox
   \\    /   O peration     | Website:  https://openfoam.org
    \\  /    A nd           | Version:  8
     \\/     M anipulation  |
\*---------------------------------------------------------------------------*/
FoamFile
{
    version     2.0;
    format      ascii;
    class       volVectorField;
    object      U;
}
// * * * * * * * * * * * * * * * * * * * * * * * * * * * * * * * * * * * * * //

dimensions      [0 1 -1 0 0 0 0];

internalField   uniform (0 0 0);

boundaryField
{
     inlet
    {
        type            fixedValue;
        value           uniform (0.42 0 0);
    }

     Outlet
    {
        type               zeroGradient;
    }
     topWall
     {
     type              noSlip;
     value             uniform (0 0 0);
     }

     axis
     {
     type              empty;
     }

    front
    {
        type            symmetry;
    }

    back
    {
    type                symmetry;
    }
}

// ************************************************************************* //
Output :
case1 : `theta = 10` degrees
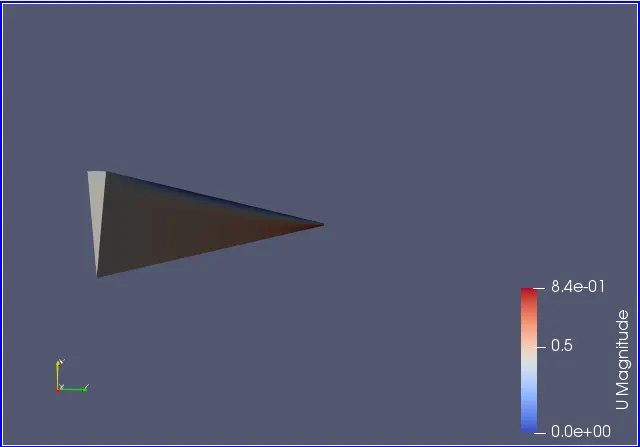
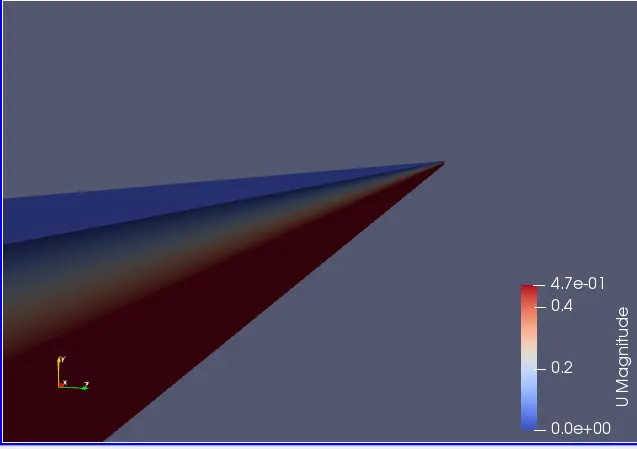
Contour for U- Magnitude
a)side view
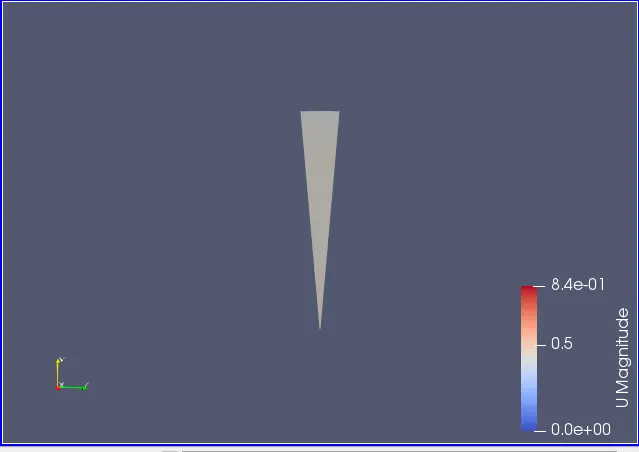
b) Front View
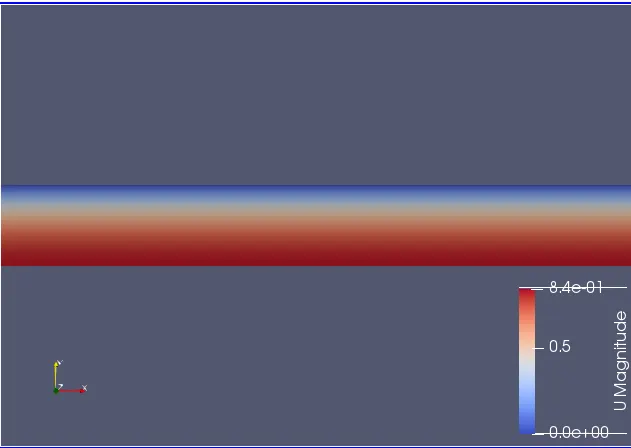
c) Isometric view
Plot 1:
Plot 2:
Plot 3:
Case 2 :`theta = 25 degrees`
a) side view
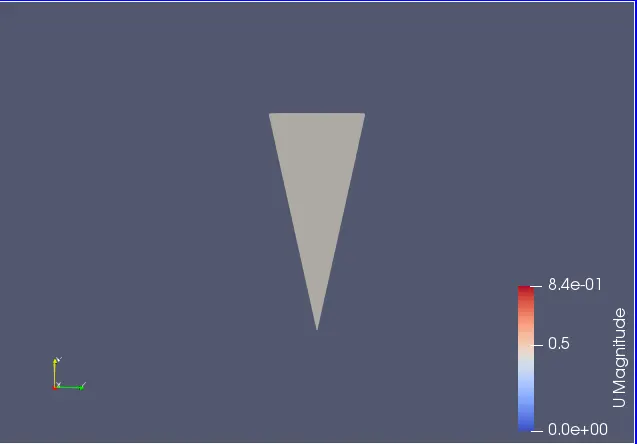
b) front view
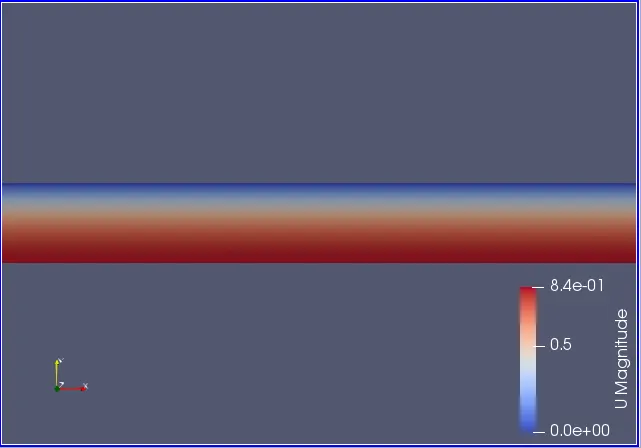
c) Isometric view
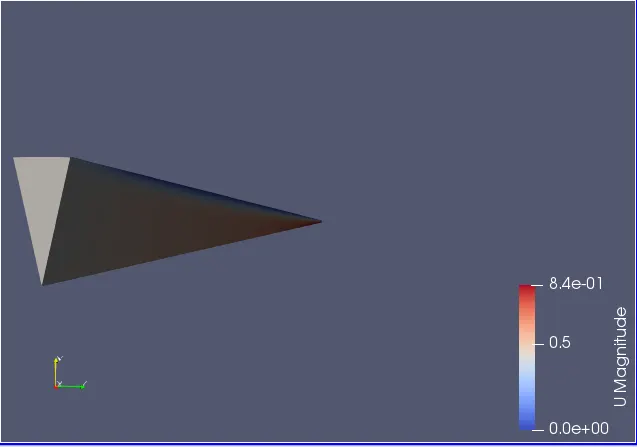
Plot 4:
plot 5:
plot 6:
Case 3 : `theta= 45 degrees`
a) side view
b) front view
c) Isometric view
Plot 7:
Plot 8 :
Plot 9:
Results :
Analytical velocity
`V_(avg) = (R_e * nu)/D`
Vavg= 2100*1.0034*e-4 /.005 = 0.42m/s
`triangle p_(analytical) = (32*1.0016*10^-3*0.475*0.42)/ .005^2` = 255.78 N/m^`
Case 1 : `theta=10`
a) Hydro-dynamic length with the numerical result
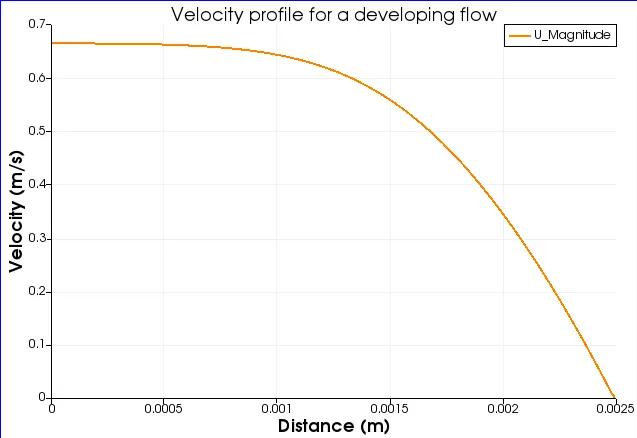
From the above 2 plots we can observe that the profile is completely formed only after hydrodynamic length . When it is measured before , the `L_h` it is not yet formed the complete parabolic shape.
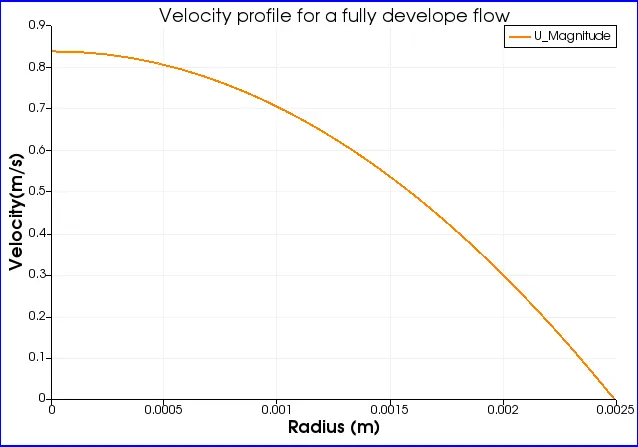
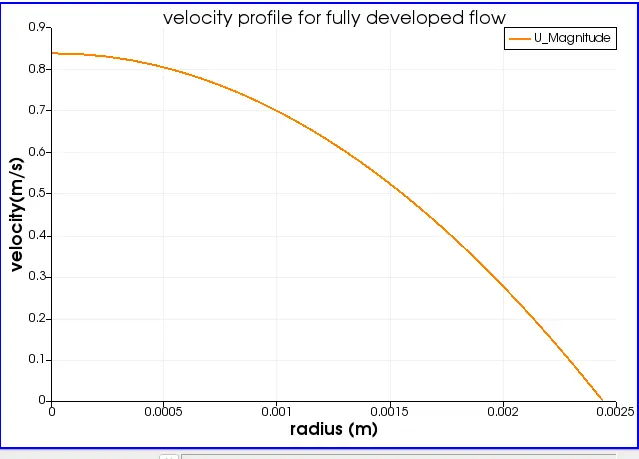
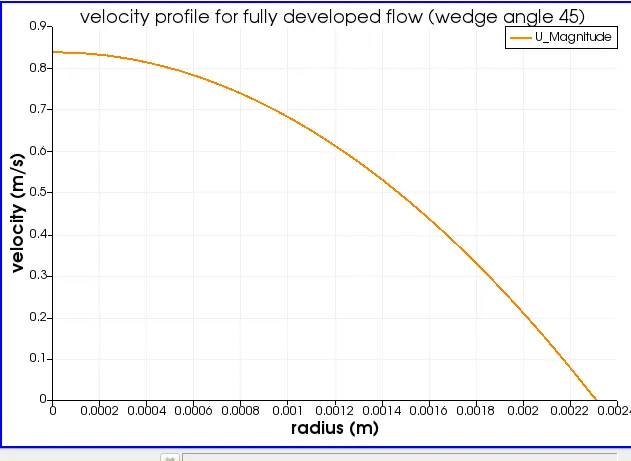
b) Fully developed flow velocity profile with its analytical profile
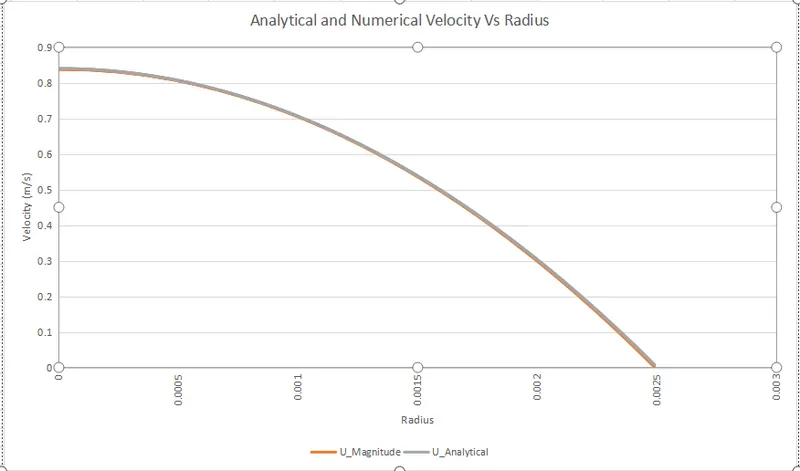
From the graph we can observe that the velocity value both analytical and numerical are very much similar with minute error value .
c)Maximum velocity and pressured drop for fully developed flow
Analytical velocity
`V_(avg) = (R_e * nu)/D`
Vavg= 2100*1.0034*e-4 /.005 = 0.42m/s
Max velocity =2xVavg
From the plot , we get Umax = 0.84
from calculated value, Vavg= 0.42
Hence the equation`U_(max) = 2V_(avg)` hold good as per our results
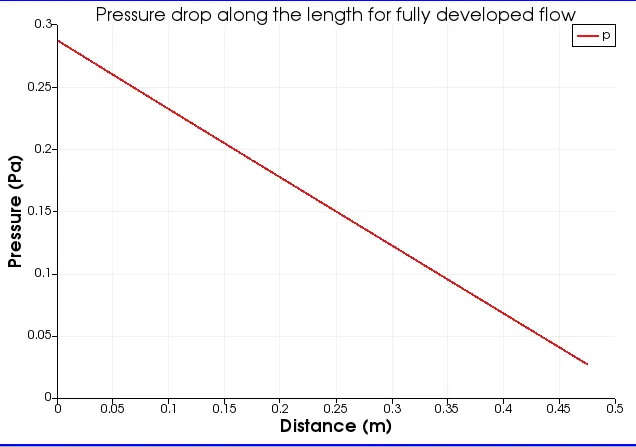
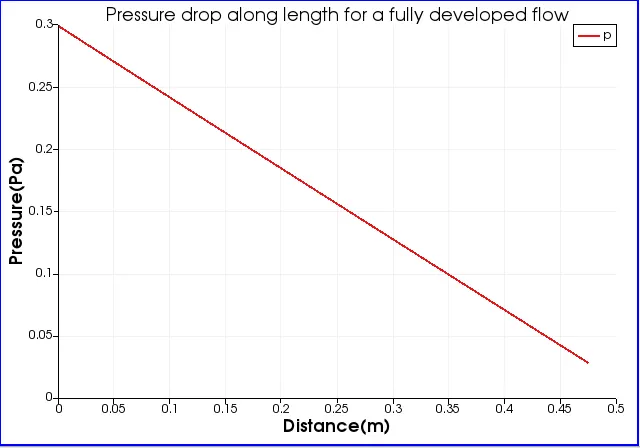
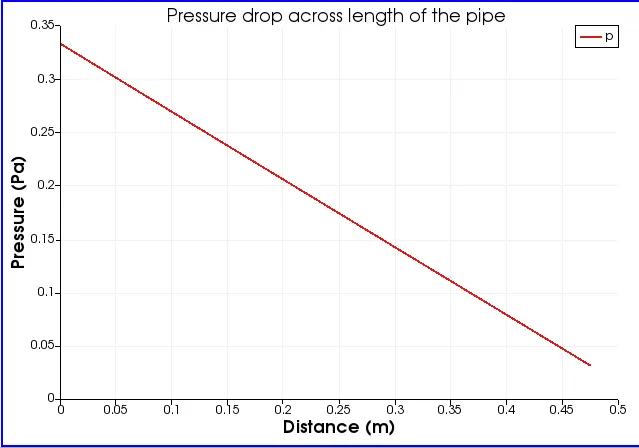
Max Pressure drop
`trianglep` from plot2 = .25
`trianglep_(actual) = trianglep *rho`
here we take water as working fluid .
hence we get `trianglep = 0.25*10^3`=250 N/m^2
`trianglep_(analytical) = (32.mu.L.V_(avg))/ D^2`
where L = Total length of pipe - Hydrodynamic length of pipe . =1.00 - 0.525=0.475
`mu` = 1.0016e-3
`V_(avg) = (Re*nu)/D` = 2100x1.0034e-6 / .005 = 0.42 m/s
substituting all these values in above equation
`triangle p = (32*1.0016*10^-3*0.475*0.42)/ .005^2` = 255.78 N/m^2
Here we can observe that the values are very close to eachother.
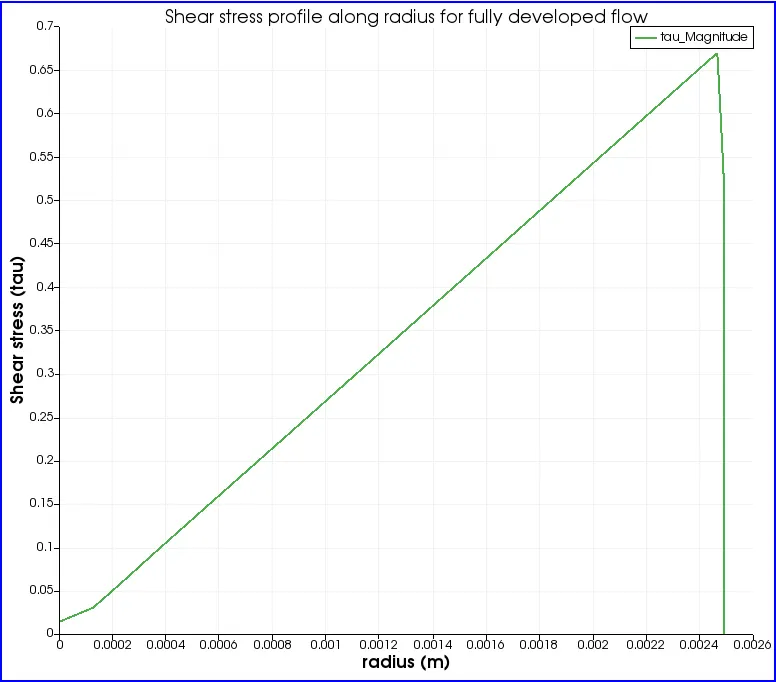
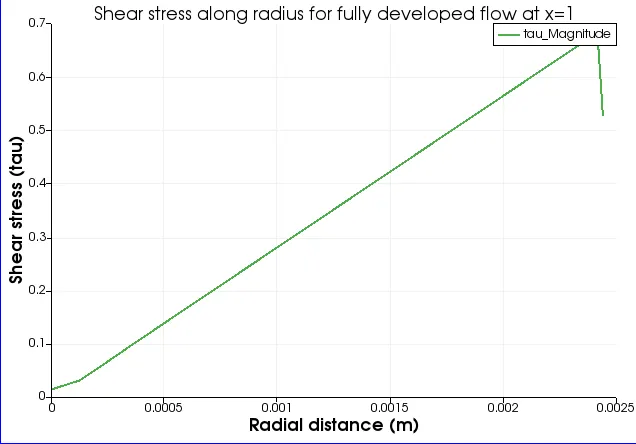
d) Shear stress plot
From the graph , we can observe that the maximum shear stress in formed near the walls . We can observe that the shear stress decreases towars the centre of the pipe , and is minimum at the centre of the pipe .
case 2 : `theta=25`
a) Hydro-dynamic length with the numerical result
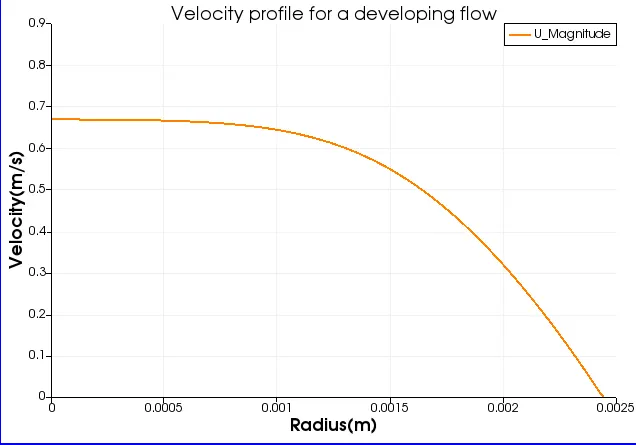
From the above 2 plots we can observe that the profile is completely formed only after hydrodynamic length . When it is measured before , the `L_h` it is not yet formed the complete parabolic shape.
b) Fully developed flow velocity profile with its analytical profile
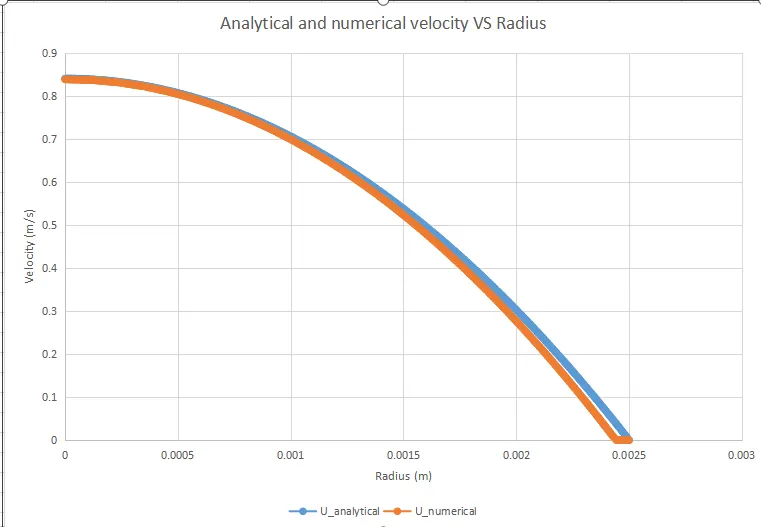
From the graph we can observe that the velocity value both analytical and numerical are very much similar with minute error value .
c)Maximum velocity and pressured drop for fully developed flow
Analytical velocity
`V_(avg) = (R_e * nu)/D`
Vavg= 2100*1.0034*e-4 /.005 = 0.42m/s
Max velocity =2xVavg
From the plot , we get Umax = 0.84
from calculated value, Vavg= 0.42
Hence the equation`U_(max) = 2V_(avg)` hold good as per our results
Max Pressure drop
`trianglep` from plot2 = .275
`trianglep_(actual) = trianglep *rho`
here we take water as working fluid .
hence we get `trianglep = 0.275*10^3`=275 N/m^2
`trianglep_(analytical) = (32.mu.L.V_(avg))/ D^2`
where L = Total length of pipe - Hydrodynamic length of pipe . =1.00 - 0.525=0.475
`mu` = 1.0016e-3
`V_(avg) = (Re*nu)/D` = 2100x1.0034e-6 / .005 = 0.42 m/s
substituting all these values in above equation
`triangle p = (32*1.0016*10^-3*0.475*0.42)/ .005^2` = 255.78 N/m^2
Here we can observe that the error value is slightly higher than that of 10 degrees . This is accounted by
i) More wedge angle implies more cross sectional area hence more flow and pressure drop(comparitively)
ii) More wedge angle also implies an increase in mesh size along z direction , which gives inaccurate results .
d) Shear stress plot
From the graph , we can observe that the maximum shear stress in formed near the walls . We can observe that the shear stress decreases towars the centre of the pipe , and is minimum at the centre of the pipe .
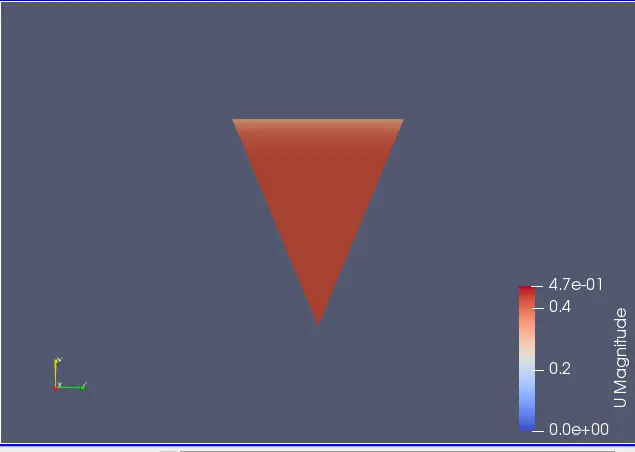
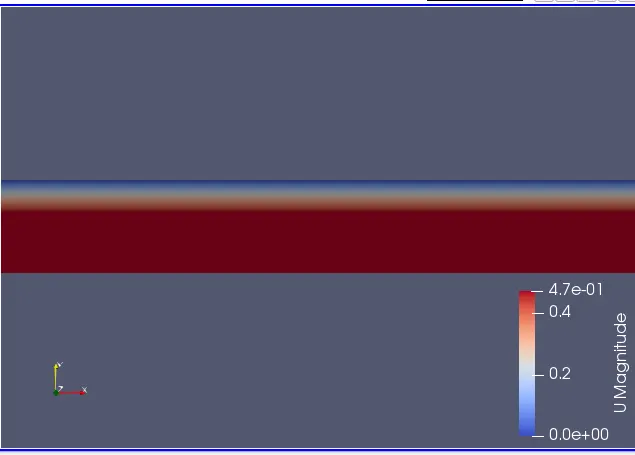
Case 3: `theta=45`
a) Hydro-dynamic length with the numerical result
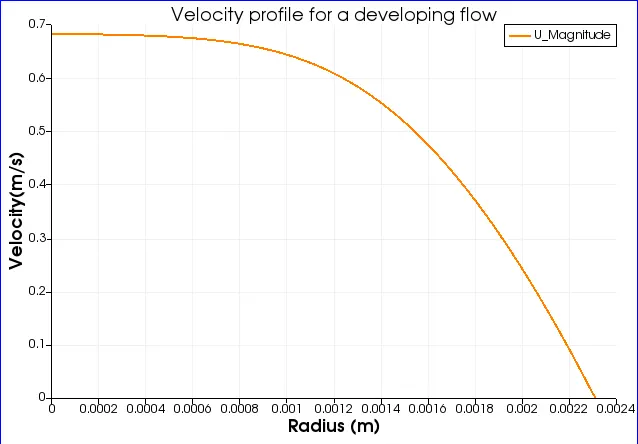
From the above 2 plots we can observe that the profile is completely formed only after hydrodynamic length . When it is measured before , the `L_h` it is not yet formed the complete parabolic shape.
b) Fully developed flow velocity profile with its analytical profile
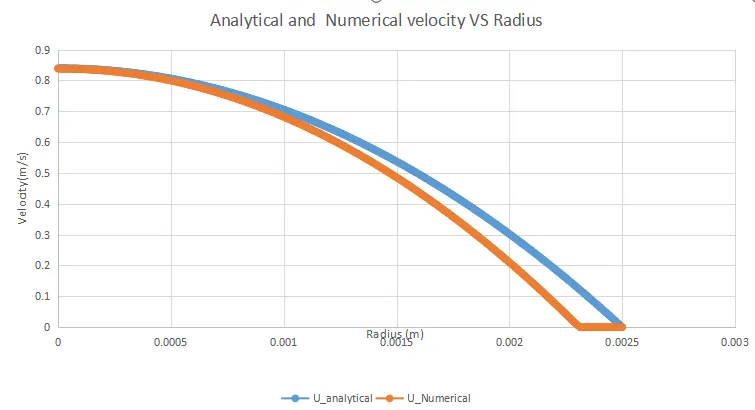
From the graph we can observe that the velocity value both analytical and numerical are very much similar with minute error value . However this is more than that of case 1 and 2 .
)Maximum velocity and pressured drop for fully developed flow
Analytical velocity
`V_(avg) = (R_e * nu)/D`
Vavg= 2100*1.0034*e-4 /.005 = 0.42m/s
Max velocity =2xVavg
From the plot , we get Umax = 0.84
from calculated value, Vavg= 0.42
Hence the equation`U_(max) = 2V_(avg)` hold good as per our results
Max Pressure drop
`trianglep` from plot2 = .295
`trianglep_(actual) = trianglep *rho`
here we take water as working fluid .
hence we get `trianglep = 0.295*10^3`=295 N/m^2
`trianglep_(analytical) = (32.mu.L.V_(avg))/ D^2`
where L = Total length of pipe - Hydrodynamic length of pipe . =1.00 - 0.525=0.475
`mu` = 1.0016e-3
`V_(avg) = (Re*nu)/D` = 2100x1.0034e-6 / .005 = 0.42 m/s
substituting all these values in above equation
`triangle p = (32*1.0016*10^-3*0.475*0.42)/ .005^2` = 255.78 N/m^2
Here we can observe that the error value is slightly higher than that of 10 and 25 degrees . This is accounted by
i) More wedge angle implies more cross sectional area hence more flow and pressure drop(comparitively)
ii) More wedge angle also implies an increase in mesh size along z direction , which gives inaccurate results .
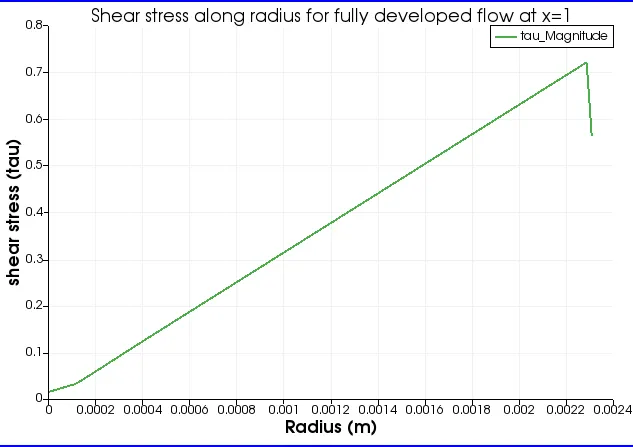
d) Shear stress plot
From the graph , we can observe that the maximum shear stress in formed near the walls . We can observe that the shear stress decreases towars the centre of the pipe , and is minimum at the centre of the pipe . However we can observe that the max shear stress value is higher than that of case 1 and 2 .
Inference
Differences in both boundary conditions in terms of their usage and aplication
Plotted below are similar plots for wedge boundary condtitions .
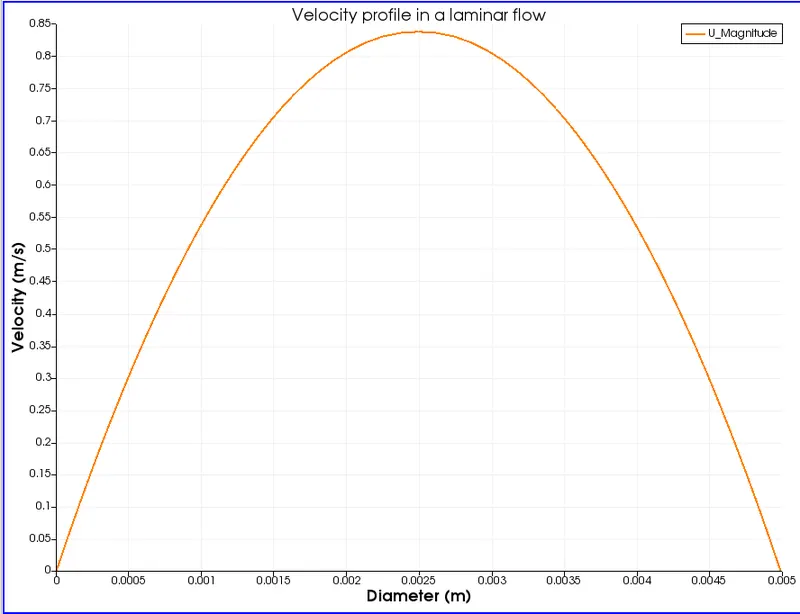
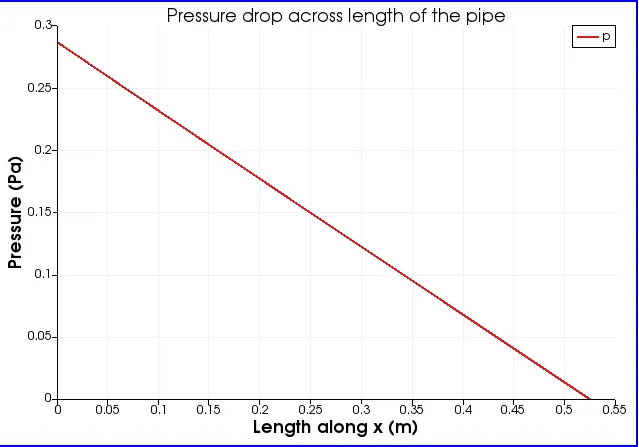
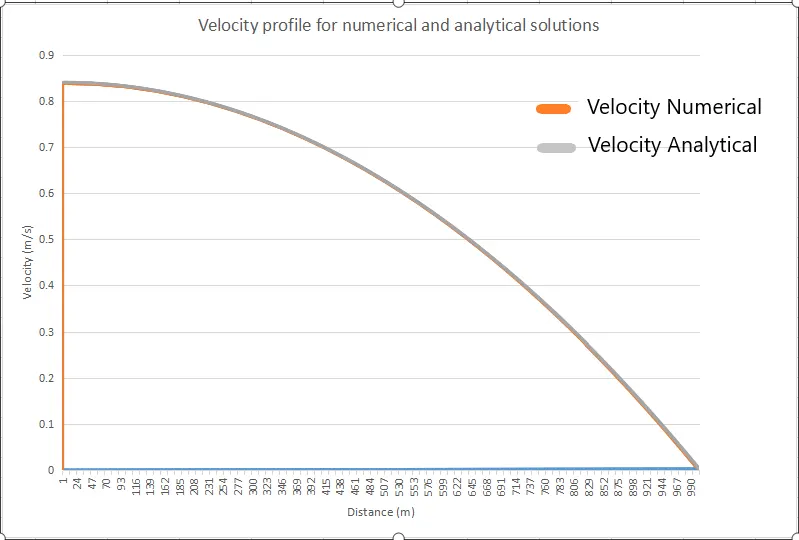
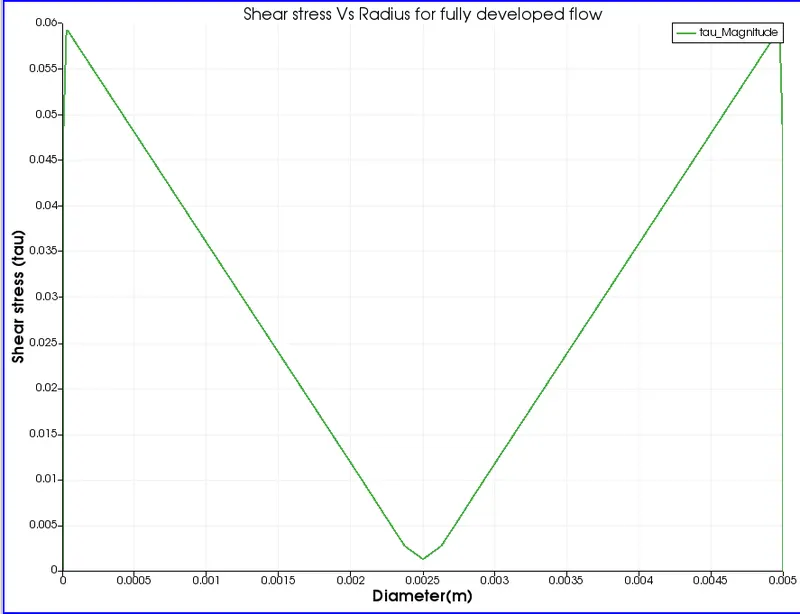
From these plots , we can observe that the values are almost equal and differs only by a very small margin .
However the wedge angle was <5 in case of wedge boundary condtion and upto 45 in symmetry boundary condition .
Symmetry can be applied in case of high wedge angles and wedge in case of low wegde angles .
Wedge boundary conditions converts the model into 2D whereas symmetry boundary condition treats the problem as 3D .