Week 12 - Validation studies of Symmetry BC vs Wedge BC in OpenFOAM vs Analytical H.P equation
Expected Results
- Validate Hydro-dynamic length with the numerical result
- Validate the fully developed flow velocity profile with its analytical profile
- Validate maximum velocity and pressured drop for fully developed flow
- Post-process Shear stress and validate wall shear stress for fully developed flow
- Highligh the differences in both boundary conditions in terms of their usage and aplication
Introduction
Wedge Boundary conditions
The wedge boundary condition (BC) is used in computational fluid dynamics to define an axisymmetric situation, for eg. cylinder. The model and flow must be axisymmetric along a central line such that all physical variables of the flow have the same value and distribution at a given radius for all angles.
This boundary condition is specified by two planes that must be selected on separate sides of the domain (referred to as front and back) on surfaces running along the axis. It works for 2D simulations only.
Note:
To simulate a two-dimensional model or flow the geometry needs to be specified as a wedge with a small angle (<5 degrees) and a single cell thickness along the curvature
Symmetry Boundary conditions
The symmetry boundary condition defines a mirror face/surface. It should only be used if the physical object or geometry and the expected flow field pattern of the developed solution are mirrored along that surface. By using this boundary condition, the domain can essentially be halved, reducing the time to achieve a solution.
In detail, the symmetry condition applies the following constraints on the flow variables:
- The fluxes across the symmetry are zero.
- The normal components of all variables are set to zero.
It can be applied to both planar or non-planar faces/surfaces on the domain boundaries.
Note:
This boundary condition should not be used for axisymmetric or periodic flow cases
Equations used for calculation
- v_avg = Re*mu/(d*rho)
= (2100*0.00089)/(0.03*1000)
=0.0623
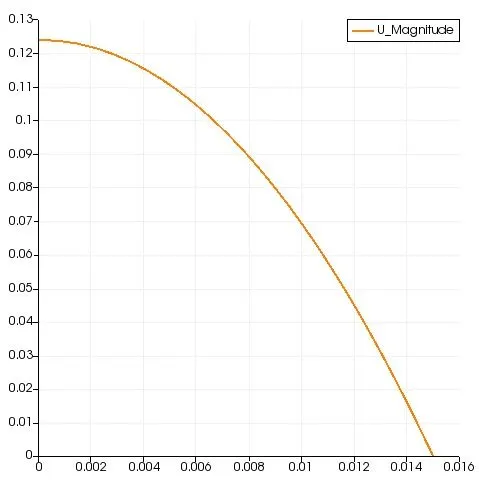
- v_max = 2*v_avg
=2*0.0623 = 0.1246
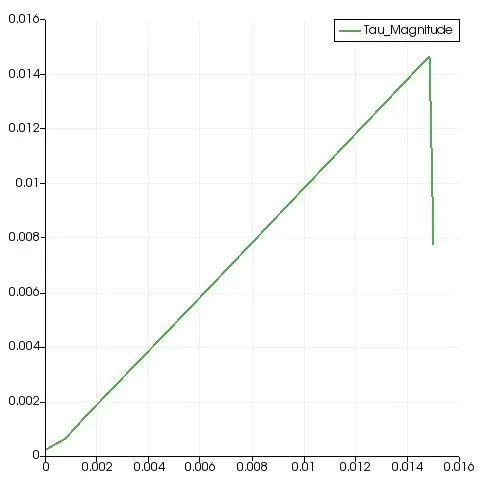
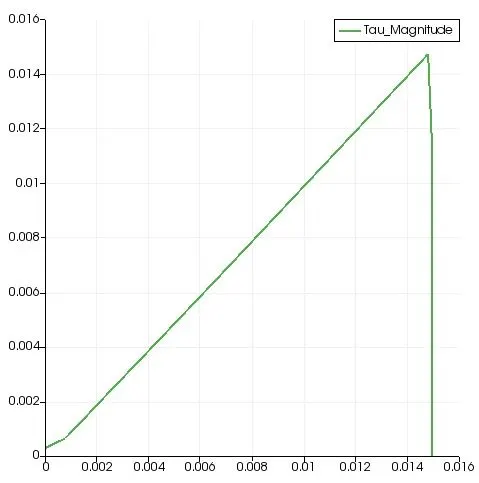
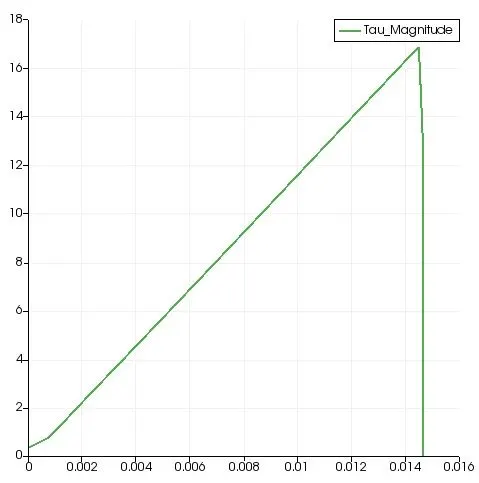
- Tau = (2*mu*v_max)/r
= (2*0.00089*0.1246)/0.015
=0.0148
Obtained results
For wedge boundary condition,
wedge angle = 1 degree
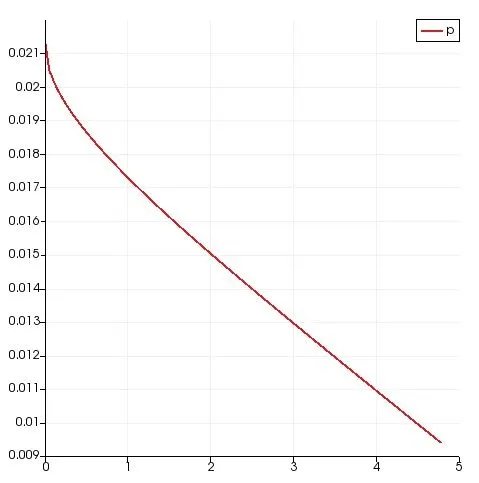
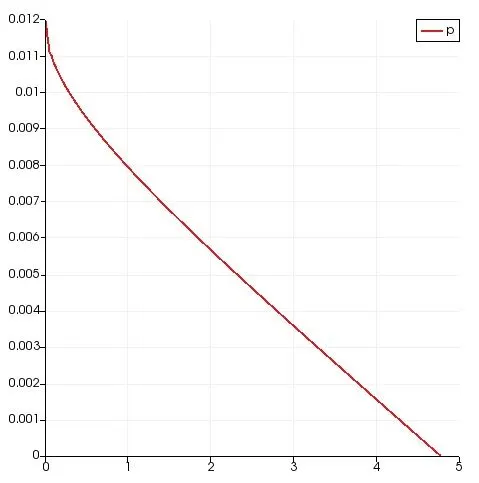
- Pressure drop across the pipe
- Shear stress variation along y-axis at fully devoloped region
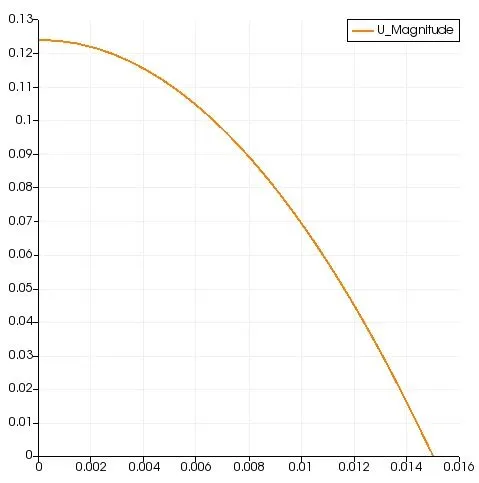
- Velocity profile at 4.5m
Wedge angle = 2 degree
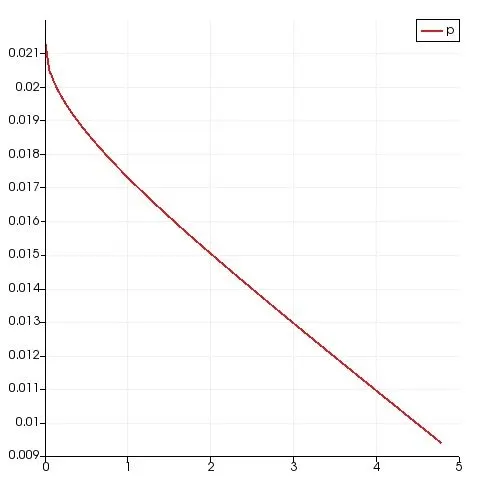
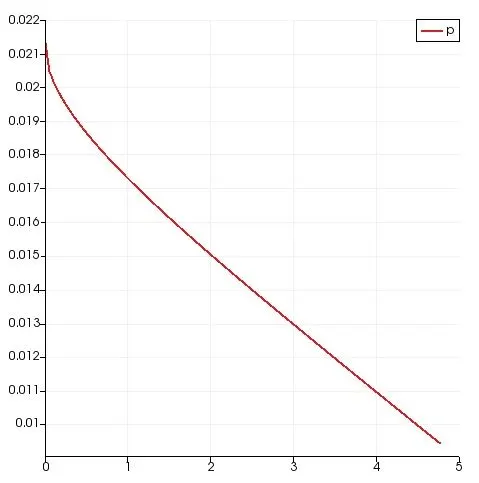
- Pressure across pipe
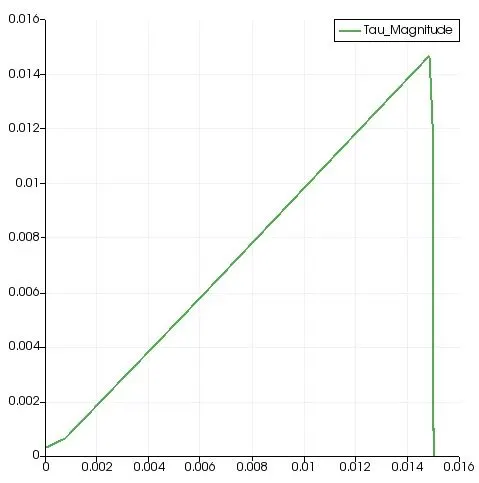
- Shear stress of fully devoloped flow (y-axis)
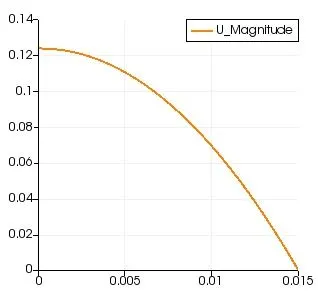
- Velocity profile of fully developed flow
Wedge angle = 3 degree
- Pressure across pipe
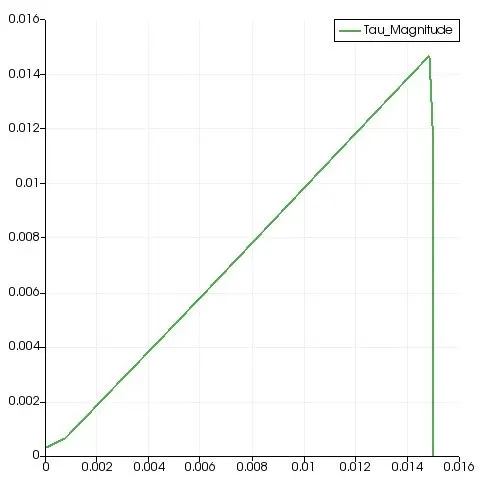
- Shear stress at fully developed region across y-axis
- Velocity profile at fully developed region
Symmetry Boundary condition,
Wedge angle = 10 degree
- Pressure across pipe
- Shear stress across y-direction at fully developed region
- Velocity profile at fully developed region
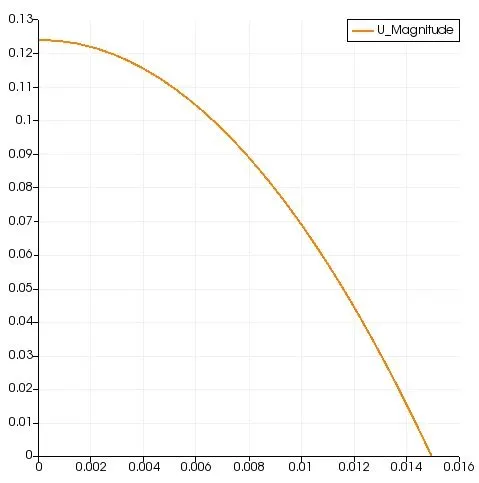
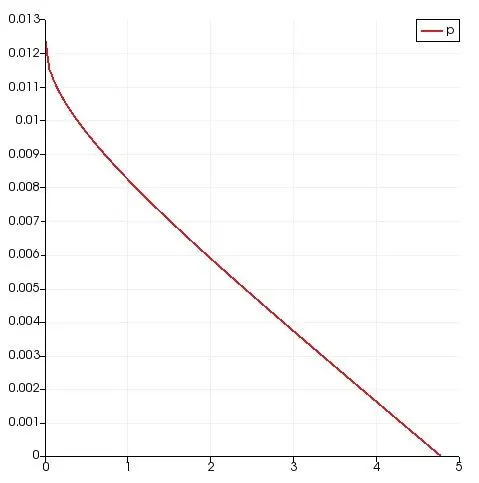
Wedge angle = 25 degree
- Pressure across pipe
- Shear stress across y-direction at fully developed region
- Velocity profile at fully developed region
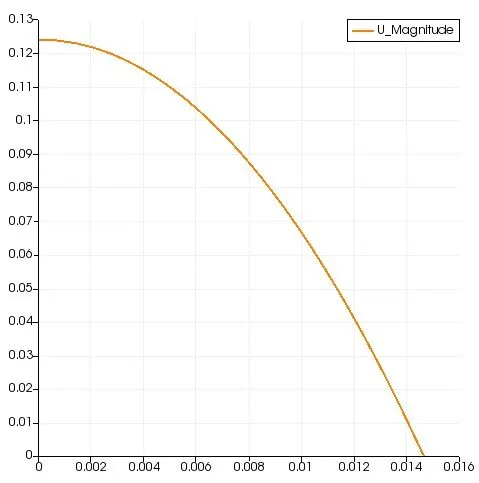
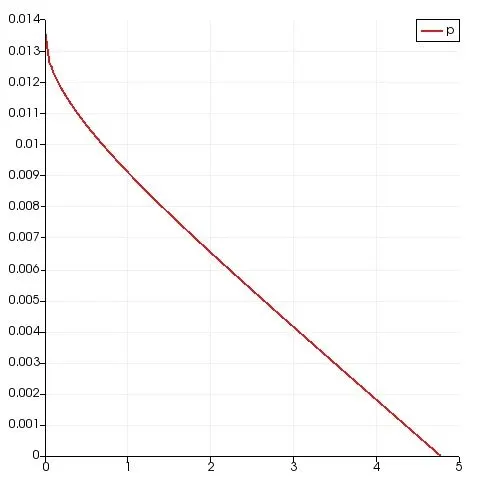
Wedge angle = 45 degree
- Pressure across pipe
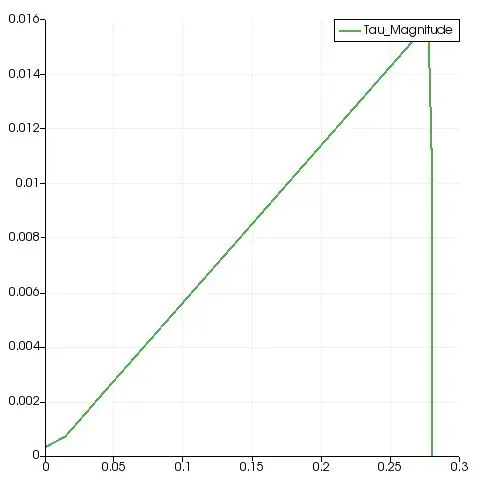
- Shear stress across y-direction at fully developed region
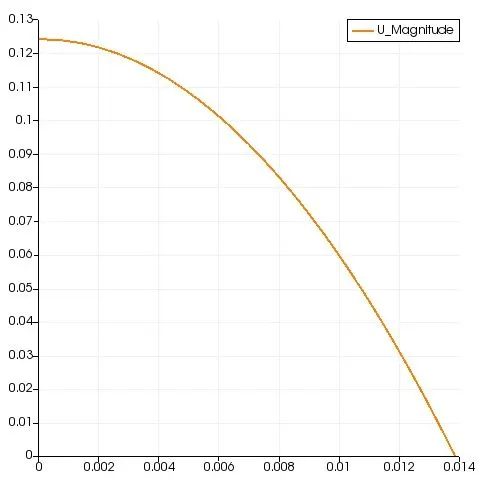
- Velocity profile at fully developed region
Putting values for comparison
| Max.Velocity | percentage error of max.Velocity | |
| Calculated Value | 0.1246 | 0 |
| Wedge angle = 1 degree (wedge BC) | 0.123452 | 0.9213 |
| Wedge angle = 2 degree (wedge BC) | 0.123453 | 0.9205 |
| Wedge angle = 3 degree (wedge BC) | 0.123454 | 0.9197 |
| Wedge angle = 10 degree (symmetry BC) | 0.123726 | 0.701 |
| Wedge angle = 25 degree (symmetry BC) | 0.123759 | 0.674 |
| Wedge angle = 45 degree (symmetry BC) | 0.124126 | 0.3804 |
- As the wedge angle is increased the accuracy is also incresed
- At symmetric boundary conditions we have less error compared to wedge boundary conditions
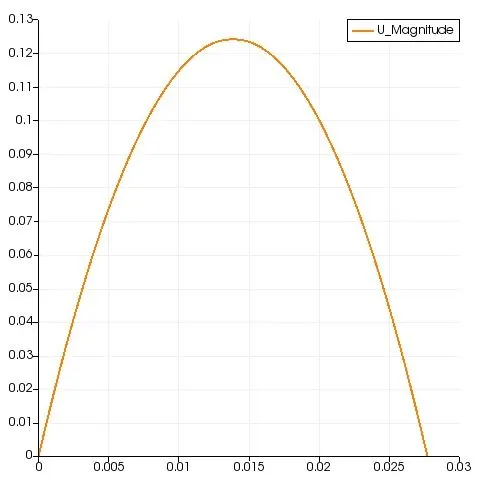
- Since we are using symmetric boundary condary condition we can actually mirror the result to visualize entire pipe flow. A mirrored result of velocity profile for wedge angle 45 is given below
Validation
- Numerically we got the hydrodynamic length as 3.78 at it was seen that after this point the change in parametres were low, so it can be assumed that this point is where the hydrodynamic length ends and fully developed flow starts
- The above graph is of form parabola, analytically the grapgh would be parabola so the velocity profile can be validated with analytical one
- Looking at the above table, the maximum velocities obtained from different wedge angles and boundary conditions are similiar from the calculated value 0.1246m/s. However we have different values of error for each wedge angle
- Since average velocities are connected to maximum velocity the above point is applicable here also(values will be different but the error is same)
- From the previous project we calculated the maximum shear stress(at wall) and got the value as 0.0148, by looking at the graph we can make sure that the maximum value for shear is closer to the calculated value