Week 12 - Final Project - Modelling and Analysis of a Datacenter
AIM : To Model and Simulate the cooling of the datacenter in Ansys Icepak.
OBJECTIVES :
- Setting up the model Geometry of the datacenter with the given data.
- Create optimal meshing for the model using the object mesh parameter.
- Setup the model for the Analysis.
- Run the simulation and Post Process the results.
INTRODUCTION :
A data center is a physical room, building or facility that houses Server, computer systems and associated components for building, running, and delivering applications and services, and for storing and managing the data associated with those applications and services.
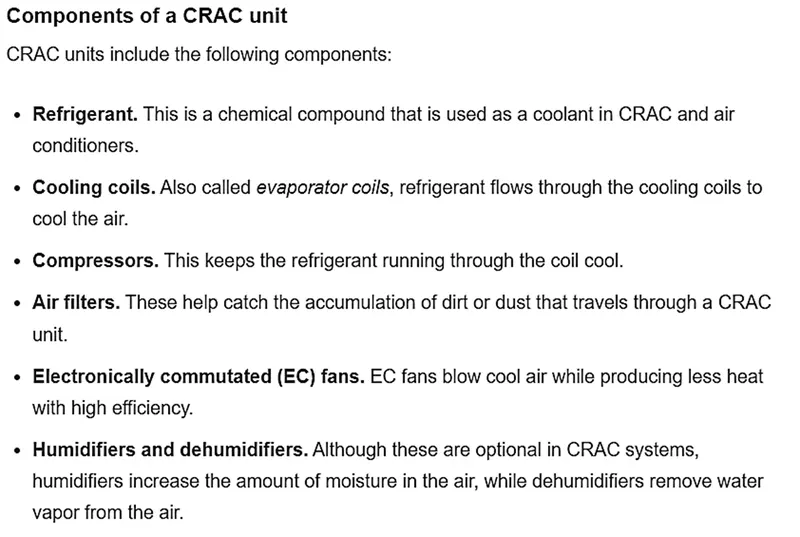
A computer room air conditioning (CRAC) unit is a device that monitors and maintains the temperature, air distribution and humidity in a data center, network or server room. CRAC units replace the air-conditioning units used in the past to cool data centers. By comparison, CRAC systems have better air filtration, better humidity control mechanisms and higher airflow than typical AC systems.
A power distribution unit is a device fitted with multiple outputs designed to distribute electric power, especially to racks of computers and networking equipment located within a data center.
One popular CRAC setup is having cooling air dispensed through an elevated floor. Also called raised flooring, the cooled air rises through the perforated floor sections, forming cold aisles. The cold air flows through the racks, where it picks up heat before exiting from the rear of the racks. The warm exit air forms hot aisles behind the racks, and the hot air returns to the CRAC intakes, which are positioned above the floor.
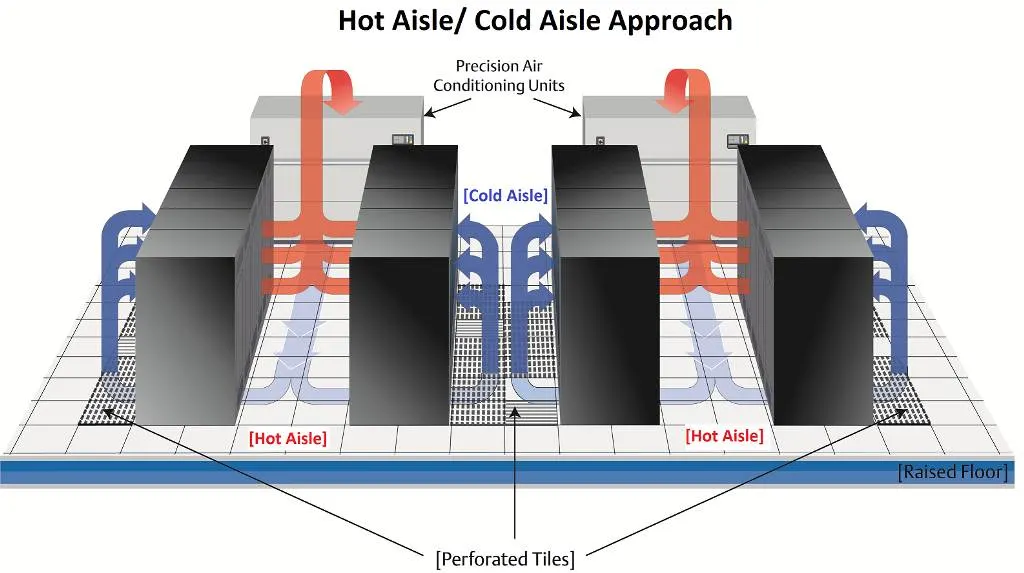
Raised floor cooling in data centers forces cool airflow upward through the floor, up past servers and into a CRAC intake where the air is cooled.
STEPS / PROCEDURE :
1) Geometry
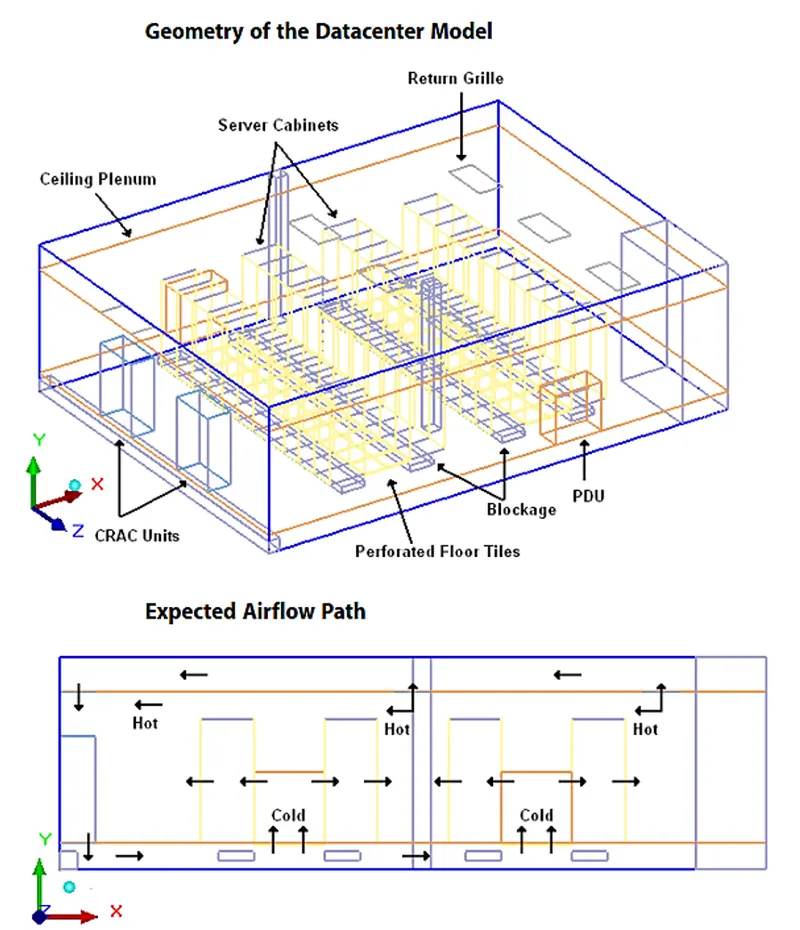
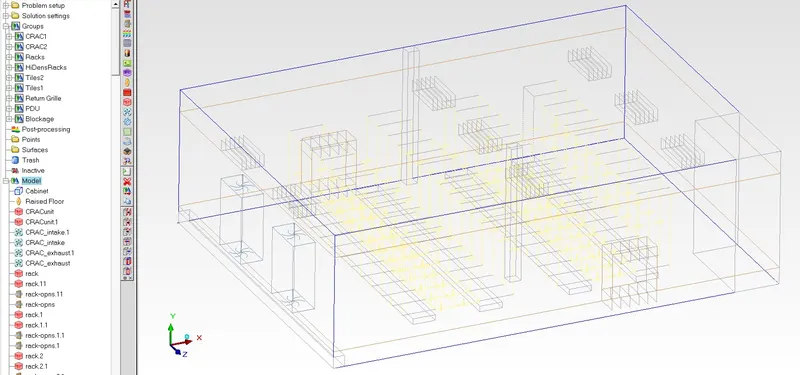
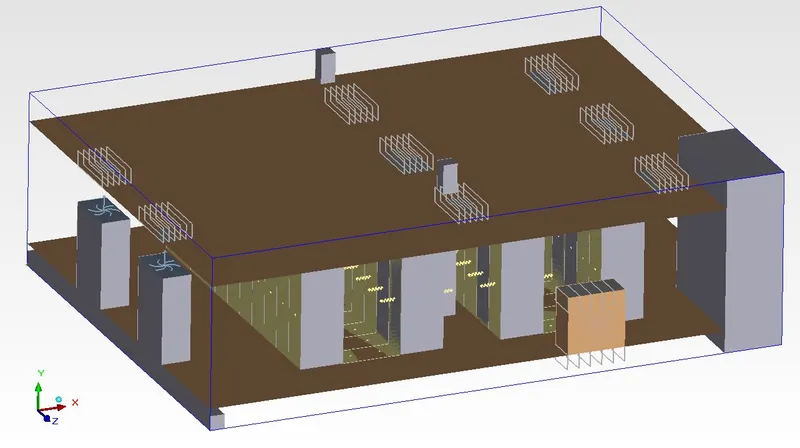
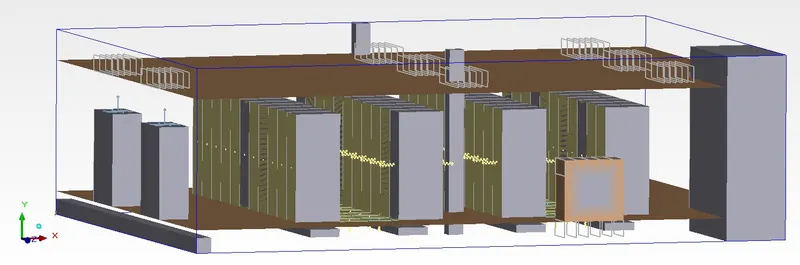
The Given data for the geometry shown below-
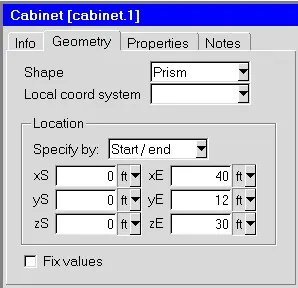
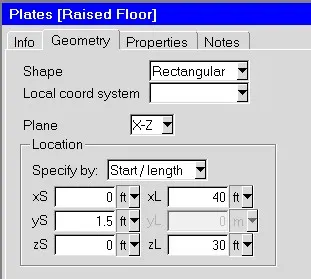
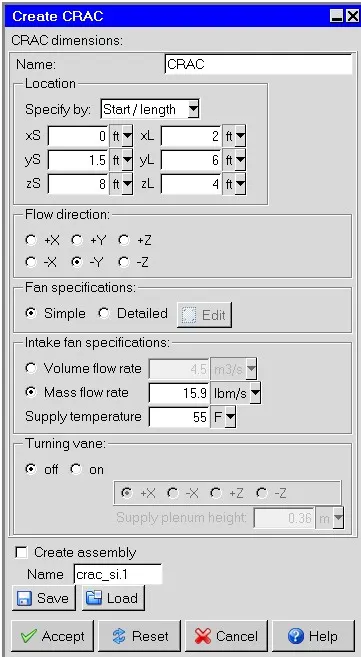
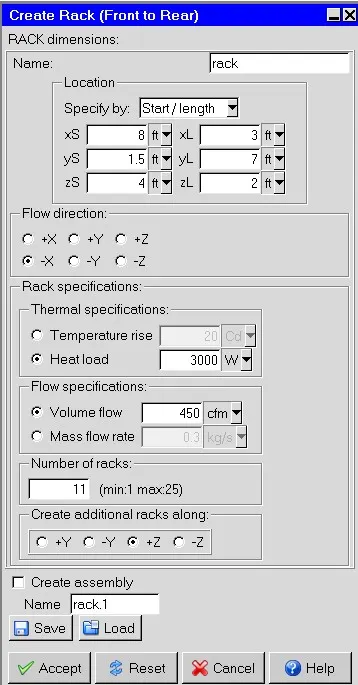
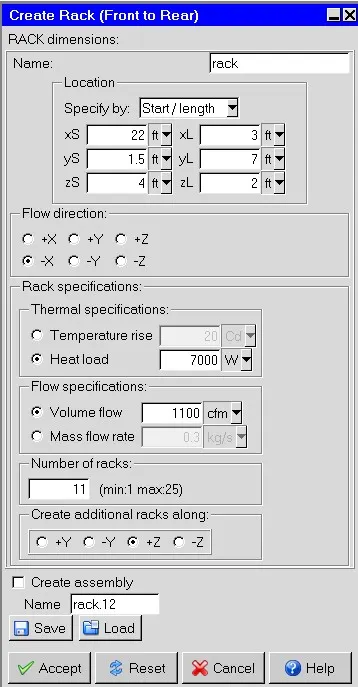
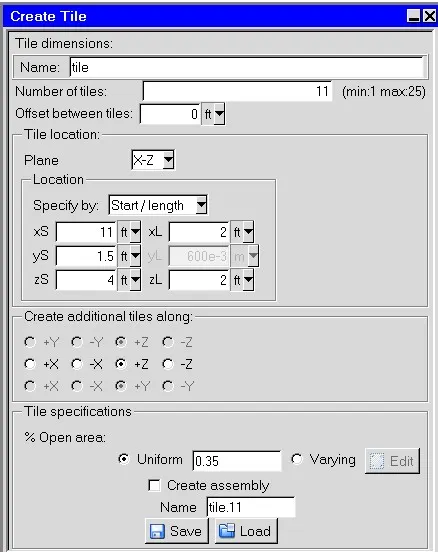
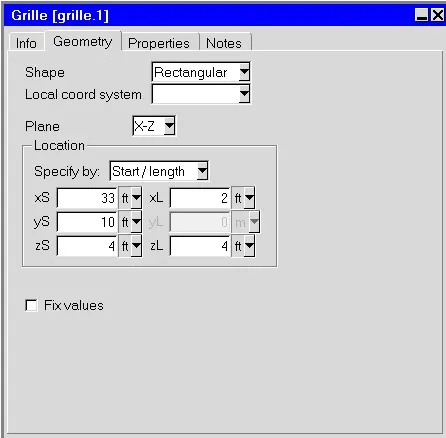
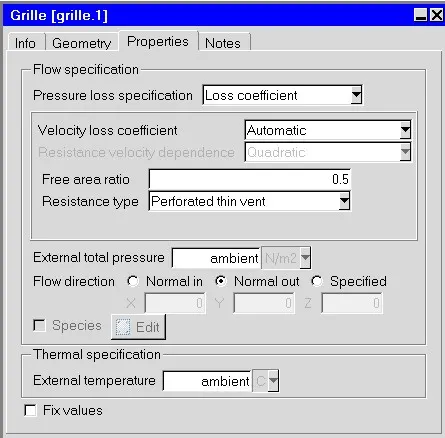
Following are the geometrical values for creating the given datacenter data -
2) Meshing
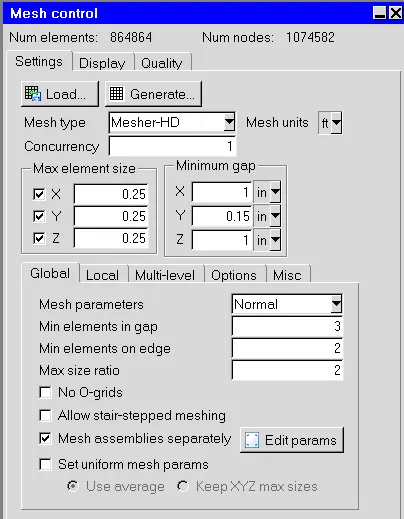
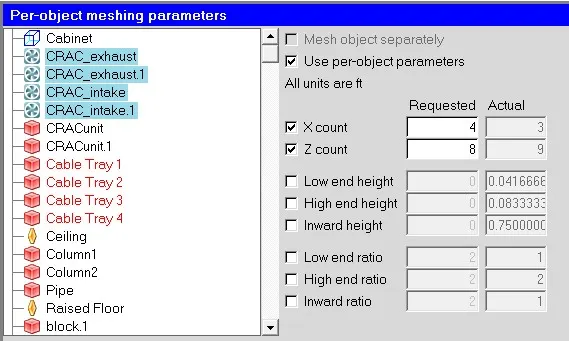
Following is setting used for global mesh and the assembly mesh settings -
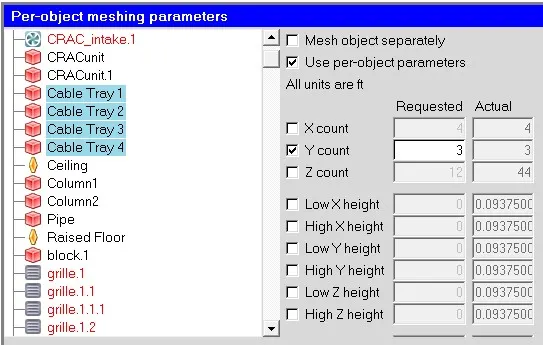
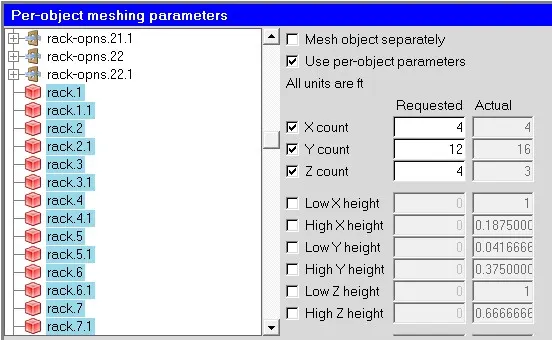
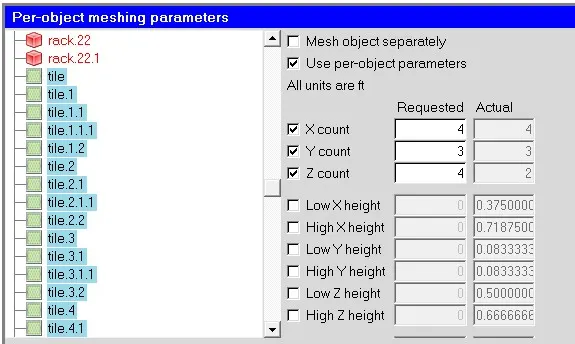
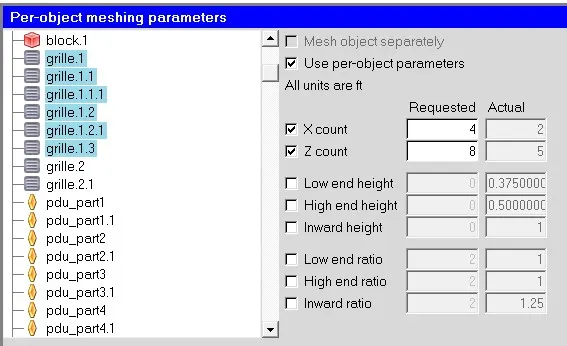
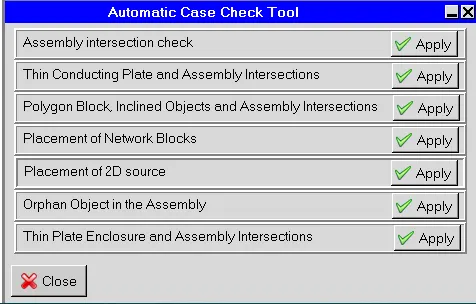
Case check tool in Macros options-

Mesh Quality Verification-
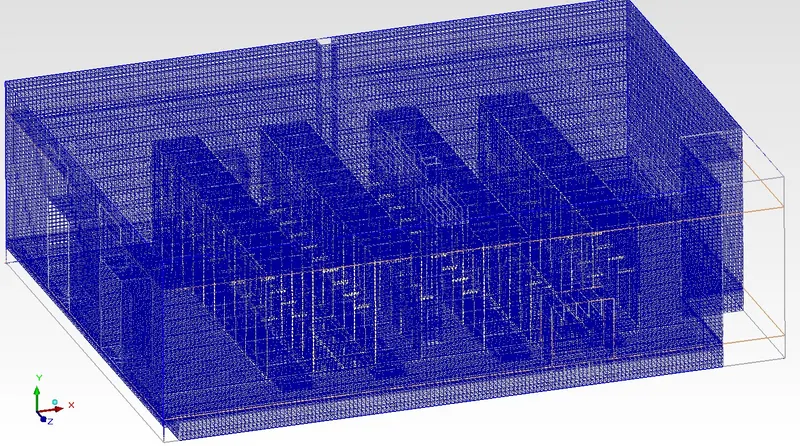
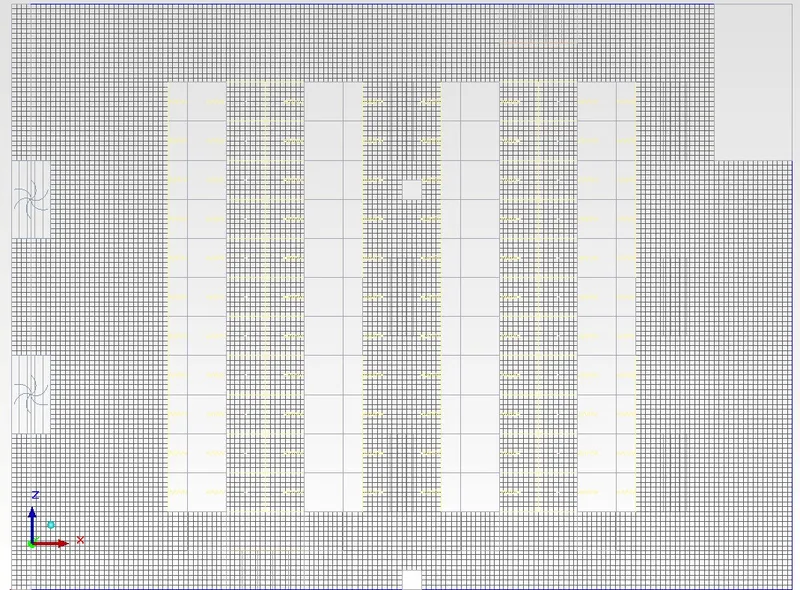
Following is the surface mesh of the Case Setup -
Following is the visualising the mesh inside the cabinet-
- Cut plane of XY plane at 50% of the cabinet in Z-direction from origin (Front Plane)
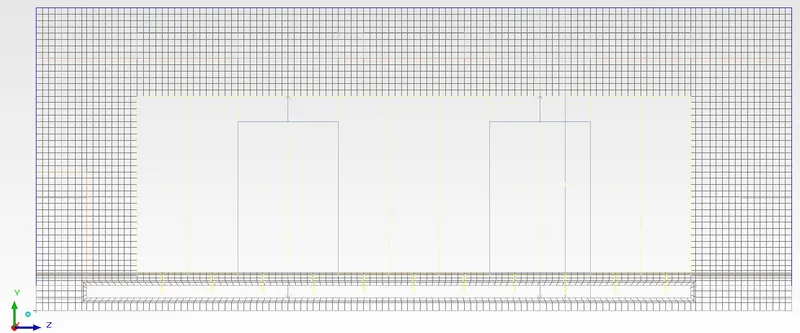
- Cut plane of YZ plane at 50% of the cabinet in X-direction from origin (Right Plane)
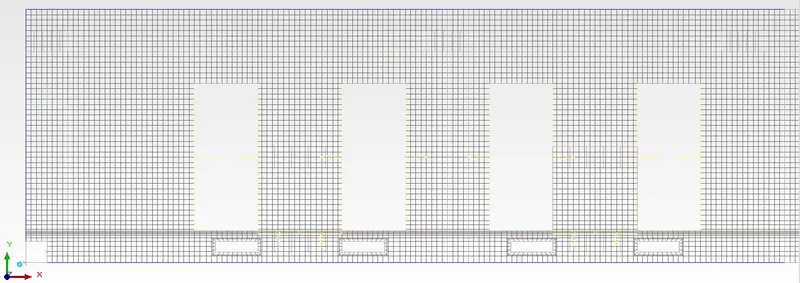
- Cut plane of XZ plane at 50% of the cabinet in Y-direction from origin (Top Plane)
Mesh Quality Parameters -
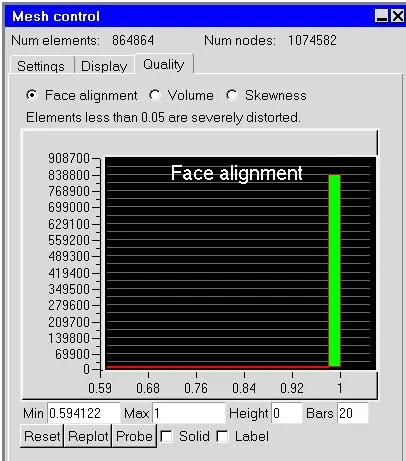
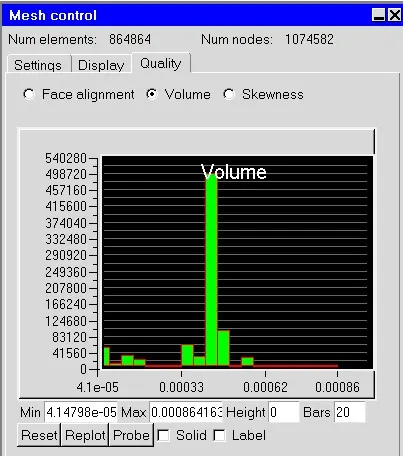
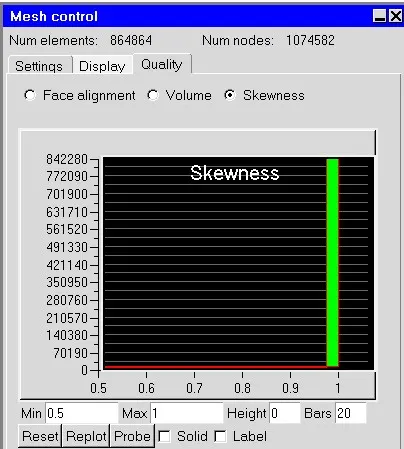
We can the mesh quality is very satisfied. 90% of the mesh cell are lying on good quality range.
Solver Settings -
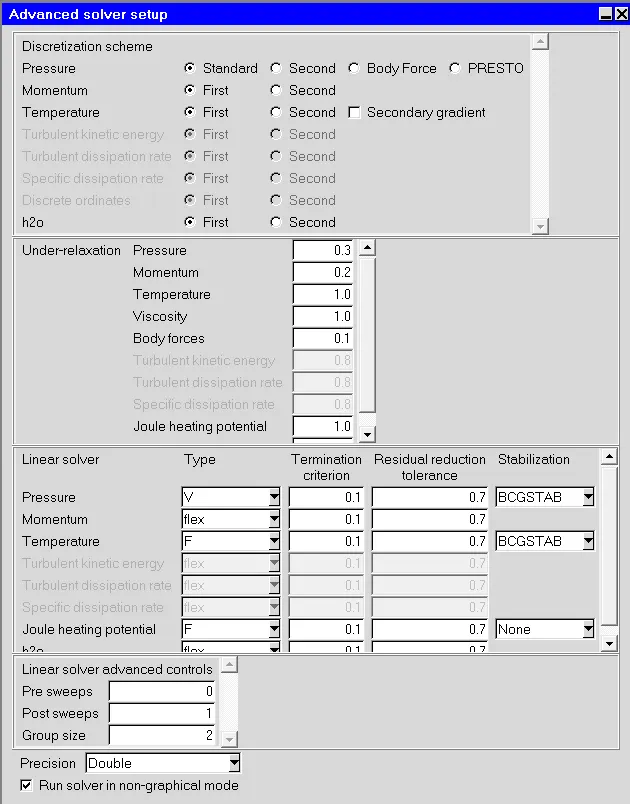
Setting solver settings and initialization values.
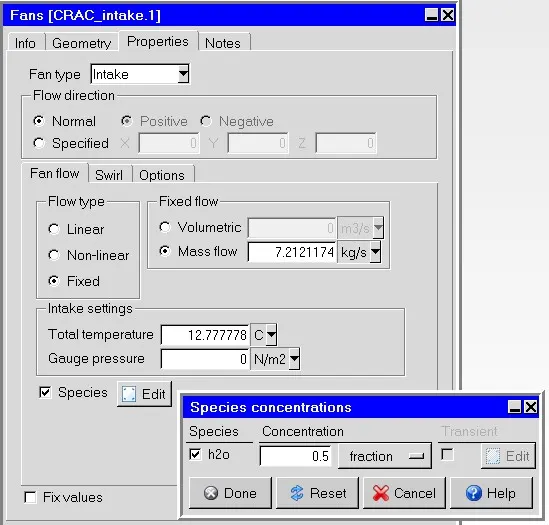
The temperature conditions maintained inside are ambient in nature, which is 20 degrees centigrade. The solid materials used in the model are Mica-Typical.In the electrical industry the same as thermal insulation, and electrical insulators in electronic equipment
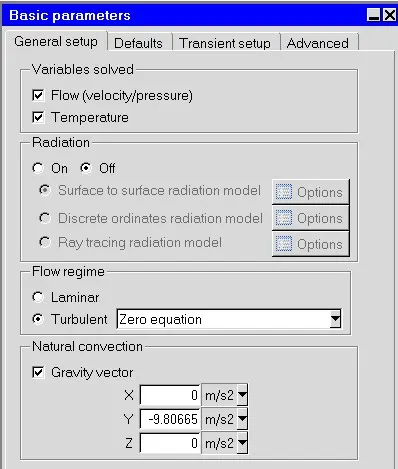
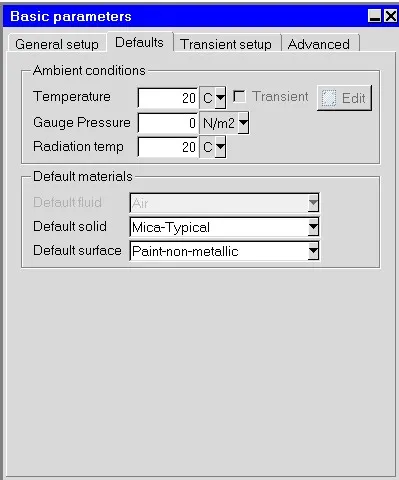
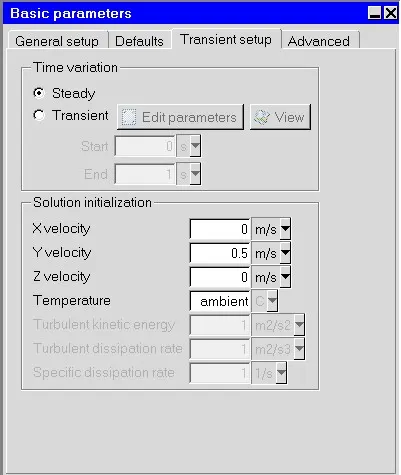
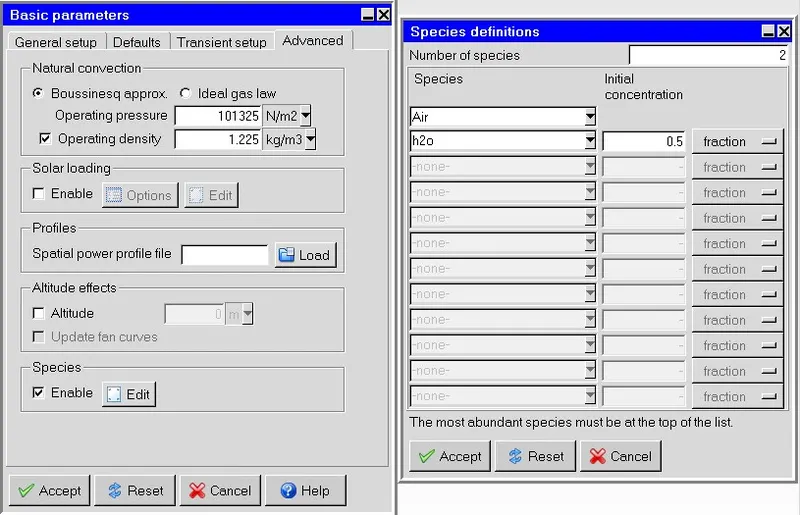
Here we have enabled the species section and provided the H2O gas as a species inside the model of the datacenter.
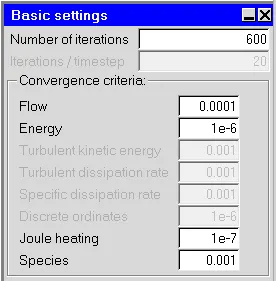
In the basic settings panel, we need to give the number of iterations to 600.
The convergence criteria of Flow is set to 0.0001 and energy is set to 1e-6, turbulent kinetic energy to 0.001, and joule heating is set to 1e-7.
POST PROCESSING :
Outputs
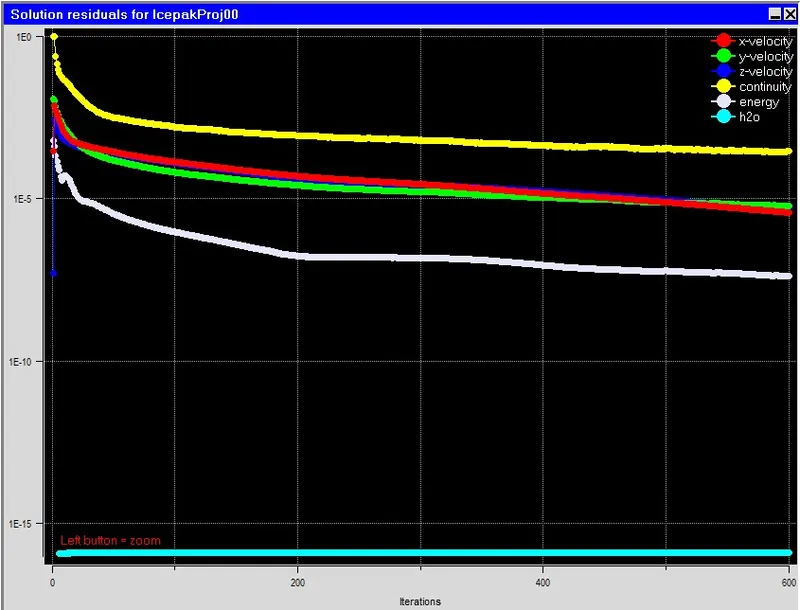
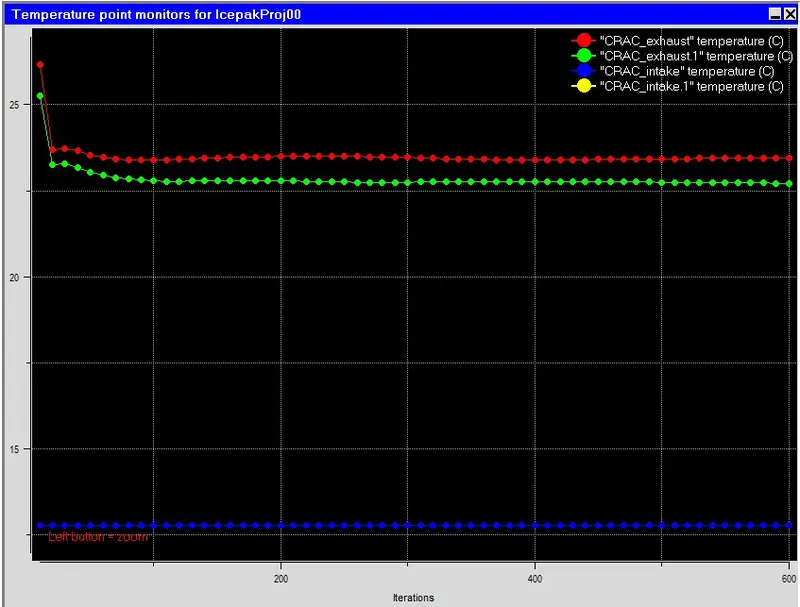
Residuals and Monitor Plot -
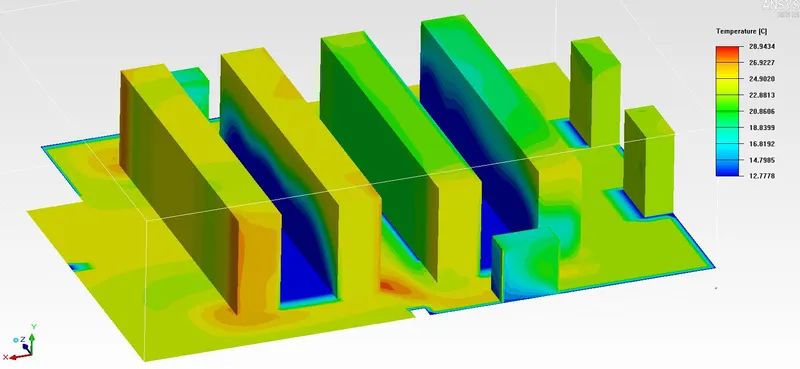
Surface temperature plot across the datacenter -
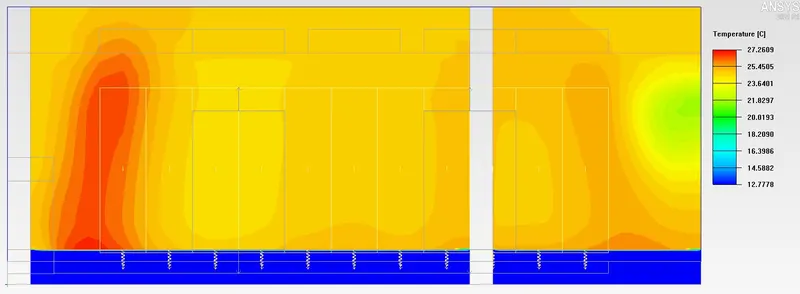
Contour Plots -
Along X Direction at 50% of the datacenter -
Temperature Contour
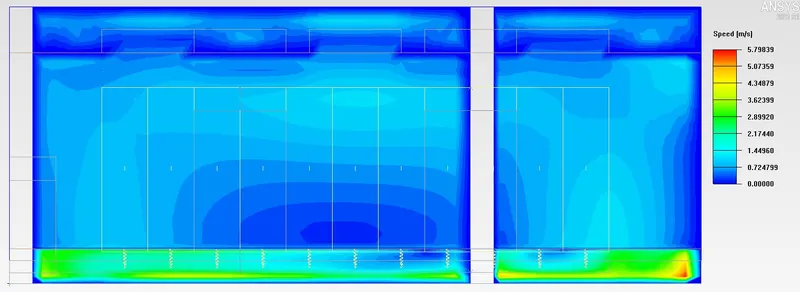
Velocity Contour
Pressure Contour
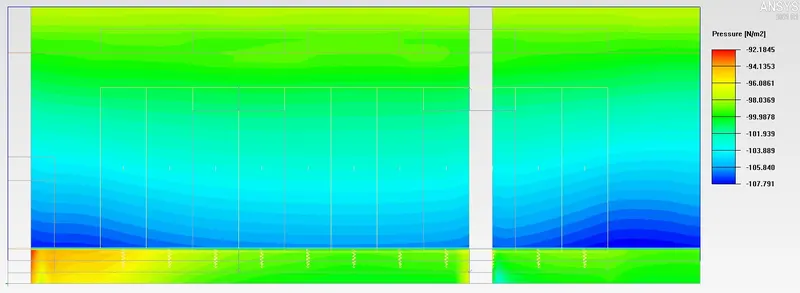
Along X Direction at the tiles and in between racks -
Temperature Contour
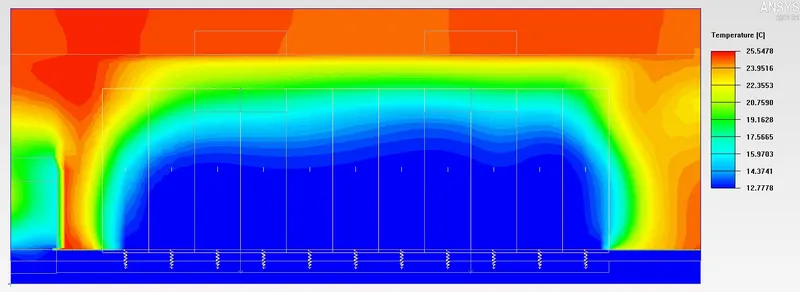
Velocity Contour
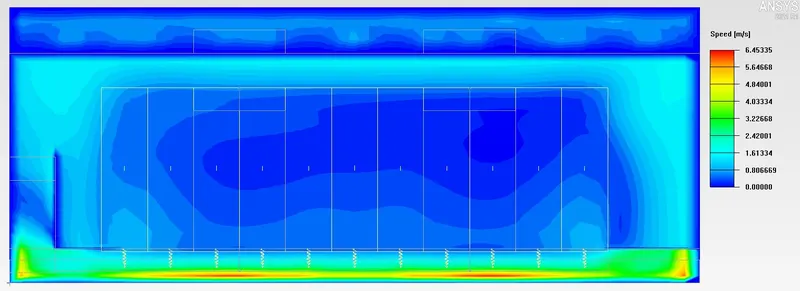
Pressure Contour
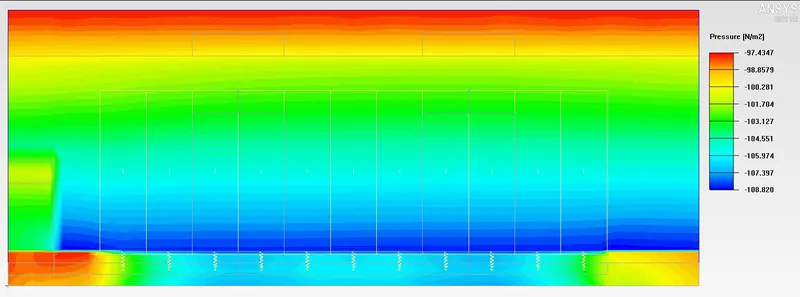
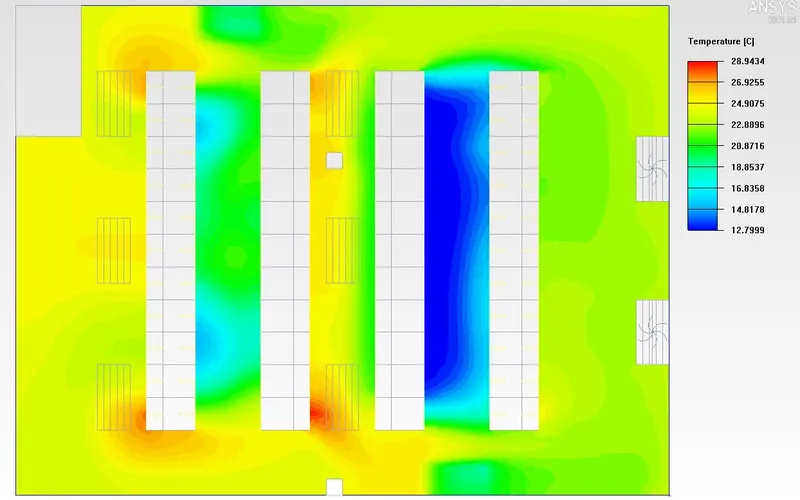
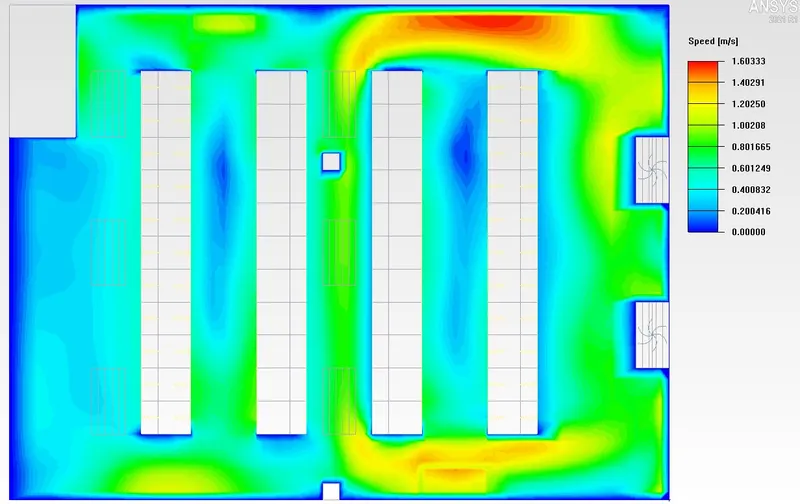
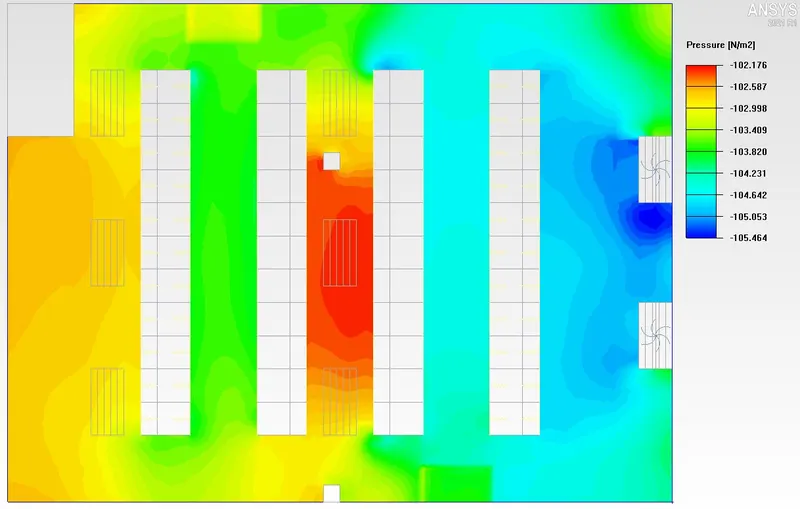
Along Y Direction -
Temperature Contour
Velocity Contour
Pressure Contour
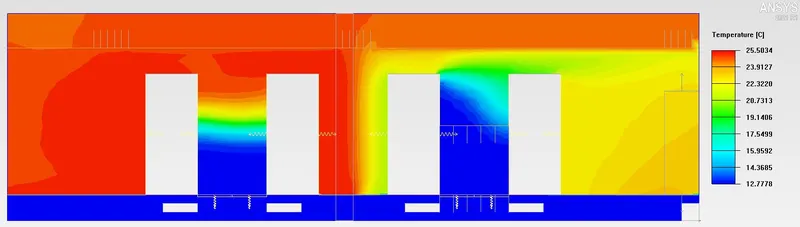
Along Z Direction -
Temperature Contour
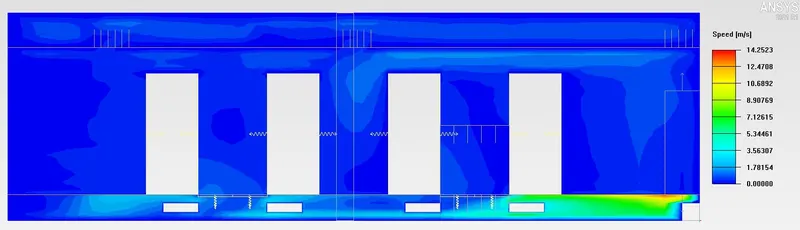
Velocity Contour
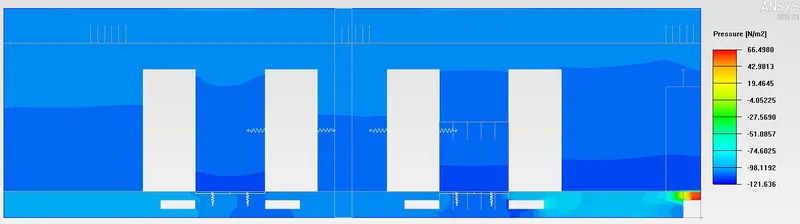
Pressure Contour
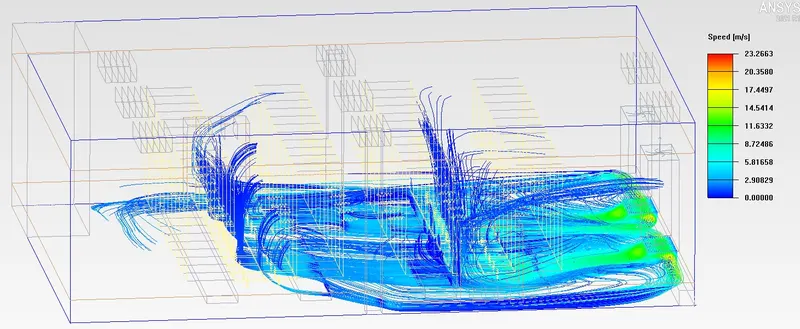
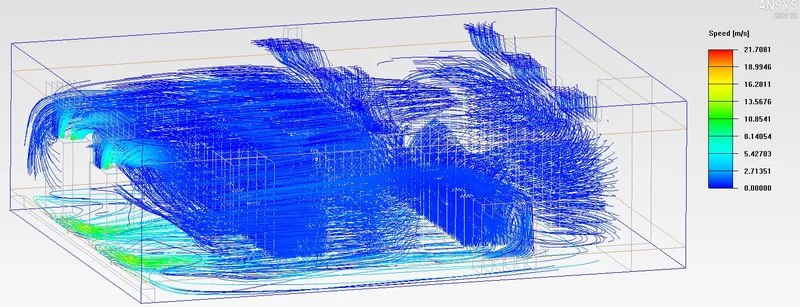
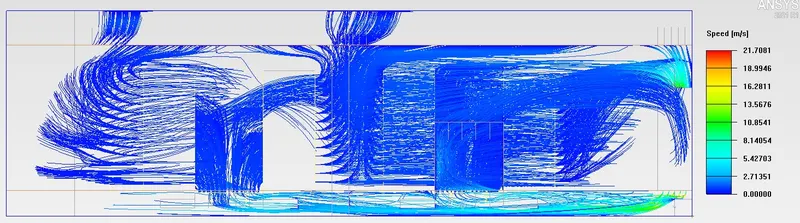
Streamline Plot of the flow -
RESULTS :
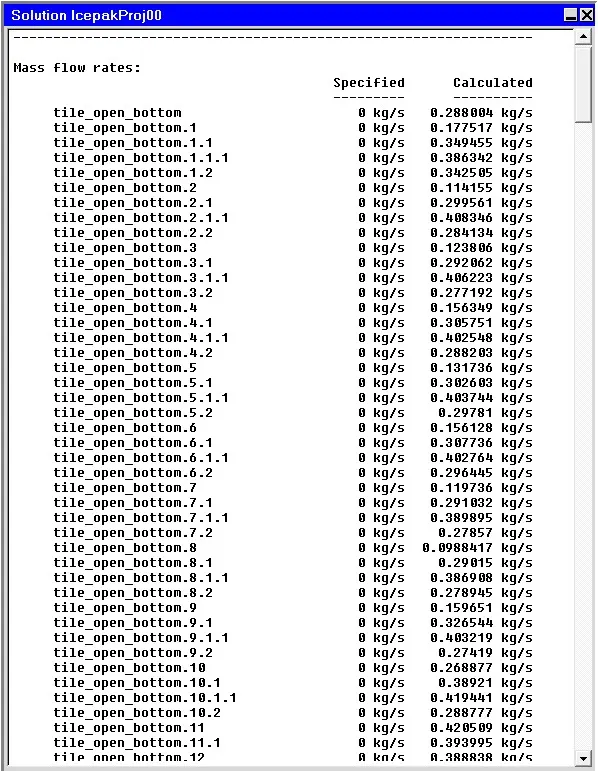
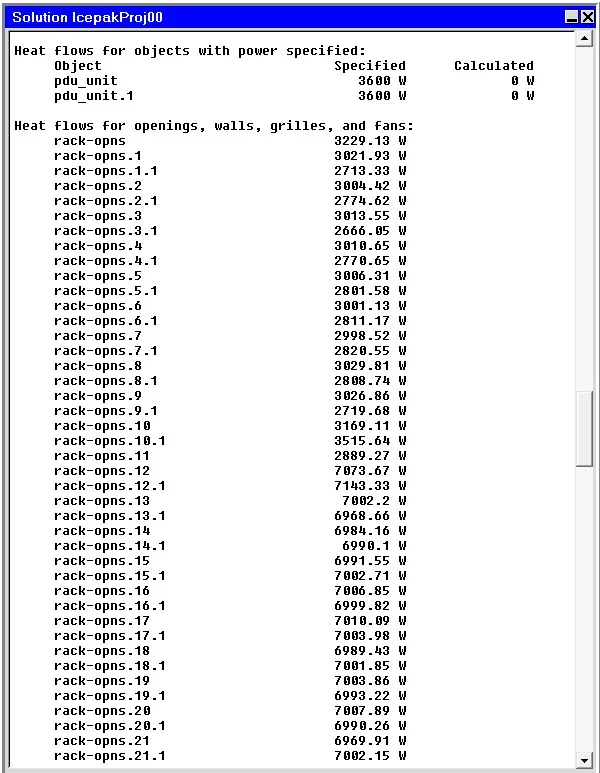
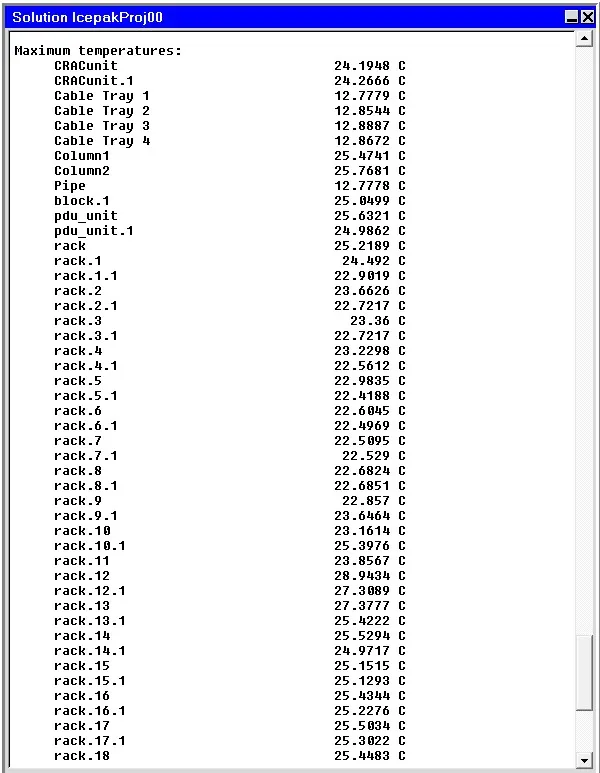
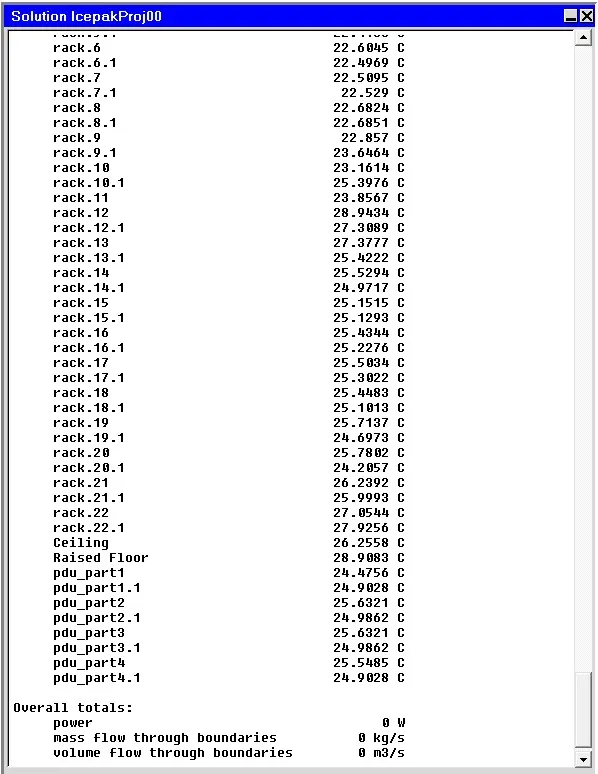
The Following are the summary report of results of the simulation, -
CONCLUSION :
We have successfully performed the Thermal analysis of the Datacenter cooling system.
The solver was set up using suitable settings to incorporate the physical phenomena.
We were able to generate required contours for temperature, speed, Streamline/particle traces, etc.
The following conclusions can be drawn based on the simulation results after running upto 600 iterations :
- We can see the temperatures attained are realistic and all the residuals are less than 10e-3.
- The maximum velocity circulated and calculated as 23.26 m/s.
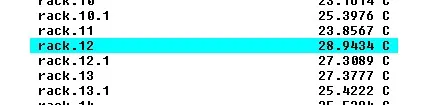
- Maximum temperature within the datacenter was 28.94 Deg.C at Rack 12(in geometry).
For further, inorder to check accuracy we can run simulation version by setting solver with 2nd order discretization option.
REFERENCE :
https://www.techtarget.com/searchdatacenter/definition/computer-room-air-conditioning-unit