Week 11 - Simulation of Flow through a pipe in OpenFoam
AIM : Simulation of Flow through a Pipe (Hagen–Poiseuille Flow) in OpenFoam
OBJECTIVE :
- Write a program in Matlab that can generate the computational mesh automatically for any wedge angle.
- Select appropriate dimensions and condition for the problem
- Post process velocity profile, Pressure Drop and shear stress.
- Show that the velocity profile is fully developed.
- Compare velocity profile calculated by numerical method with the velocity profile calculated with Hagen-poiseuille equation.
THEORY :
Hagen–Poiseuille Flow, is basically a fully-developed laminar flow in a pipe or duct . The mathematical model relationships for Pouiseuille flow relating the flow rate and/or velocity profile to the pressure drop along the pipe/duct, fluid viscosity and geometry are sometimes referred to as Poiseuille’s law (although strictly not a “law” of mechanics). The velocity profile of all Poiseuille flows is parabolic, and the rate of axial pressure drop is constant.
In the Laminar fluid flow inside a pipe, the surface contact between the water and the wall of the pipe will cause the water molecules to slow down and come to a complete stop near the walls. This layer of water molecules will also cause the adjacent layer of water flow to slow down due to the result of friction. To compensate for this velocity, water drops in the core of the pipe needs to maintain a constant velocity to keep the volumetric flow rate constant. As a result, the velocity boundary layer develops along the boundary walls of the pipe and starts to develop in the flow direction until it hits the center of the pipe. The distance from the pipe inlet to the point where the boundary layer merges is called the Hydrodynamic Entry Length. The region beyond the hydrodynamic entry length is known as the Fully Developed Region.
The assumption of the equation are
- The fluid is incompressible and Newtonian, which means, the viscosity property of fluid follows Newton’s law of viscosity, that is, `tau=mu(partialu)/(partialy)`
- There is no relative motion between fluid particles and solid boundaries, that is no slip of fluid at the solid boundary.
- The flow is laminar through a pipe of constant circular cross section that is substantially longer than its diameter
- There is no acceleration of fluid in the pipe.
Poiseuille’s Equation describes the pressure drop due to the viscosity of the fluid.
`triangleP=(8muLQ)/(pir^4)=(8pimuLQ)/(A^2)`
Where
ΔP">ΔPΔP is the pressure difference between the two ends
L is the length of pipe
μ">μμ is the dynamic viscosity
Q is the volumetric flow rate
R is the pipe radius
A is the cross section of pipe
There are some limitation for Hagen-Poiseuille’s equations
- The equation dose not hold close to the pipe entrance.
- The equation fails in the limit of low viscosity, wide and/or short pipe. Low viscosity or a wide pipe may result in turbulent flow, making it necessary to use more complex models, such as the Darcy-Weisbach equation.
As fluid moves downstream from the entrance to a channel, its speed distribution or velocity profile changes in shape until it becomes fully developed. The length of an arrow indicates the magnitude of the flow velocity at the location of the arrow.
The Hagen-Poiseuille equation is valid only for the condition of fully developed flow, where the parabolic velocity profile is no longer changing with distance along the cylinder. As shown in above figure. For some distance downstream of the entrance to the cylinder, the velocity profile will be changing with distance. The entrance length usually is defined as the distance from the entrance to the location where the velocity at the center of the fully developed flow downstream. The entrance length, L_E may be estimated easily as
LE=0.058Red,">LE=0.058Re
Where,
Re">Re is the reynolds Number.
Le is the entrance length.
Le=0.058*Re*D
`Runderset(e)()=(rhoDV)/mu`
Where,
D is the internal diameter of the cylinder(m)
ρ">ρρ is density of the fluid (kg/m3">m3m3)
V is the average velocity of the fluid inside the cylinder(m/s)
Therefore, the entrance length will increase with flow rate
Problem statement
For flow in pipe of diameter D, experimental observations shows that for “fully developed” flow, laminar flow occurs when ReD">ReD < 2300. Therefore, let us, consider Re for flow is 2000. Assume diameter of pipe (D)=0.02m and length (L) = 2.5 m. also consider working fluid as water at temperature 25oC so the values of density (ρ">ρ)=997kg/m3">m3m3 and Dynamic Viscosity (μ">μ)=8.90X10⁻⁴Pa.sec.
Pre-processing
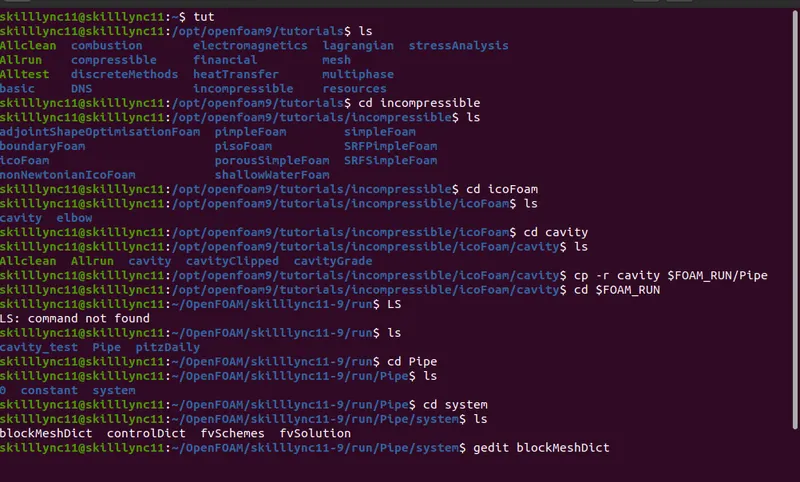
In order to start the simulation process, First start terminal in Linux Operating system using ctrl+alt+T buttons on key board or right click -> Open Terminal. After starting terminal you will see following window.
And enter following commands to copy the 'cavity' scheme and run the icoFoam simulation.
MATLAB CODE FOR WRITING BLOCKMESHDICT FILE.
But, this time, we are going to create blockMeshDict file using Matlab coding by file parsing techniques. Prior, lest define all the given data first in our main program
Condition of working fluid according to problem statement.
Reynolds number (Re">Re) = 2000
Diameter of the pipe (D) = 0.02m
Length of the pipe (L) = 2.5m
Density of working fluid (ρ">ρ) = 997 kg/m3">m3m3
Dynamic viscosity of working fluid (μ">μ) = 8.9X10^-4 Pa.sec
clear all
close all
clc

% Input parameters
    % Reynold's Number
    Re = 2000;
    % Total Length of pipe(m)
    L = 2.5;
    % Diameter of pipe in meters
    D = 0.02;
    % Wedge Angle in degrees
    theta = input(' Wedge/Sector Angle (in degrees) - ');
    % Density (kg/m^3)
    rho = 997;
    % Dynamic Viscosity (Pa.sec)
    mu = 8.90e-4;
    % Radius of pipe(m)
    R = D/2;


% Entrance Length
Le = 0.058*Re*D;

% Number of cells in x,y,z Directions
nx = 500;
ny = 30;
nz = 1;

%------------------------------------------------------------------------
%        BlockMeshDict file writting
%------------------------------------------------------------------------

f1 = fopen('blockMeshDict','w');

    fprintf(f1,'%s \n','/*--------------------------------*- C++ -*----------------------------------*');
    fprintf(f1,'%s \n','  =========                 |');
    fprintf(f1,'%s \n','        /  F ield         | OpenFOAM: The Open Source CFD Toolbox');
    fprintf(f1,'%s \n','       /   O peration     | Website:  https://openfoam.org');
    fprintf(f1,'%s \n','      /    A nd           | Version:  9');
    fprintf(f1,'%s \n','     /     M anipulation  |');
    fprintf(f1,'%s \n','*---------------------------------------------------------------------------*/');
    fprintf(f1,'FoamFile \n');
    fprintf(f1,'{ \n');
    fprintf(f1,'    format      ascii;\n');
    fprintf(f1,'    class       dictionary;\n');
    fprintf(f1,'    object      blockMeshDict;\n');
    fprintf(f1,'} \n');
    fprintf(f1,'%s \n\n','// * * * * * * * * * * * * * * * * * * * * * * * * * * * * * * * * * * * * * //');
    fprintf(f1,'convertToMeters 1; \n\n');
    fprintf(f1,'vertices\n( \n');
    fprintf(f1, '   /* 0 */ (0 0 0) \n');
    fprintf(f1,('   /* 1 */ (0 %f %f) \n'),R*cosd(theta/2),R*sind(theta/2));
    fprintf(f1,('   /* 2 */ (0 %f %f)\n'),R*cosd(theta/2),-R*sind(theta/2));
    fprintf(f1,('   /* 3 */ (%f 0 0)\n'),L);
    fprintf(f1,('   /* 4 */ (%f %f %f)\n'),L,R*cosd(theta/2),R*sind(theta/2));
    fprintf(f1,('   /* 5 */ (%f %f %f)\n);\n\n'),L,R*cosd(theta/2),-R*sind(theta/2));
    fprintf(f1,'blocks\n(\n');
    fprintf(f1,('hex (0 2 1 0 3 5 4 3) (%d %d %d) simpleGrading (0.2 1 1)\n);\n\n'),ny,nz,nx);
    fprintf(f1,'edges\n(\n');
    fprintf(f1,'    arc 2 1 (0 %f 0)\n',R);
    fprintf(f1,'    arc 5 4 (%f %f 0)\n);\n\n',L,R);
    fprintf(f1,'boundary\n(\n');
    fprintf(f1,'     inlet\n');
    fprintf(f1,'     {\n');
    fprintf(f1,'           type patch;\n');
    fprintf(f1,'           faces\n');
    fprintf(f1,'           (\n');
    fprintf(f1,'               (0 1 2 0)\n');
    fprintf(f1,'           );\n');
    fprintf(f1,'     }\n');
    fprintf(f1,'     outlet\n');
    fprintf(f1,'     {\n');
    fprintf(f1,'           type patch;\n');
    fprintf(f1,'           faces\n');
    fprintf(f1,'           (\n');
    fprintf(f1,'               (3 5 4 3)\n');
    fprintf(f1,'           );\n');
    fprintf(f1,'     }\n');
    fprintf(f1,'     front\n');
    fprintf(f1,'     {\n');
    fprintf(f1,'           type wedge;\n');
    fprintf(f1,'           faces\n');
    fprintf(f1,'           (\n');
    fprintf(f1,'               (0 3 4 1)\n');
    fprintf(f1,'           );\n');
    fprintf(f1,'     }\n');
    fprintf(f1,'     back\n');
    fprintf(f1,'     {\n');
    fprintf(f1,'           type wedge;\n');
    fprintf(f1,'           faces \n');
    fprintf(f1,'           (\n');
    fprintf(f1,'               (0 2 5 3)\n');
    fprintf(f1,'           );\n');
    fprintf(f1,'     }\n');
    fprintf(f1,'     pipewall\n');
    fprintf(f1,'     {\n');
    fprintf(f1,'           type wall;\n');
    fprintf(f1,'           faces\n');
    fprintf(f1,'           (\n');
    fprintf(f1,'               (1 4 5 2)\n');
    fprintf(f1,'           );\n');
    fprintf(f1,'     }\n');
    fprintf(f1,'     axis\n');
    fprintf(f1,'     {\n');
    fprintf(f1,'           type empty;\n');
    fprintf(f1,'           faces\n');
    fprintf(f1,'           (\n');
    fprintf(f1,'               (0 3 3 0)\n');
    fprintf(f1,'           );\n');
    fprintf(f1,'      }\n');
    fprintf(f1,');\n\n');
    fprintf(f1,'mergePatchPairs\n');
    fprintf(f1,'(\n');
    fprintf(f1,');\n\n');
    fprintf(f1,'// ************************************************************************* // \n');

fclose(f1);
Written BlockMeshDict file as Output
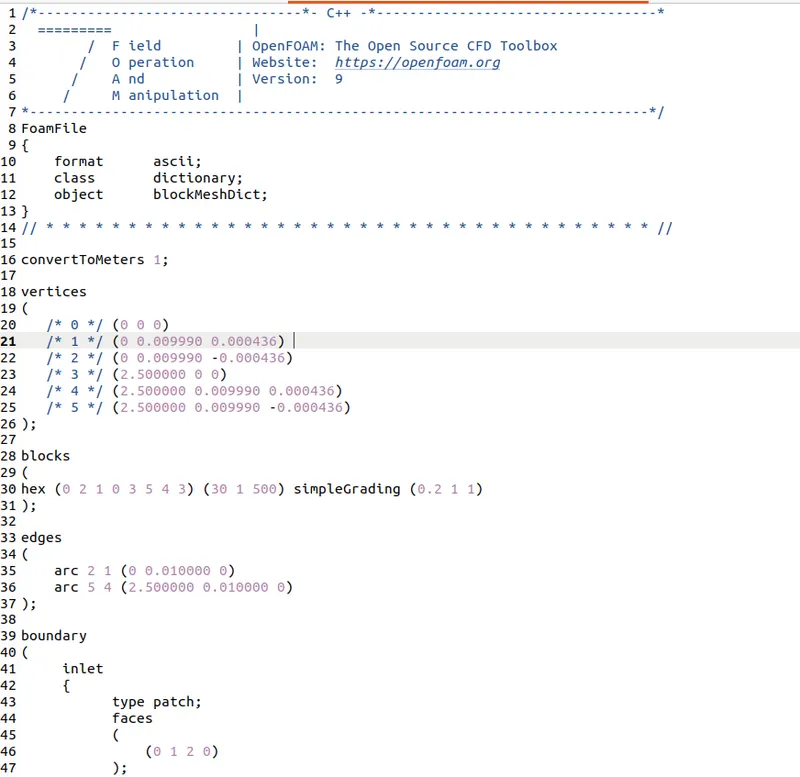
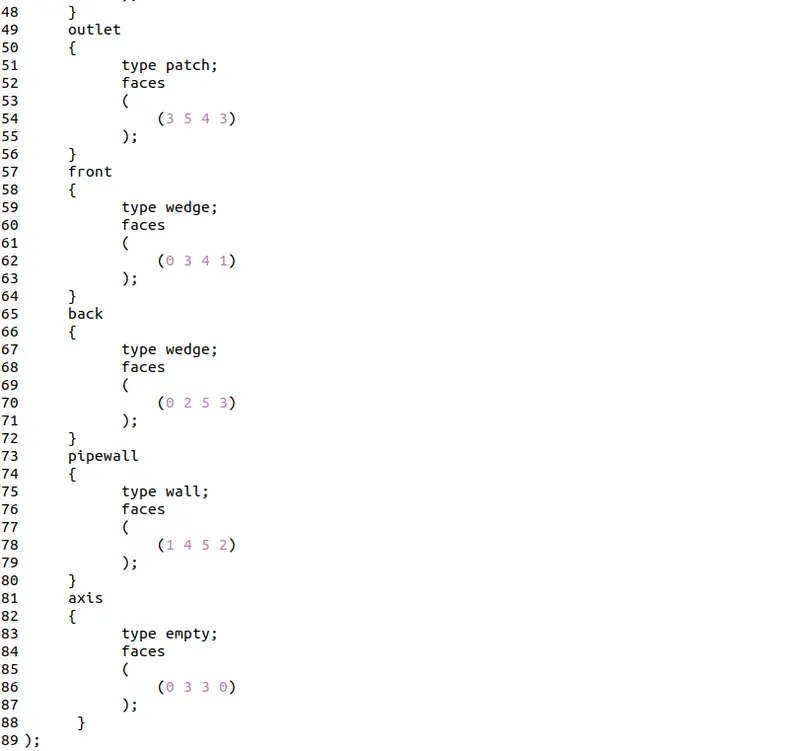
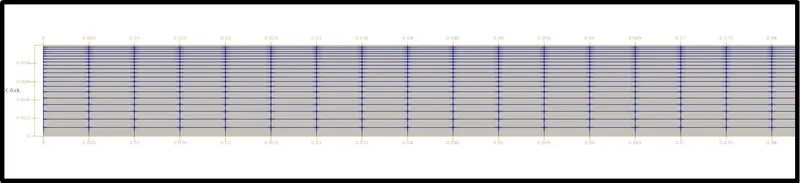
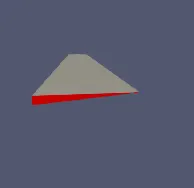
Copy above blockMeshDict file and replace it in the system directory of the pipe folder and by running this block mesh file we will get following mesh:
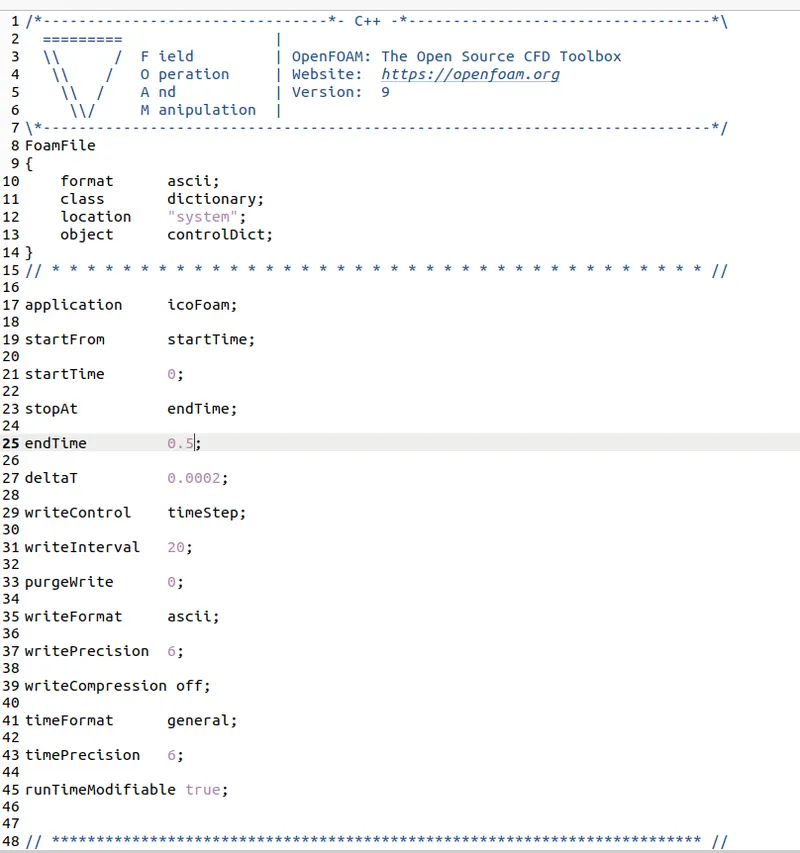
Furthermore, we are going to edit ‘controlDict’ file to provides time limits - start time and end time. Also to represent deltat. While selection of deltat CFL value shoud be less than 1. otherwise, the solution could stopped forcibly or it may diverge at the time of converging. So make following changes in ‘controlDict’ file.
ControlDict File
Boundary and initial conditions
Then, we have to define initial value for pressure and velocity. In order to do that, we have to go back in cavity_copy directory using ‘cd ..’ command and select folder named ‘0’, which stand for initial values. In this case initial value for pressure and velocity.
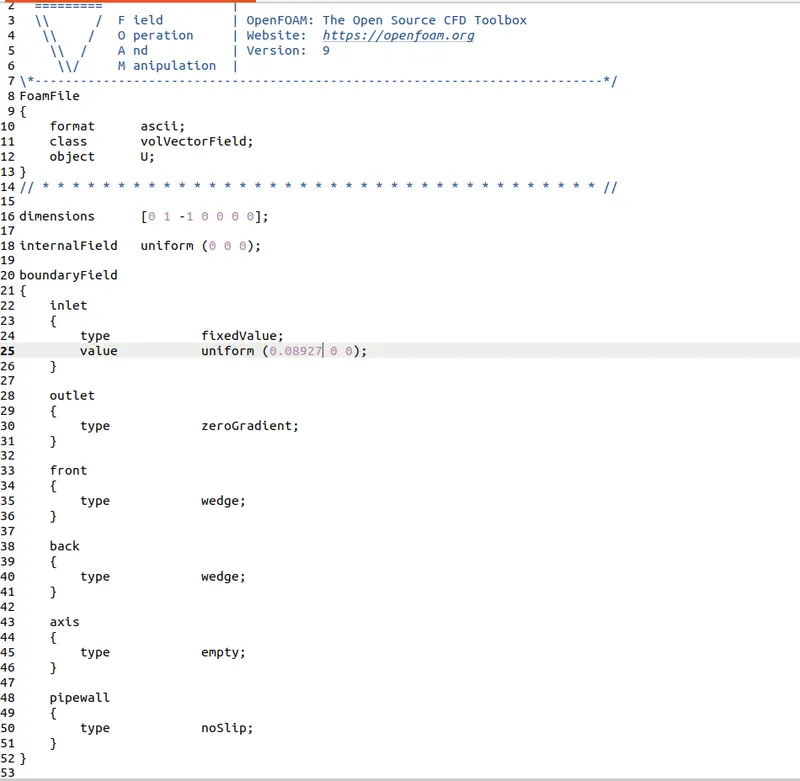
When solving circulating internal flow, the most common boundary conditions are to fix an inlet velocity and an outlet pressure.
Initial setting for pressure
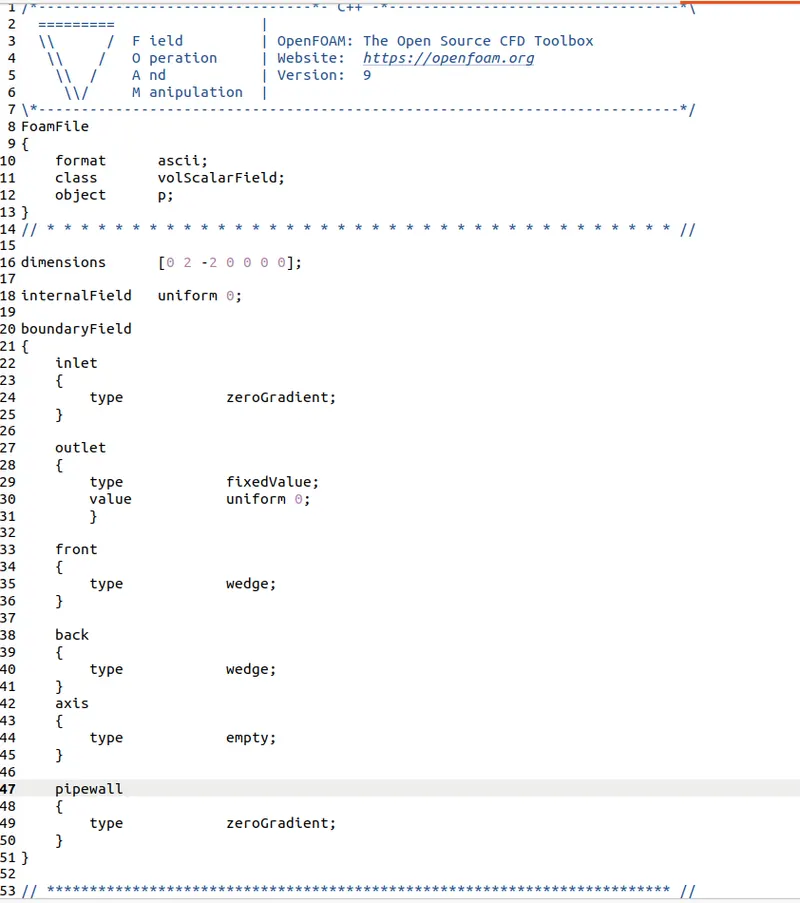
In the U dictionary one can find out a new type of boundary condition: inlet and outlet. It switches U and p between fixedValue and zeroGradient: the first when the flow is in-going and the second when it is outgoing.
Example: in circular pipe case, the outlet velocity will always be adapted to the conditions according to zeroGradient except if there is an inflow at the outlet patch. If this happens, to this inflow velocity it is assigned the value specified under the inletOutlet instruction and so the flow will always be outgoing.
Initial setting for Velocity
Next, we have to apply dynamic viscosity in transportProperty in constant directory of the Pipe.
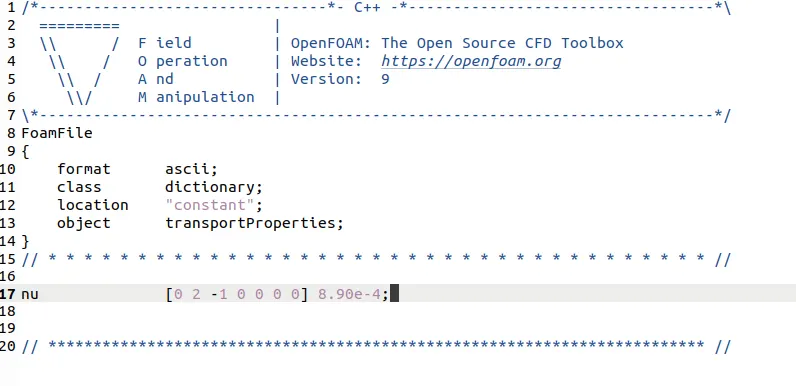
After deploying mesh, now we are ready to run the simulation. Simulation that we selected was icoFoam. Hence, just type ‘icoFoam’ and simulation will start.
Post-processing
Now, let us view the results in paraView by using ‘paraFoam’ command
RESULTS OF THE SIMULATION
The velocity at the inlet of the pipe (non-developed flow)
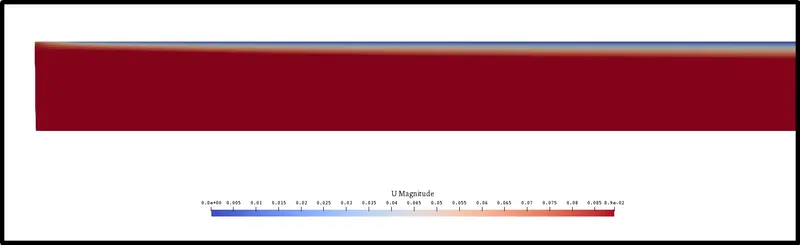
In above figure we can notice that the shear stress along wall surface is starting to increase as fluid moving forward.
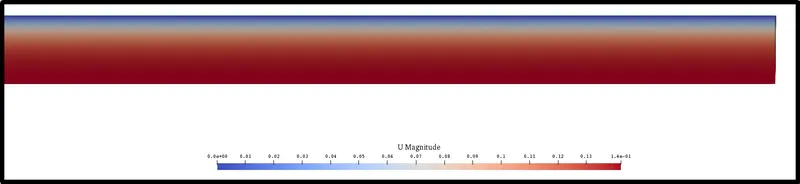
The velocity field at the outlet of the pipe (developed flow)
PRESSURE FIELD ALONG THE PIPE
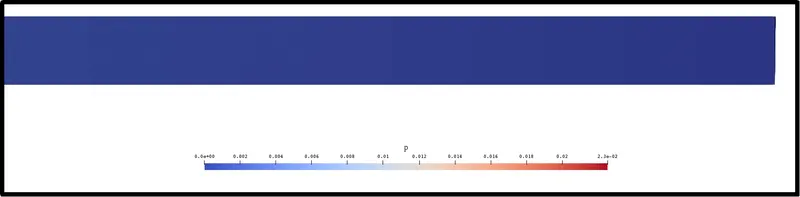
Pressure at inlet of pipe
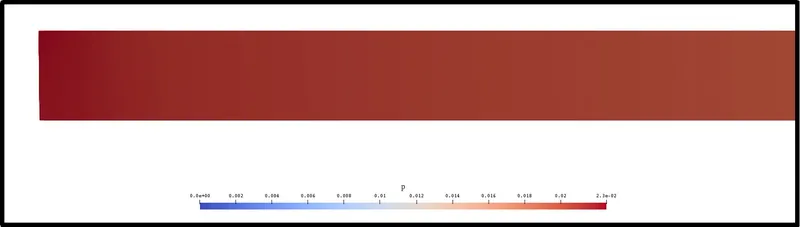
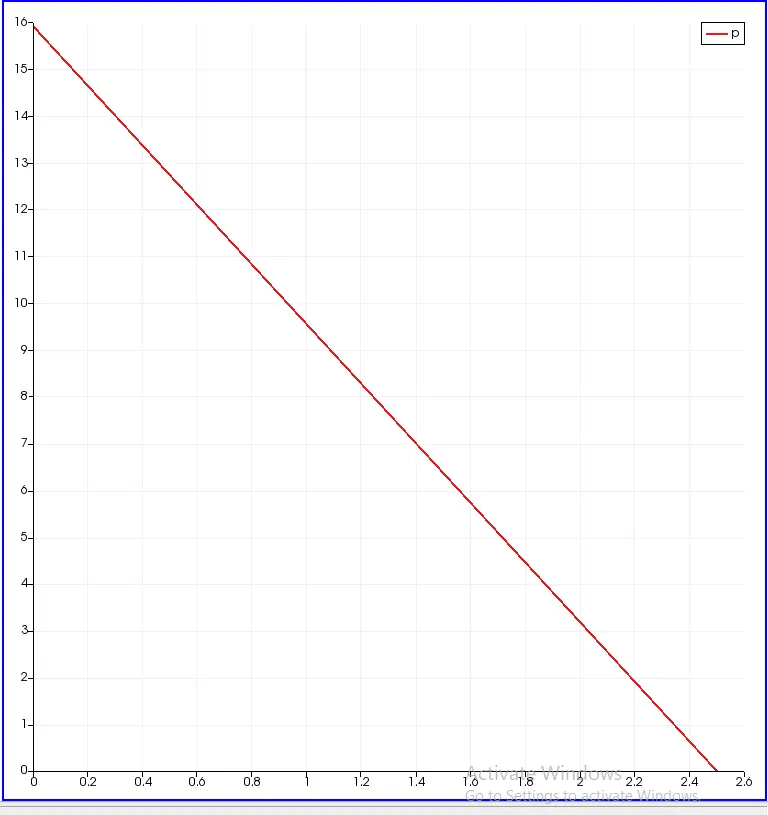
For pressure, we can see, the pressure at the beginning is high and as fluid is moving forward through pipe its decreasing.
Pressure at outlet of the pipe
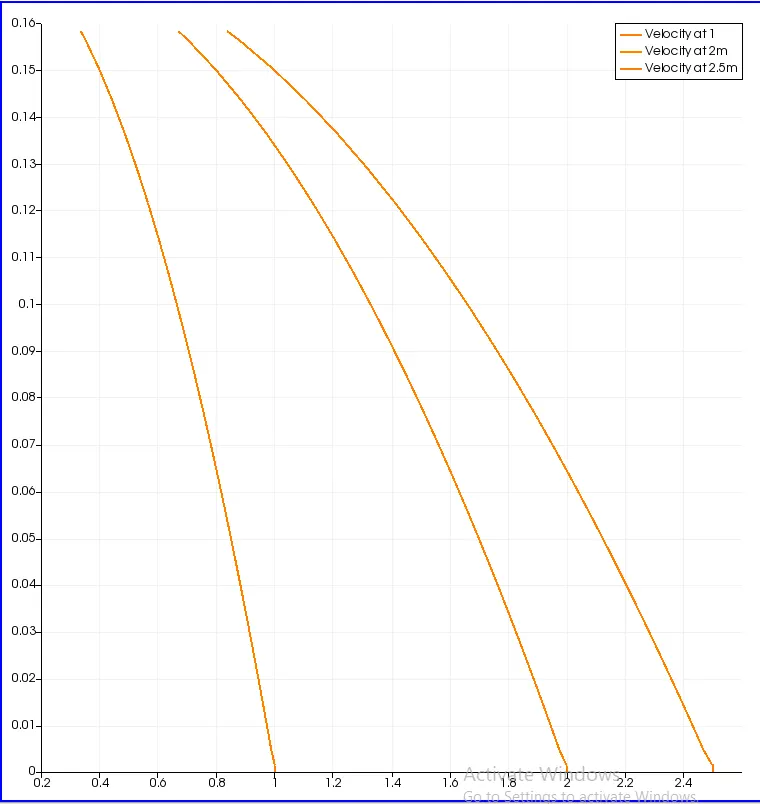
Velocity at various distance from the inlet of pipe and comparison of it with fully developed velocity flow
Pressure change along the length of pipe
Shear stress along the radius at developed region of the pipe
Next, we will calculate shear stress
Plotting shear stress in paraView is not a straight forward task. The reason for this is that there is no direct option to view the shear-stress tensor field inside the domain unlike Pressure and Velocity fields which can be accessed directly at a single click. So by using following techniques we compute the shear stress during the post-processing of simulation in ParaView.
1] Computing the magnitude of the vector field U using the Calculator tool.
By clicking on the calculator tool from extreme left of the common toolbar create the magnitude of velocity “U”.
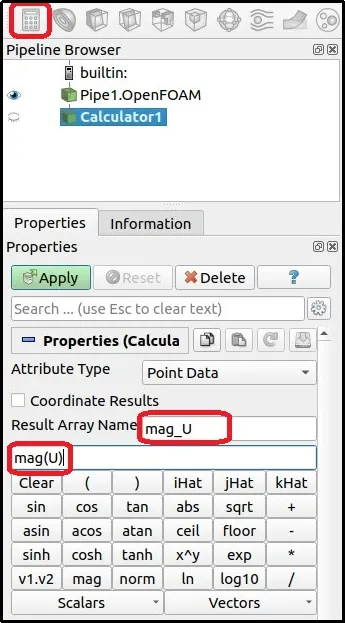
2] Computing the gradients for U-magnitude using
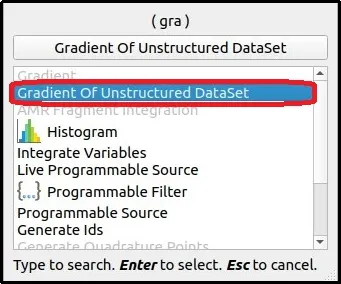
Now, Press ‘Ctrl+space’ or click Filters -> search in paraview. A search widow will pop up for the mentioned filter. Type gradient of Unstructured Data set and select it.
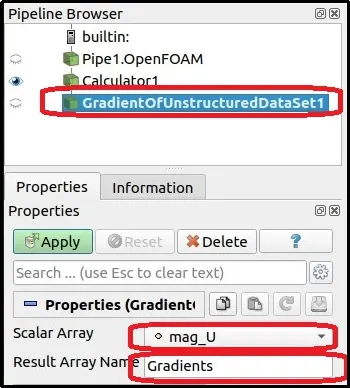
The property window changes as follows. Select scalar array as mag_u i.e. magnitude of velocity and give required result array name and click apply which will give us a gradient of the magnitude of velocit
3] Compute the shear-stress quantity
Shear stress formula is given as
Tau=μdudy">Tau=μ(du/dy)
Where,
μ">μ is Dynamic viscosity
τ">τ is Shear stress = FA">F/A
dudy">du/dy is Rate of shear deformation
Therefore, we can obtain shear stress by multiplying the velocity gradient with the dynamic viscosity of the fluid under study.
So, in this project, we have considered the water as working fluid at 25oC room temperature which dynamic viscosity is 8.90e-4 N/m2">m2.
Then, again click on the Calculator tool and same way create tau array using product of velocity gradient and dynamic viscosity.
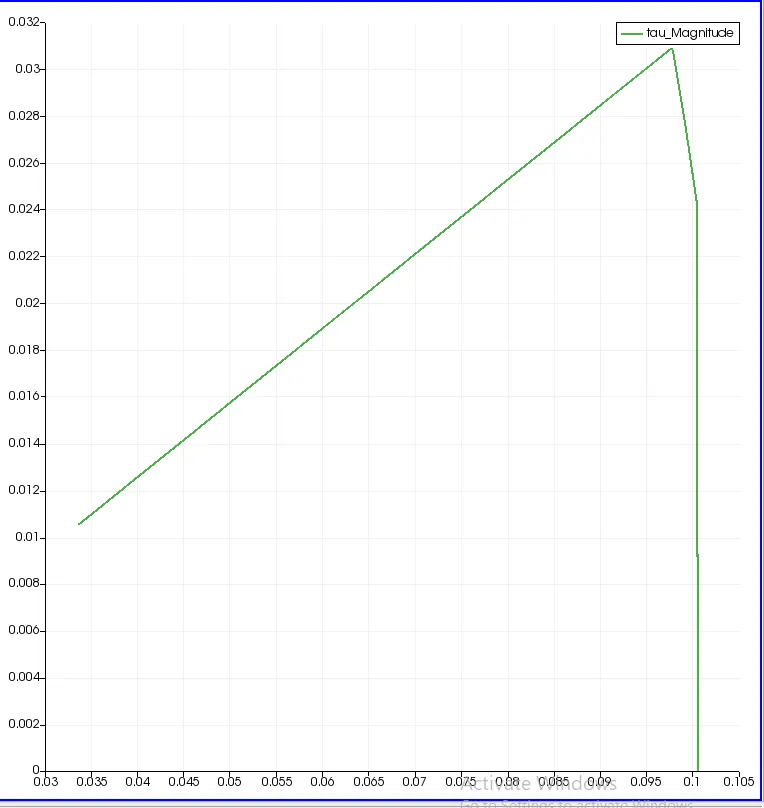
After plotting shear stress we will get following plot as our result.
Shear Stress Plot
Next, plotting above results we can export above data from paraView to read it in matlab
Click on the spread sheet to open spread sheet of all data related to simulation.
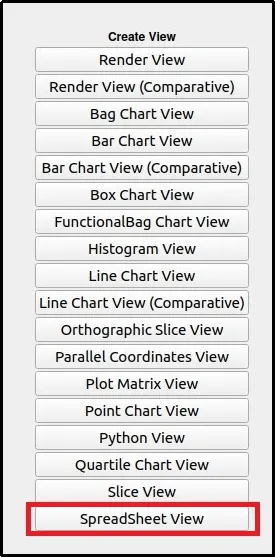
After opening spread sheet it will look like below picture. And by clicking upper right corner export data button we can export our data in .csv format.
Validation of the Analysis by matching the Numerical results with Analytical Values -
Following is the MATLAB Code inorder to read the analysis data from .csv file and comparing with the analytical values -
MATLAB CODE:
clear all
close all
clc

% Input parameters

% Reynold's Number
Re = 2000;

% Total Length of pipe(m)
L = 2.5;

% Diameter of pipe in meters
D = 0.02;

% Wedge Angle in degrees
theta = input('  Wedge Angle in degrees - ');

% Density (kg/m^3)
rho = 997;

% Dynamic Viscosity (Pa.sec)
mu = 8.90e-4;

% Radius of pipe(m)
R = D/2;

% Entrance Length
Le = 0.058*Re*D;

% Average Velcity
Vavg = (Re*mu)/(rho*D);

% Velocity Profile at c/s from center to te wall of the pipe in fully developed region
r = linspace(0,R,1000);
Vr=2*Vavg*(1-(r.^2/R^2));
% Velocity at center
Vmax = 2*Vavg;


% Pressure Drop in across the length of pipe
L_an = linspace(0,L,1000);
P_drop = (32*mu.*L_an.*Vavg)/D^2;
P_drop = fliplr(P_drop);


% Wall Shear Stress
% Darcy Friction Factor
f = 64/Re;
% wall Shear stress
tau_w = (f/4)*((rho*Vavg^2)/2);


%   Retriving OpenFOAM Analysis Data from CSV Files


% Reading Velocity File Extracted from paraView
fv = fopen('Velocity_Profile_And_Pressure.csv','r');
fgetl(fv);
for i = 1:1000
    C = fgetl(fv);
    D = strsplit(C,',');
    Vn(i) = D(1);
    Lr(i) = D(6);
end
Vn = str2double(Vn);
Lr = str2double(Lr);


% Reading Pressure File Extracted from paraView
fp = fopen('Pressure_Drop_Across_The_Pipe.csv','r');
fgetl(fp);
for i = 1:1000
    C = fgetl(fp);
    D = strsplit(C,',');
    Pn(i) = D(1);
    Lp(i) = D(5);
end

Pn = str2double(Pn);
Lp = str2double(Lp);


%--------------------------------------------------------------------------
%   Plotting the comparison
%--------------------------------------------------------------------------

% Velocity comparison from analytical method and numerical method
figure(1)
set(gcf, 'Position',  [100, 200, 800, 600])
plot(r,Vr,'color','r','linewidth',2)
hold on
plot(Lr,Vn,'--','color',[0 0.1 0.8],'linewidth',2)
xlabel(' Location or Radial Dist. from the center to wall of pipe (in m)','fontweight','bold','fontsize',12)
ylabel(' Velocity (in m/s)','fontweight','bold','fontsize',12)
title(' Velocity Profile comparison of analytical and numerical values','fontsize',14)
legend(' Analytical method',' Numerical method')
grid on

% Pressure comparison from analytical method and numerical method
figure(2)
set(gcf, 'Position',  [905, 200, 800, 600])
plot(L_an,P_drop,'color','r','linewidth',2.5)
hold on
plot(Lp,Pn,'--','color',[0 0.1 0.8],'linewidth',1)
xlabel(' Length of pipe (in m)','fontweight','bold','fontsize',12)
ylabel(' Pressure (in Pa)','fontweight','bold','fontsize',12)
title('Pressure Drop Across the Length of pipe','fontsize',14)
legend(' Analytical method',' Numerical method')
grid on


% Error
err_max = max(max(abs(Vr-Vn)));
fprintf(' Max. Error of velocity Profile between Analytical & Numerical Result = %f n',err_max);
RESULT:
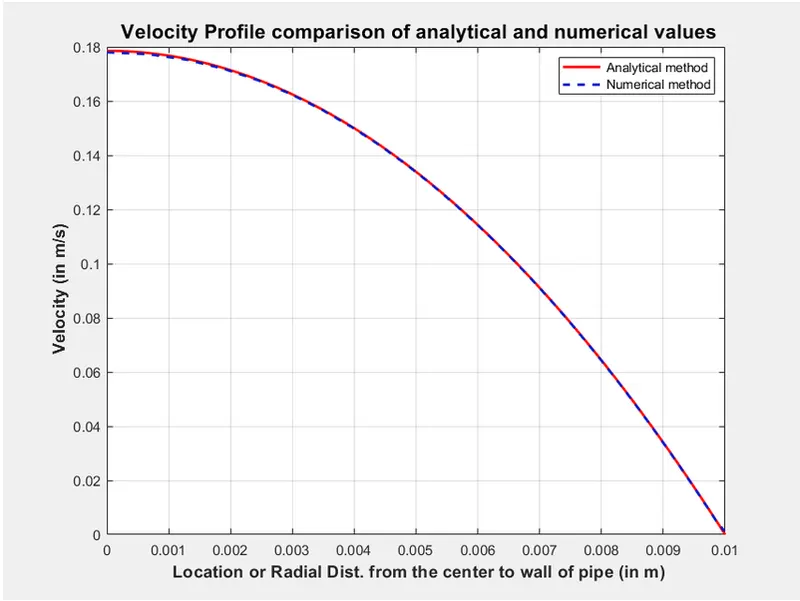
Velocity plot which shows difference in Analytical and Simulated result
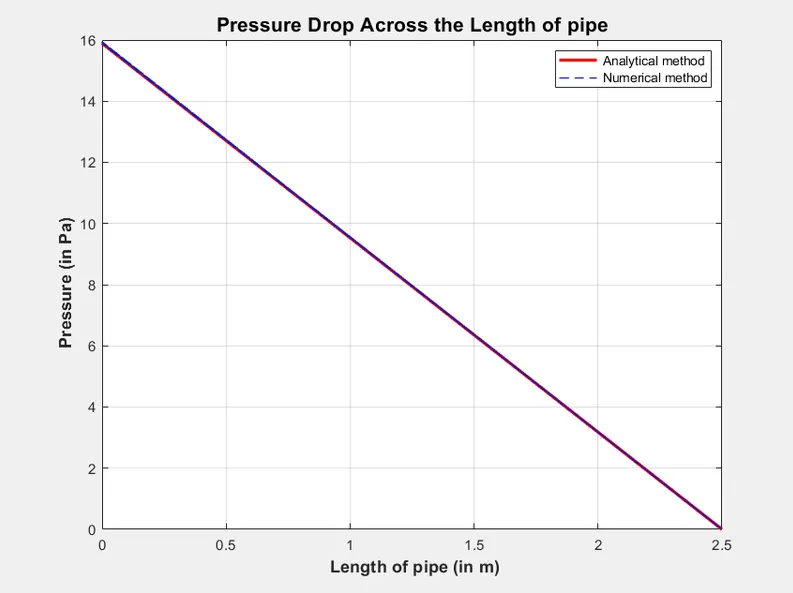
Pressure drop plot which shows difference in Analytical and Simulated result
CONCLUSION :
- We can see above the the Error between analytical values and Numerical simuation values is very small. And satisfies with the pressure drop value calculated with Hagen-Poiseuille Equation.
- Hence, the Simulation of Laminar/Hagen-Poiseuille Flow through pipe is successful and satisfactory.
- Understood the Hagen-Poiseuille equation to calculate our analytical or exact results of laminar viscus flow through pipe.
- Using icoFoam we also calculate same results by Numerical method using finite volume method.
- Finally, results are validated successfully by comparing both analytical and Numerical results