Project 1 - Parsing NASA thermodynamic data
PROGRAM IN MATLAB TO WRITE A FUNCTION THAT EXTRACTS THE 14 COEFFICIENTS AND CALCULATES THE ENTHALPY,ENTROPY, AND SPECIFIC HEATS FOR ALL THE SPECIES IN THE DATA FILE.
AIM: Write a function that extracts the 14 coefficients and calculates the enthalpy, entropy and specific heats for all the species in the given data file.
THEORY:
PARSING: parsing a file means reading in a data stream of some sort and building an in memory model of similar data. This aims at facilitating performing some kind of data transformation on the given data.
EQUATION/FORMULAE required: To calculate the specific heat,enthalpy,entropy of given thermodynamic data the following formulae are required.
SPECIFIC HEAT(Cp): In thermodynamics it is the ratio of the quantity of heat required to raise the temperature of a body by one degree to that of required temperature of an equal mass of water one degree.
`(Cp)/R = a1 + a2*T + a3*T^2 + a4*T^3 + a5*T^4`
Where Cp=Specific heat
ENTHALPY(H): Enthalpy is the sum of internal energy and the product of pressure and volume in the given equation. i.e H=U+PV.
`H/(R)= a1 + a2 *T/2+a3*T^2/(3)+a4*T^3/(4)+a5*T^4/(5)+a6/T`
ENTROPY(S): It is the level of randomness of a system of particles. It could also be determined as the measure of the energy dispersal of the molecules in the given system.
`S/R= a1*lnT + a2*T+a3*T^2/2+a4*T^3/3+a5T^4/4+a7`
By the above three formulae 14 coefficients are substituted from the thermodynamic data file of which the first 7(a1 to a7) are used for high temperatures conditions and the later 7 coefficients(a8 to a14) are used for low temperature conditions. The temperature each species is mentioned in the data file with a minimum and maximum limit and median limit. As per the temperature conditions appropriate coefficients are taken.
OBJECTIVE: To obtain thermodynamic data for given thermodynamic data for various species and coefficients of temperature in the governing equations for entropy,enthalpy and specific heats by a MATLAB code.
MATLAB CODE FOR OBTAINING COEFFICIENTS FOR GIVEN DATA:
close all
clear all
clc

%To open the given THERMO.DAT file
f1 = fopen('THERMO.dat','r')

%To get the first 5 lines in data file
for i=1:5
    fgetl(f1);
end

%Creating a FOR loop to run for 53 lines in given data
for j = 1:53

%Reading of line1
tline1=fgetl(f1);
b = strsplit(tline1,' ');
species=char(b(1));
t = tline1(45:75);
t1= t(5:12);
t1=str2num(t1);
t2 = t( 14:22);
t2=str2num(t2);
t3 = t(24:end);
t3 = str2num(t3);

%Reading of line2
 tline2 = fgetl(f1);
 a=findstr(tline2,'E');
 a1=tline2(1:a(1)+3);
 a1=str2num(a1);
 a2=tline2(a(1)+4:a(2)+3);
 a2=str2num(a2);
 a3=tline2(a(2)+4:a(3)+3);
 a3=str2num(a3);
 a4=tline2(a(3)+4:a(4)+3);
 a4=str2num(a4);
 a5=tline2(a(4)+4:a(5)+3);
 a5=str2num(a5);

 %Reading of line3
 tline3 = fgetl(f1);
 a6=tline3(1:a(1)+3);
 a6=str2num(a6);
 a7=tline3(a(1)+4:a(2)+3);
 a7=str2num(a7);
 a8=tline3(a(2)+4:a(3)+3);
 a8=str2num(a8);
 a9=tline3(a(3)+4:a(4)+3);
 a9=str2num(a9);
 a10=tline3(a(4)+4:a(5)+3);
 a10=str2num(a10);

 %Reading of line4
 tline4 = fgetl(f1);
 a11=tline4(1:a(1)+3);
 a11=str2num(a11);
 a12=tline4(a(1)+4:a(2)+3);
 a12=str2num(a12);
 a13=tline4(a(2)+4:a(3)+3);
 a13=str2num(a13);
 a14=tline4(a(3)+4:a(4)+3);
 a14=str2num(a14);

%Calling the molecular mass function
M= molecular_mass(species);
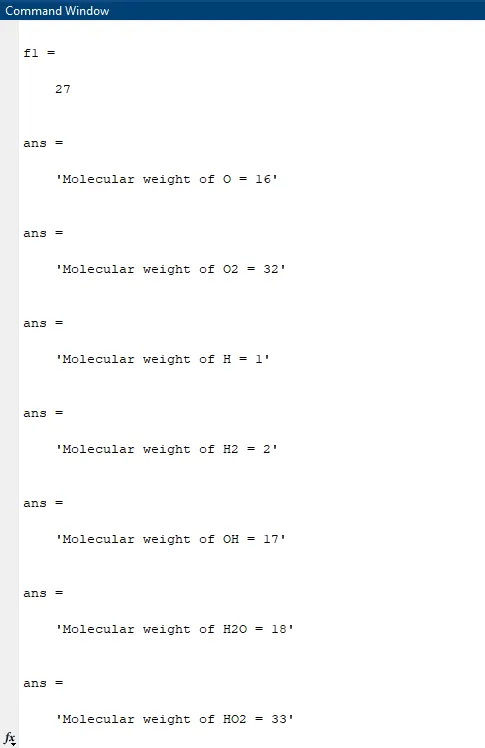
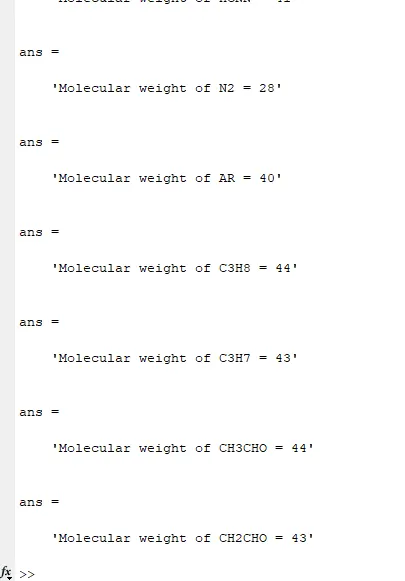
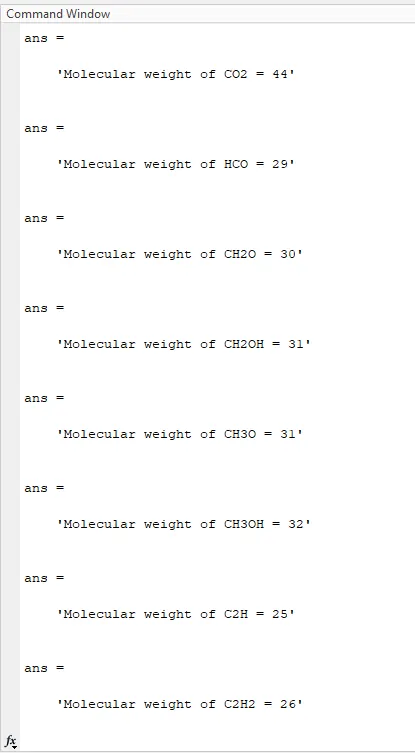
sprintf('Molecular weight of %s = %d',species,M)

 %Defining Temperature limits and R
T = 200:3500;
R = 8.314;

if T>(1000)

Cp = R*(a1+ a2*T+ a3*T.^2 + a4*T.^3 + a5*T.^4);
H = R*(a1+ a2.*(T/2) + a3.*(T.^2/3) + a4*(T.^3/4) + a5*(T.^4/5) + a6/T);
S = R*(a1*log(T) + a2*T + a3*T.^2/2 + a4*T.^3/3 + a5*T.^4/4 + a7)
else
Cp = R*(a8+ a9*T+ a10*T.^2 + a11*T.^3 + a12*T.^4);
H = R*(a8+ (a9.*T)./2 + (a10.*T.^2)./3+ (a11.*T.^3)./4 + (a12.*T.^4)./5 + a13./T);
S = R*(a8.*log(T) + a9.*T + a10.*(T.^2/2) + a11.*(T.^3/3) + a12.*(T.^4/4) + a14);

end

%Creating the directory for saving Species
c=sprintf('%s',species);
mkdir(c);

%Changing directory to store plot images
cd(c)

%Plotting
%Specific Heat vs Temperature
figure(1)
plot(Cp,T,'linewidth',2,'color','r')
title(species)
xlabel('Specific Heat')
ylabel('Temperature')
saveas(gcf, 'Cp.jpg');

%Enthalpy vs Temperature
figure(2)
plot(H,T,'linewidth',2,'color','g')
title(species)
xlabel('Enthalpy')
ylabel('Temperature')
saveas(gcf, 'H.jpg');

%Entropy vs Temperature
figure(3)
plot(S,T,'linewidth',2,'color','b')
title(species)
xlabel('Entropy')
ylabel('Temperature')
saveas(gcf, 'S.jpg');

%Going back to directory file
cd ..;

end
MATLAB CODE FOR CALCULATING MOLECULAR WEIGHT:
%Creating the function
function[M] = molecular_mass(species)

%Specifying the elements and their atomic weights
elements = ['H','C','N','O','A'];
atomic_weight=[1 12 14 16 40];
M=0;

%Creating a FOR loop to compare strings
for k=1:length(species)
    for l=1:length(elements)
        if strcmp(species(k),elements(l))
            M=M+atomic_weight(l);
            u=l;
        end
    end
    n=str2num(species(k));
    if n>1
        M = M+(atomic_weight(u))*(n-1);
    end
end
end
RESULTS:
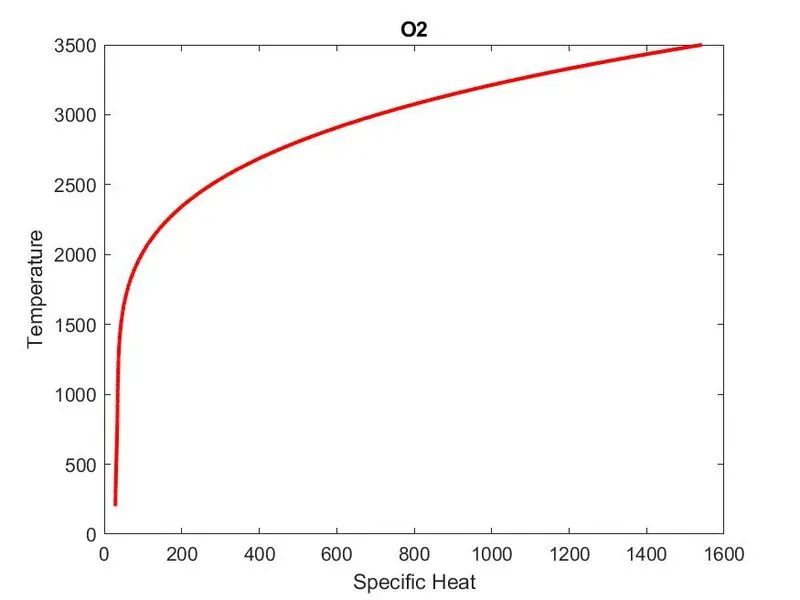
Image of saved plots in specified folder

Images of Molecular weights
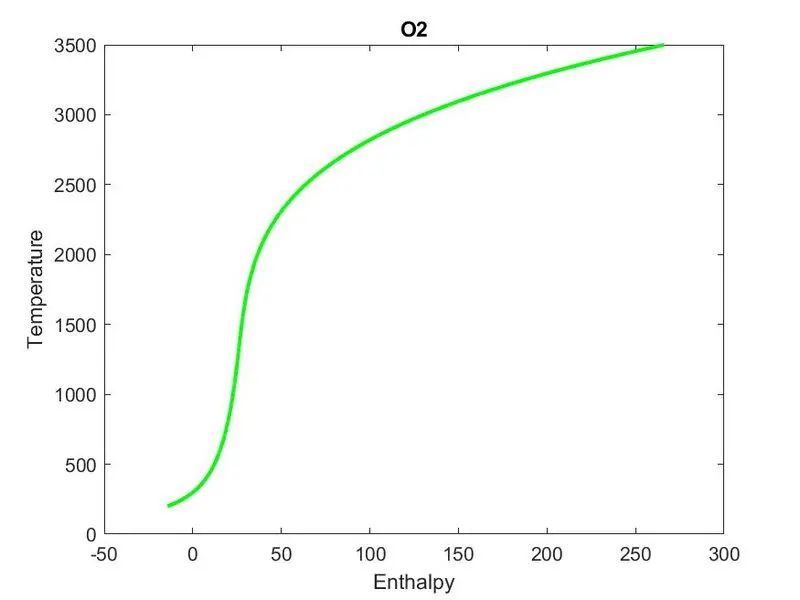
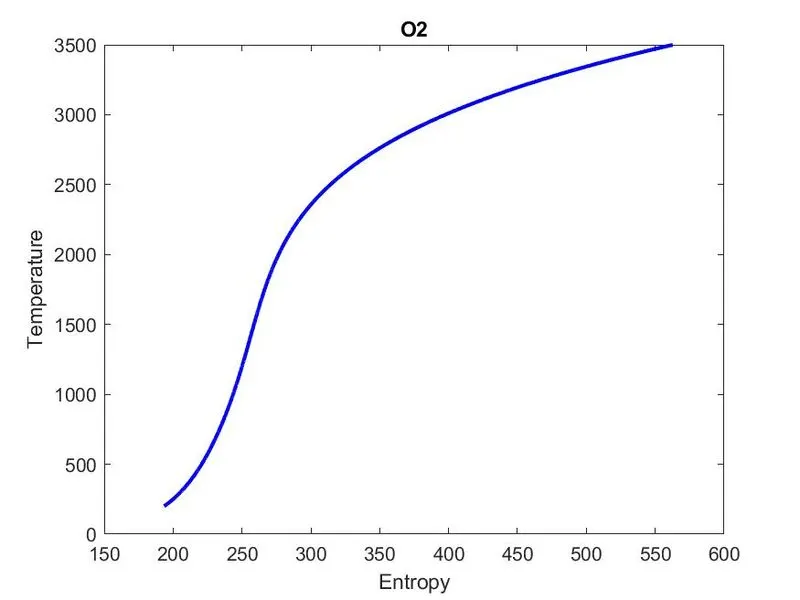
Images of Element O2
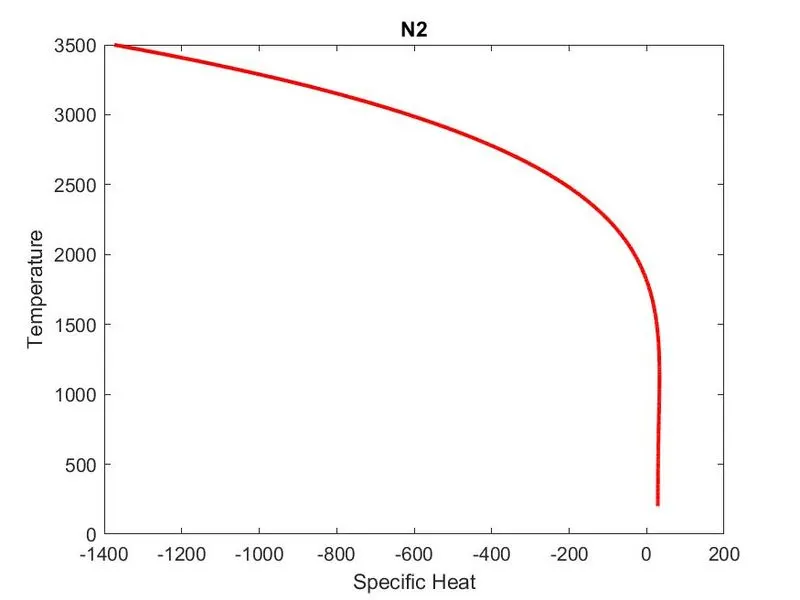
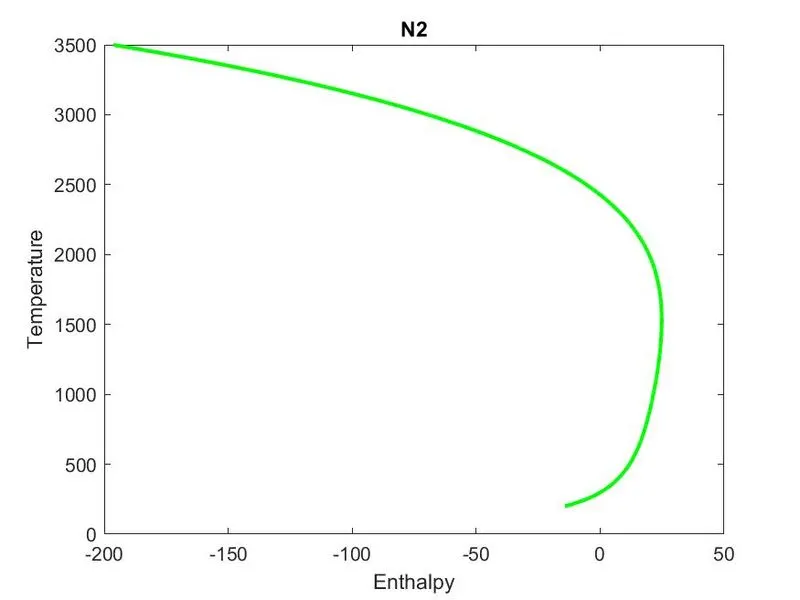
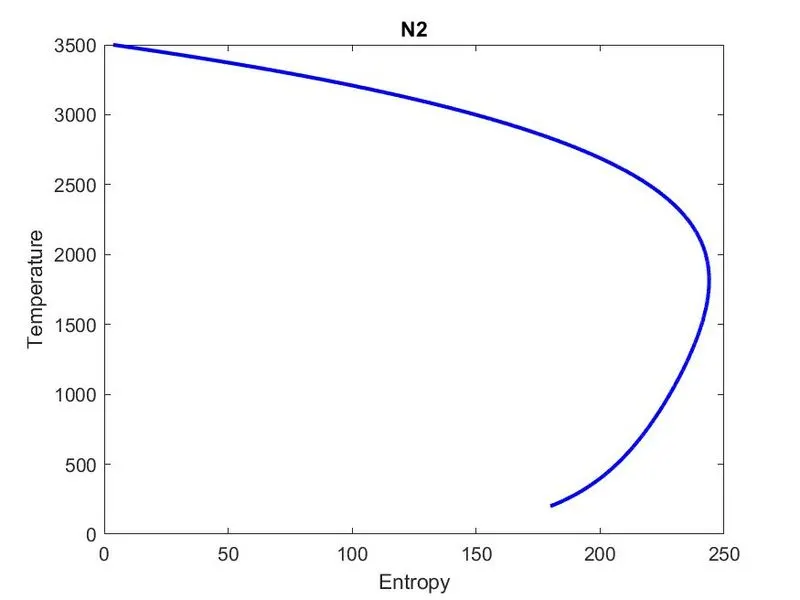
FOR N2
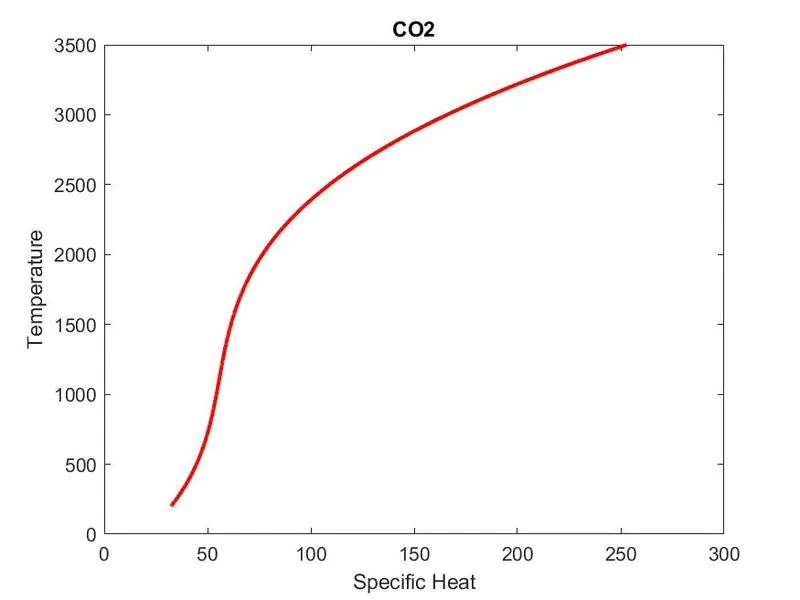
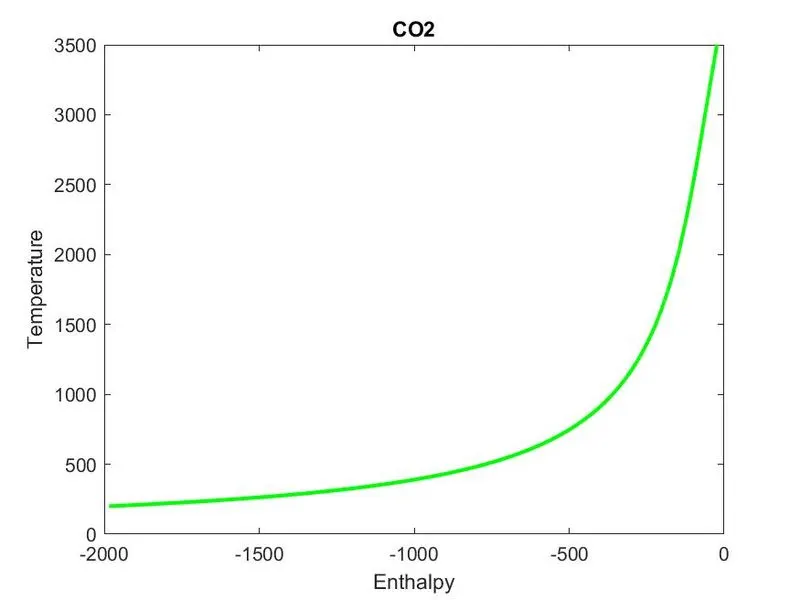
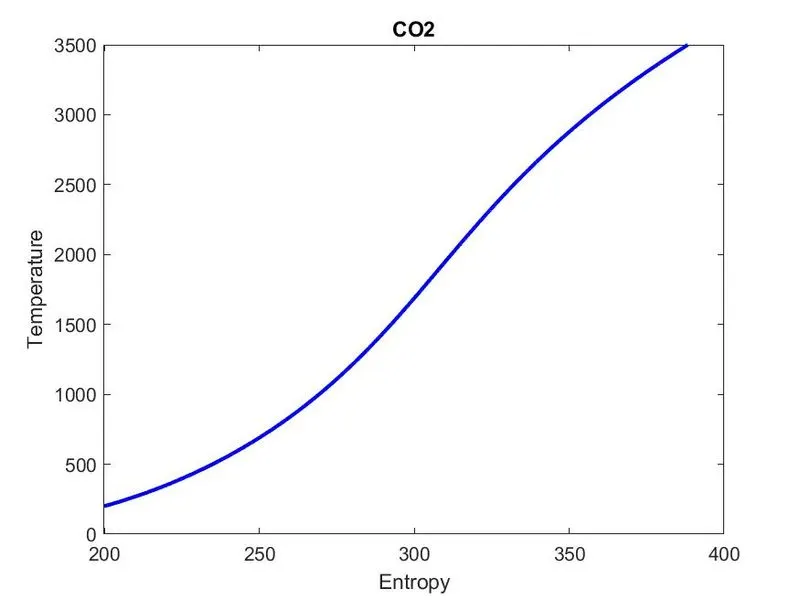
FOR CO2:
CONCLUSION:
1.Thus the plots of elements O2,N2,CO2 for Specific heat, enthalpy,entropy are obtained by the written MATLAB code.
2.The graphs of the elements O2 and CO2 are similar as they require more heat energy as temperature increases. while N2 behaves inversely to required energy as temperature decreases.