Airflow Characterization and Parametric Study Through a Grille
AIM: Airflow Characterization and Parametric Study Through a Louver/Grille.
• Wind tunnel simulation of Hexa-grille to characterize its pressure loss.
• Parametric study to calculate the grille loss coefficient as a function of the free area ratio.
Introduction:
Energy Losses in Ducts - Two kinds of energy losses in duct systems cause the pressure to drop along the flow path. Friction losses occur as the air flows through straight sections, whereas dynamic losses occur as the air flows through such fittings as tees and wyes and through flow control devices.
Energy Losses in Louvre/Grille -
Louvre/Grille pressure drop is one of the key parameters of establishing the louvre requirements for our project as it’s based on the needs of the building and its ventilation system.
Pressure drop is defined as the pressure differential from one side of a louvre to the opposite side, often expressed in Pascals (Pa). Louvre pressure drop occurs when frictional forces, caused by the resistance to flow, act on air moving through a louvre.
Increased louvre pressure drop can prevent equipment inside the ventilated area drawing sufficient air through the louvre, resulting in overheating, as the equipment has to work harder to draw the air through.
The increased pressure drop requires the motor to work harder to draw air through, reducing the amount of air getting through and the element overheats.
The grille loss coefficient is a parameter whose value is a function not just of the free area ratio, but also of other parameters such as grille design, Reynolds number, grille thickness and flow regime (laminar or turbulent). Since most applications are for natural convection in the transitional flow regime it is important to develop a methodology to take into account the appropriate flow regime.
Meshing a complex grille/louvre can be challenging, it could lead to bad quality cells and time consuming too. For a more complicated grille design (chevron, louvres, etc.) a wind tunnel simulation is needed to characterize its pressure loss.
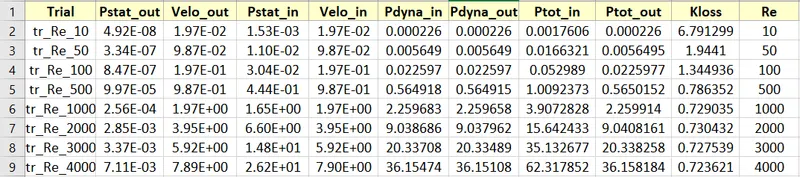
Loss Coefficient = ( P_in - P_out )/ P_dyn
Simulation Setup:
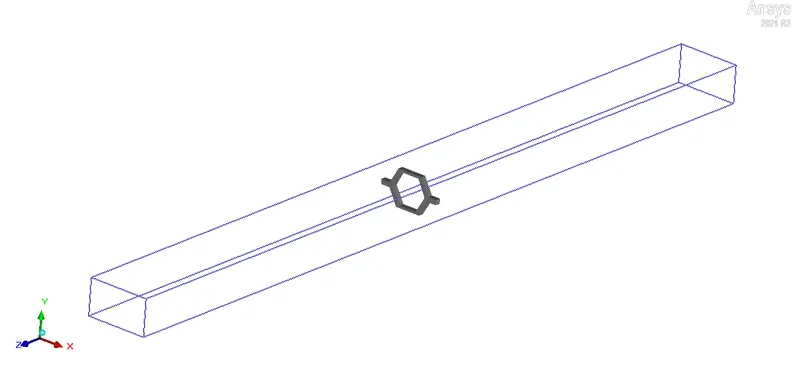
The grille has one full hexagonal hole at the centre and four quarter hexagonal holes placed around it. This pattern was selected because it forms a periodic region and is sufficient to calculate the loss coefficient.
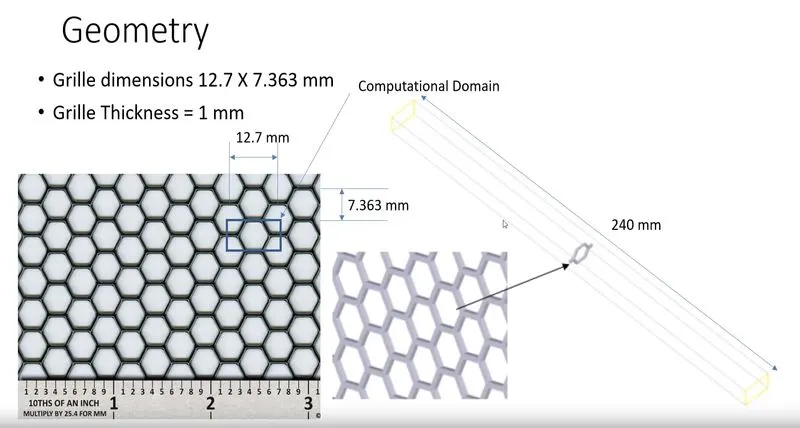
- Create a cabinet/wind-tunnel of length 160 mm with cross-sectional area of 7.363 mm x 12.7 mm.
- Create a half portion of a considered geometry using the polygon option and take a reflection of it.
- Create an opening in the min_z and max_z direction.
- Apply z-velocity boundary condition in the min_z side as a "parametric value".
- $Re*1.84e-5/9.322e-3
- Setup parametric trials by creating a design variable "Re". Put base value as 4000 and discrete values as 10, 50, 100, 500, 1000, 2000, 3000, 4000.
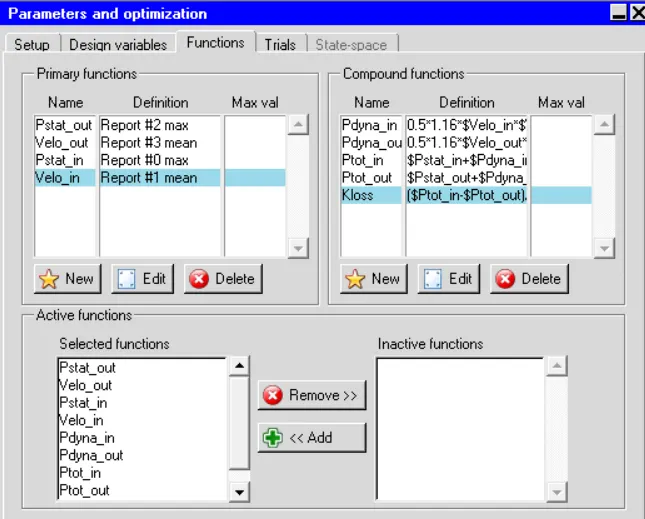
- Create functions to calculate the loss coefficient.
Meshing:
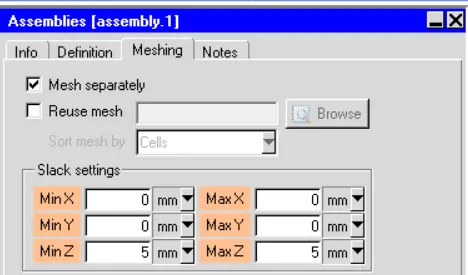
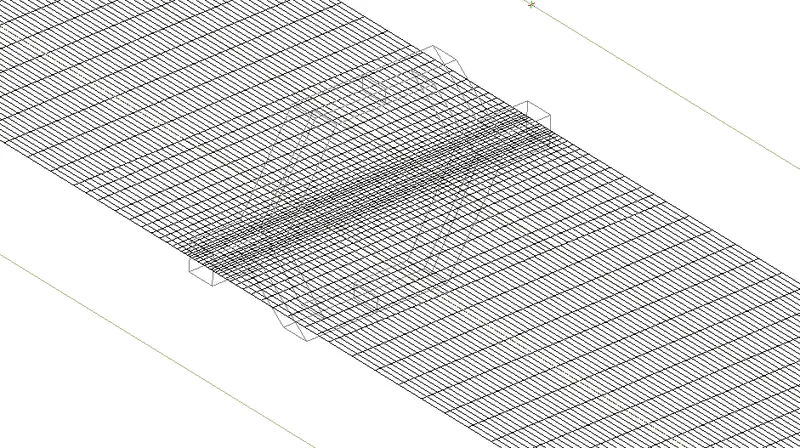
- Create an assembly for the design object and provide slack values.
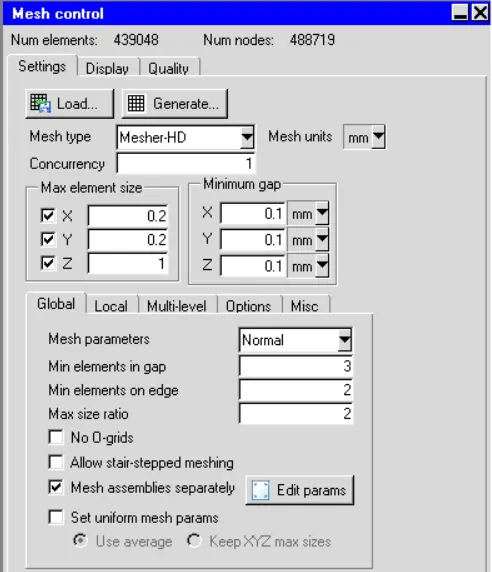
- Global Mesh Settings -
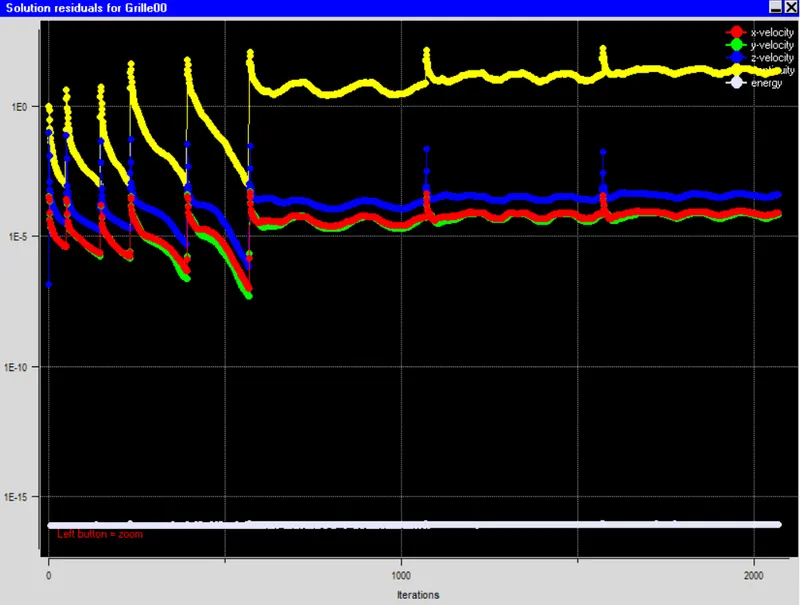
Results:
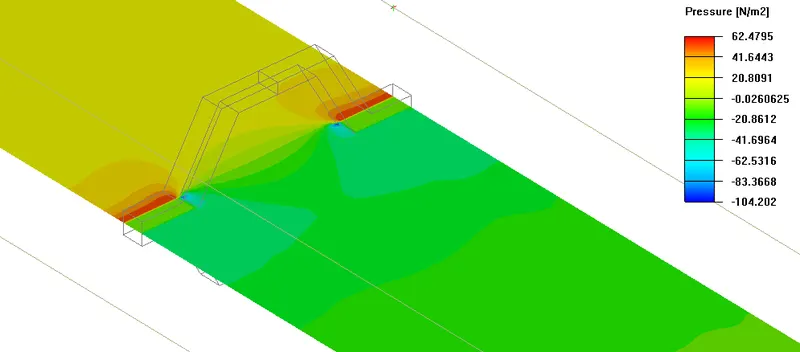
Pressure Contour for Re = 2000
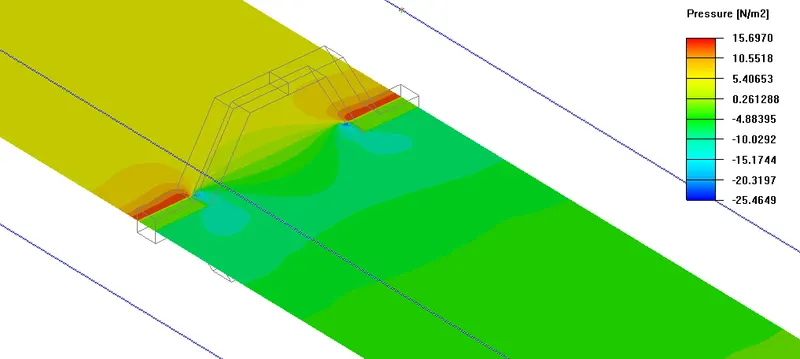
Pressure Contour for Re = 3000
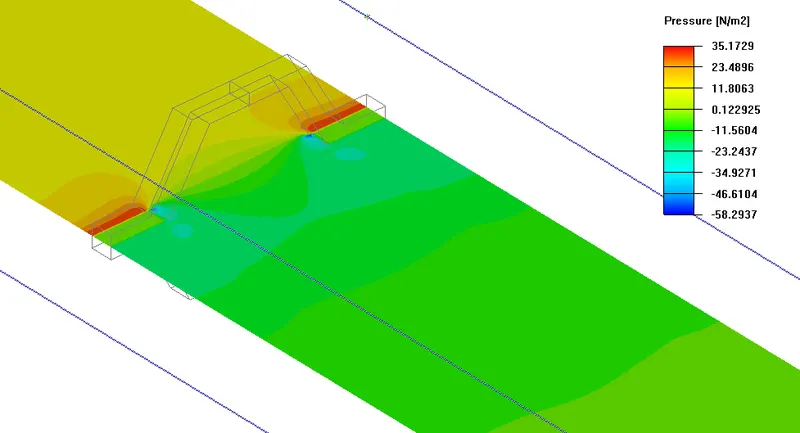
Pressure Contour for Re = 4000
Conclusion:
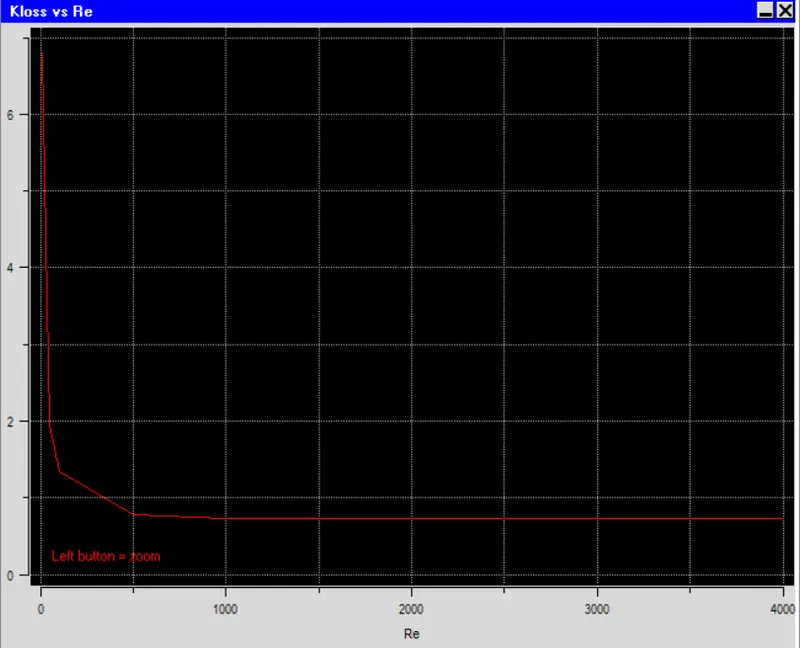
As the Reynolds number is increasing the loss coefficient decreases suddenly and then changes very slightly. We can use this curve directly instead of meshing a geometry by selecting a grille in icepak.