FSAE Car
1. Introduction
Formula SAE (FSAE) is a design competition for students, typically undergraduate and post-graduate engineering students, organised by the Society of Automotive Engineers (SAE) chapter as events at both domestic and international levels (names may be changed) to develop racing vehicles or more specifically Formula-style cars in an attempt to declare winners in different categories including innovation, and cost and manufacturing analysis. A FSAE vehicle can therefore be described as a car which is an open-wheeled and open-cockpit design consisting of a chassis which may be a single, multiple or combination of composite and welded fabricated structures, four wheels and tyres, front and rear wing assemblies, front and rear wheel suspensions, an underbody or floor, and a maximum of total combined 710cc per cycle engine as per the latest guidelines. The hallmark of a good FSAE vehicle design would be that which is able to offer the best combination of minimum drag and maximum downforce which becomes even more important at tight cornering angles and also deciding factors in events such as "Autocross" and "Fuel Economy". A key attribute impacting the values on the drag and downforce components would not only be the shape of the vehicle but also its associated components like the front and rear wings and more importantly its relative position with respect to the car as a whole so as to prevent abrupt flow separation and generation of recirculating regions.
The aim of this challenge was to conduct geometry clean-up, demarcate different boundary zones, create a virtual wind tunnel and perform three-dimensional, transient simulations, on a FSAE car, which in this case is a monocoque vehicle design with a modified engine air intake in the form of an airhorn, similar to a Formula One car, for two different racing configurations including a driver modelled with only its helmet such that it's positioning in the cockpit appears to resemble as though its topmost surface is only slightly shorter than the length of the highest point on the engine intake from the ground. The numerical analysis of the FSAE vehicle involved obtaining a refined mesh based on `y^+` value, boundary layer thickness and required number of embed layers to capture the boundary layer flow properties while also computing results for the pressure drag force and downforce on different components and outlining total cell count. Velocity distribution on a cut-plane and streamlines were created such that the FSAE vehicle was visualised both along a symmetry plane and in isometric view for the identification of flow separation and recirculation regions.
2. Method
The typical approach adopted to performing numerical simulations in CONVERGE CFD involves the following steps:
- Creating a new folder dedicated to running the concerned project inside a user-preferred directory.
- Setting up the relevant case file(s) in Converge Studio v3.0 that involves creation of the fluid volume domain, setting up the required application type, choosing material and its state (in this case, gas) for which simulation is to be performed along with the requisite properties, defining simulation parameters such as solver types, run time variables, and convergence tolerances, defining region(s), boundary conditions and initial conditions, specifying the physical models whose equations are intended to be solved, determining and allocating the base grid size values as well as any other refinements, and lastly selecting the variables for post-processing at the required time intervals along with any hidden parameters or UDF selection as part of advanced parameters.
- Saving the case file(s) and exporting the input files into the folder created for running the concerned project which typically includes 'boundary.in' for the various boundary conditions, 'material_state.dat' where material_state points to either 'gas' (in this case), 'initialize.in' specifying initial conditions, 'inputs.in' defining the various input conditions and file writing intervals, 'turbulence.in' containing information about the turbulence model selected and its associated constants, 'post.in' for the different post-processing variables, 'solver.in' describing the solver chosen and its equations, and 'surface.dat' containing datasets about the surface while other input files with respect to the state of the material, thermal properties and species may also be part of the exporting process and should be ensured that they are selected for the simulation to run.
- Running the simulation in a Cygwin64 terminal window.
- Post-converting 3D output data by navigating to the output folder created within the same project folder during the simulation run or from the 'Post-Processing 3D' button in Converge Studio v3.0.
The simulation run and post-converting processes were executed using Linux-type commands in a Cygwin64 terminal window as shown below:
i) Change directory to the project containing the relevant case file(s):
cd "PATH_TO_CONCERNED_PROJECT_FOLDER"
ii) Confirm the contents of the project for the exported input files:
ls
iii) Performing simulation run with the converge executable application on multiple processors (in this case, 4) using mpiexec executable file in the background (by adding ampersand operator) along with posting output into a logfile:
mpiexec.exe -n 4 converge.exe restricted </dev/null> logfile &
iv) Checking for simulation status with regards to completion or errors:
tail logfile
v) Post-converting the 3D output data files using the 'post_convert_30_msmpi_64' utility on multiple processors (in this case, 4) using mpiexec executable file from within the output folder of the project containing the exported input files:
cd output
mpiexec.exe -n 4 post_convert_30_msmpi_64
2.1 Modelling
The geometry clean-up operation on the given FSAE vehicle model and construction of the computational domain for simulating air flow movement over it was modelled in Converge Studio v3.0. In order to carry out a geometry clean-up activity, it was important to determine the type and its corresponding number of modelling errors before dealing with them for which a check was performed by clicking on the 'Find' button in the 'Diagnosis' dock which resulted in "Nonmanifold problems" of an initial number of 48. "Nonmanifold problems" indicate that three triangles are being shared by a single edge which on closer inspection revealed that they were extremely thin surfaced triangles and the approach considered was to delete them followed by patching the now open surfaces and/or open edges using the 'Ordered vertex list' and/or 'List of edges' options respectively present as sub-options under 'Patch Options' within the 'Patch' tab of the 'Repair' button functionality to close the open surfaces. Alternatively, in areas where the deleted triangles existed as open surfaces and the region did not exhibit sharp gradients in curvature, the 'Stitch Vertices' option within the 'Stitch tab' of the same 'Repair' button functionality was utilised yielding the same result but without the addition of another triangle. The above steps lead to obtaining a clean model with no more 'Problem Triangles', as was understood from re-running the functionality of the 'Find' button in the 'Diagnosis' dock, and at this point, triangle(s) could be assigned to discrete boundaries pertaining to the FSAE vehicle model using the '+' symbol under the 'Flag' tab within the 'Boundary' button functionality from which the pop-out message would read as 'Create a new boundary.' leading to the 'Boundary definition' window to open in which the option 'Create multiple boundaries' was checked with number of boundaries as 11, in this case, followed by lastly grouping the triangles that constitute a given surface and naming them accordingly, such as 'Rear Wing', 'Front Wheels', 'Rear Wheels', 'Front Suspension (R)', 'Front Suspension (L)', 'Rear Suspension (R)', 'Rear Suspension (L)', 'Front Wing (R)', 'Front Wing (L)', 'Underbody', 'Driver' and an already existing boundary titled 'body' which was renamed to 'FSAE Vehicle Body', as illustrated in Fig. 1 with all of the aforementioned boundaries collectively named under the heading 'FSAE Vehicle' for simplification purposes. The boundary flagging process was slightly cumbersome due to the complexity of the FSAE Vehicle model owing to the many intricate features and defeaturing in certain areas and thus, it required the use of different zone identification methods including 'Fence Selection Options' within the 'Fence' tab of the 'Boundary' button functionality to create boundary fences especially in regions of smaller cross-sectional areas and assigning a larger set of triangles to a temporary boundary, typically using the 'By Angle' selection, to separate larger surface areas from the smaller ones. At the end of the boundary flagging process, an assessment was carried out to observe whether any triangles were not allocated by visualising the same from the 'Boundary Visibility' section of the 'View Options' followed by a repeat of diagnosis check to ensure that no problem triangles existed which highlighted about 28 "Isolated Tris" signifying triangles surrounded by neighbouring triangles that have different Boundary ID number(s). The procedure taken to treat these errors was to implement the 'Fix isolated triangles' button functionality, available under the 'Flag' tab within the same 'Boundary' button functionality, with the 'Group size' set to '1' implying that a particular isolated triangle would be assigned the 'boundary ID' of the triangles in its immediate vicinity which in this case turned out to be for the 'Underbody' boundary. Setup of the computational domain (or virtual wind tunnel) with respect to its dimensions was considered to be such that the position of the inlet from the nose cone region of the FSAE Vehicle is sufficiently long, in this case about three times the length of the FSAE Vehicle model, while the outlet from the 'Rear Wing' of the FSAE vehicle is located to be approximately nine times the length of the FSAE Vehicle model away and overall width and height as five times the FSAE vehicle height and width values respectively as illustrated in Fig. 1. This configuration of the computational model ensures a sufficient length for the incoming velocity profile to impose on the FSAE vehicle, negligible interaction of the outflow conditions with the FSAE vehicle wake as well as improved numerical stability and a blockage ratio of nearly 4% (ratio of frontal projected area of the object viz., the FSAE vehicle model, to the cross-sectional area of the domain surrounding the structure i.e., the wind tunnel, in the direction of flow). Identification of the coordinate positions of the computational domain needed specifying a reference plane which in this case was determined by using the 'Front Wheels' and 'Rear Wheels' boundaries distinguished earlier, more specifically the surfaces that make contact with the ground in a real-world scenario because from a domain discretization standpoint and with respect to the current CONVERGE v3.0, these regions cannot be a single point, in this case a vertex, but rather a small and significant flat area in order for a computational mesh to be created. Therefore, the triangles that comprised in the flat regions of each of the 'Front Wheels' and 'Rear Wheels' boundaries were first deleted using the 'Delete Triangle Type' option under the 'Delete' tab within the 'Repair' button functionality with the selection chosen as 'By Angle' method with input value of 5° so as to choose only a limited area belonging to the concerned region followed by determining the z-position of the vertices on the outline of the now cut flat section of any two diametrically opposite previously mentioned boundaries by utilising the 'Average of vertex locations' options under the 'Location' tab within the 'Measure' button functionality. The extents of the computational domain were then identified in terms of the coordinate positions for individual vertices by accessing the 'Vertex' tab when the 'Create' button is clicked on taking reference of the z-position measured previously followed by patching them in terms of their individual boundary surfaces, except for the area that particularly contained the flat surfaces of the 'Front Wheels' and 'Rear Wheels' boundaries, as an 'Ordered vertex list' implying that five out of six total sides of the computational domain were patched. Closing of the bottom patch, or the area representing the lower surfaces of the 'Front Wheels' and 'Rear Wheels' boundaries, required precise selection of few of the vertices on the outline of the flat cut-out section of each of the wheels using the 'Ordered vertex list' option against the end points of the domain along the same plane before closing any open edges using the 'List of edges' item with the 'By Open Edge' option selected that were easy to identify by Converge Studio v3.0. Since, the basic element entity in CONVERGE is denoted by a triangle which would be visible by clicking on any of the surfaces of the recently drawn computational domain and in order to demarcate its boundaries, the corresponding triangles needed to be grouped together, similar to the procedure mentioned previously with only the new number of boundaries this time being four such that they represent the 'Inlet', 'Outlet', 'Ground' and 'Symmetry' surfaces as illustrated in Fig. 1. Moreover, the normal from each of the triangular surface is required to point towards the fluid domain which was ensured by first visualising the same using the 'Normal toggle' button accessible in the 'View Toolbar' and depending on the direction along which the normal is pointing, a decision was taken by clicking on the 'Normal' tab within the 'Transform' button under the 'Geometry' dock and selecting the 'Attempt to fix all normals' option, in this case, followed by clicking on the 'Apply' button. An examination was carried out, yet again, to check for any problem triangles by clicking on the 'Find' button in the 'Diagnosis' dock which at this stage produced no errors and as such the modelling requirements were said to have been achieved with the given computational domain constituting the FSAE vehicle model declared as clean. The above setup is configured for the Race-2 conditions which is a lap of more 'straights', however, to prepare the setup for Race-1 conditions which consists of 'lots of turns', an average value of angle was estimated from the different turn positions, as per the information provided, to be 48.33° which was then entered as the numerical information in the 'Rotation Angle' placeholder when the 'Selected Boundary Entity Type' was enabled within the 'Rotate' tab as part of the 'Transform' button functionality under the 'Geometry' dock followed by choosing the relevant 'Rotation Axis', in this case the 'z-axis', and selecting all the boundaries representing the FSAE vehicle.

(a) Front View (b) Side View
Fig. 1: Fluid Volume Model and Boundary Conditions regions (L, H and W refers to the dimensional attributes of the full-size FSAE Vehicle)
2.2 CFD Simulation Setup, Boundary Conditions, Monitoring Variables, Determination of flow velocity from given Reynolds number and Solution
The simulation on all meshes for the computational domain based on the FSAE vehicle at two different racing conditions was performed using the Reynolds Averaged Navier-Stokes (RANS) models, in this case, the k-`omega` turbulence models. The use of k-`omega` turbulence models, more specifically the Standard k-`omega` model (2006) (SKW2006), is attributed to the fact that the Reynolds number, based on the given flow conditions, lies in the turbulence flow region and that it is suitable for wall-bounded boundary layer, low Reynolds number and complex boundary layer flows that are under the influence of strong adverse pressure gradients and exhibit boundary layer separation. Moreover, the severity on wall distance is not as stringent as compared to SST k-`omega` turbulence model which in regards to the available computational resources allows solution variables, like the velocity profile, to be modelled for the log-law layer, however, using the Automatic wall function approach so as to allow for a certain degree of relaxation to model the same in order to yield satisfactory results based on the grid sizes selected, more of which has been highlighted in Section 2.2.3 Determination of Reynolds number from flow velocity and Mesh Refinement approach. A brief description into the working of the SKW2006 turbulence model is provided below:
2.2.1 SKW2006 turbulence model
The SKW2006 turbulence model developed by Wilcox, 2006 [1] is a two-equation turbulence model solving two transport equations, one being for the turbulent kinetic energy (k) to evaluate the energy in turbulence and the other for the specific turbulent dissipation rate (`omega`) to calculate the rate of dissipation of turbulent kinetic energy (k). Unlike k-`epsilon` turbulence models that make use of damping functions in the viscous sub-layer to compute the appropriate solutions for the boundary layer which tend to be less accurate under the influence of adverse pressure gradients, the SKW2006 turbulence model does not incorporate them and are more than capable of reproducing the expected physical flow features making them more preferred in aerodynamics and turbomachinery applications.
2.2.1.1 Setup of the SKW2006 turbulence model:
To use the SKW2006 turbulence model in Converge Studio v3.0, we navigate to Physical Models option in the Case Setup tree followed by checking the 'Turbulence modeling' box to enable inclusion of turbulence terms in the solution of governing fluid equations and then selecting the Reynolds Averaged Navier-Stokes (RANS) item in the 'Turbulence modeling' window available under the Physical Models option with 'Turbulence model' drop-down menu set to 'Standard k-`omega` 2006' and 'Near Wall treatment' retained at its default selection of 'Automatic wall function' while all other variables/parameters and constants remained unaltered with respect to their original values.
2.2.2 Boundary Conditions and Monitoring Variables
The different boundary conditions for the computational domain based on the FSAE vehicle model is described in the following table:
|
Names |
Inlet |
Ground |
Symmetry |
Outlet |
FSAE Vehicle Body Rear Wing Front Wings (R & L) Rear Suspensions (R & L) Front Suspensions (R & L) Front Wheels/Rear Wheels Underbody/Driver |
|
Type |
INFLOW |
WALL |
-- |
OUTFLOW |
WALL |
|
Pressure Boundary Condition |
Zero normal gradient (NE) |
-- |
-- |
Specified Value (DI) |
-- |
|
Pressure Magnitude (Pa) |
-- |
-- |
-- |
101325 |
-- |
|
Velocity Boundary Condition |
Specified Value (DI) |
-- |
-- |
Zero normal gradient (NE) |
-- |
|
Velocity Magnitude (m/s) |
Race-1 conditions: (u v w) `-=` (12.5 0 0) Race-2 conditions: (u v w) `-=` (20.83 0 0) |
-- |
-- |
-- |
-- |
|
Temperature Boundary Condition |
Specified Value (DI) |
Zero normal gradient (NE) |
-- |
-- |
Zero normal gradient (NE) |
|
Temperature Backflow |
-- |
-- | -- |
Specified Value (DI) |
-- |
|
Temperature Magnitude (K) |
300 |
-- |
-- |
300 |
-- |
|
Species Boundary Condition |
Specified Value (DI) |
-- |
-- |
Specified Value (DI) |
-- |
|
Species Name: `O_2` |
0.23 |
-- |
-- |
0.23 | -- |
|
Species Name: `N_2` |
0.77 |
-- |
-- |
0.77 | -- |
|
Wall motion type |
-- |
Stationary | -- | -- | Stationary |
|
Surface Movement |
-- |
Fixed, Law of wall | -- | -- | Fixed, Law of wall |
|
Turbulent Kinetic Energy (tke) |
Intensity, 0.01 fraction |
Zero normal gradient (NE) |
-- | -- |
Zero normal gradient (NE) |
|
Turbulent Dissipation (eps) |
Race-1 conditions: Length scale, 0.01877m Race-2 conditions: Length scale, 0.02019m |
Wall model | -- | -- | Wall model |
|
Turbulent Kinetic Energy (tke) Backflow |
-- |
-- | -- |
Intensity, 0.01 fraction |
-- |
|
Turbulent Dissipation (eps) Backflow |
-- |
-- | -- |
Race-1 conditions: Length scale, 0.01877m Race-2 conditions: Length scale, 0.02019m |
-- |
|
Near wall treatment |
-- |
Automatic wall function | -- | -- | Automatic wall function |
|
Law of wall roughness parameters; Absolute roughness |
-- |
0.0m | -- | -- | 0.0m |
|
Law of wall roughness parameters; Roughness constant |
-- |
0.5 | -- | -- | 0.5 |
Table 1: Boundary Conditions for the computational domain based on the FSAE vehicle model defined using the 'Boundary' sub-option of the 'Boundary Conditions' under the 'Case Setup' tree
For the given problem, the simulation was chosen as 'Gas simulation' enabled in the 'Materials' option in the 'Case Setup' tree with 'Predefined mixtures' set to 'Air' and 'Species (not in mech.dat)' option enabled to utilise the mass fraction values of `O_2` and `N_2` as they represent the major constituting species in air by mass fraction. Since, 'Gas simulation' option was checked in the 'Materials' option, an equation of state was required to be defined that formulates a coupling relationship between the different state variables such as density and physical conditions such as pressure and temperature to depict the state of matter. In the given numerical analysis, the Redlich-Kwong (RK) cubic equation of state was set to in the 'Equation of state' drop-down menu with its default values of critical temperature (`T_c`) and critical pressure (`p_c`) retained at '133.0 K' and '3770000.0 Pa' respectively as it is a simpler form of representation in comparison to the Redlich-Kwong-Soave and Peng-Robinson set of equations but more accurate than the ideal gas law which works best for gases at low pressures, however, at higher pressures tends to report huge deviations in its predictions as it assumes that the molecular volume is very small and that neither attraction or repulsion exists between the molecules which is not true in the case of real gases. Additionally, the real gas properties would behave as a function of temperature which was again set to as the default option in the 'Gas simulation' window. The values of 'Turbulent Prandtl number' and 'Turbulent Schmidt number' were left unchanged at their default values of 0.9 and 0.78 respectively.
In regards to specifying the turbulence intensity and turbulence length scale values, it was decided to choose a low turbulence intensity value of 1% and length scale of 0.4 times the boundary layer thickness as part of an external flow simulation setup. Additionally, the 'Boundaries only' option was selected under the 'Wall Output' list of the 'Output files' sub-option of the 'Output/Post-Processing' item under the 'Case Setup' tree to visualise the drag and lift forces acting on the FSAE vehicle during the solution process.
2.2.3 Determination of Reynolds number from flow velocity and Mesh Refinement approach
Reynolds number (based on FSAE vehicle model length):
`Re = (U*L*rho)/mu`; where (Eq. 1)
`U` is the freestream velocity,
`L` is the characteristic length, in this case, the FSAE vehicle model length,
`rho` is density of fluid, and
`mu` is the dynamic viscosity of fluid
Substituting the value of characteristic length as FSAE vehicle model length of 2.50421m, and density and dynamic viscosity of air at 1atm or 101235 Pa and 300K (or 26.85°C) as 1.1766 `(kg)/(m^3)` and `1.857*10^-5 (kg)/(m.s)` [2] respectively into (Eq. 1), a corresponding Reynolds number of 1983342.411 and 3305041.794 was estimated for flow velocity of 45km/h (12.5m/s) and 75km/h (20.83m/s) respectively. Boundary layer thickness, in case of turbulent flow, is usually dependent on experiments and/or empirical relations as it difficult to predict the same because of the intense mixing of different layers involved within it. Since, the value of Reynolds number determined suggests that it exceeds the engineering critical Reynolds number of `5*10^(5)` for both flow velocities but is in the transitional regime being relatively closer to the peak point of the transition Reynolds number of `3*10^(6)` for the former (Race-1 conditions) while exceeds it in the case of the latter (Race-2 conditions) such that the boundary layer is deemed to be fully turbulent with respect to smooth flat plate geometrical considerations under uniform upstream conditions, it was decided to evaluate the boundary layer thickness based on turbulent flow conditions for both racing configurations which was determined using the mathematical expression shown below:
`(delta/x) = 0.16/(Re_x)^(1/7)`; where (Eq. 2)
`delta` is the boundary layer thickness, and
`Re_x` is the Reynolds number for the characteristic length i.e., length of the bluff body (L)
For the given Reynolds number and FSAE vehicle model length, the turbulent boundary layer thickness using Eq. 2 is determined to be 0.050485m and 0.04693m for Race-1 and Race-2 conditions respectively. To perform calculations for `y^+` values, the values of wall shear stress and frictional velocity were required to be calculated as shown below:
Wall Shear Stress:
`tau_w=(1/2)⋅C_f⋅rho⋅(U_∞)^2`; where (Eq. 3)
`tau_w` is Wall shear stress,
`C_f` is Skin Friction coefficient,
`U_∞` is the freestream velocity, in this case the calculated value of inlet boundary velocity
Skin Friction Coefficient (`C_f`) based on a semi-empirical expression can be related to the Reynolds number as shown below:
`C_f = 0.027/(Re_x)^(1/7)`, where (Eq. 4)
Frictional velocity (`U_tau`) can be computed mathematically as:
`U_tau=sqrt(tau_w/rho)` (Eq. 5)
For local Reynolds number of 2645924.39 with the previously mentioned values of dynamic viscosity, density and free-stream velocity, the skin-friction coefficient (`C_f`), wall shear stress (`tau_w`) and friction velocity (`U_tau`) values were calculated using (Eq. 4), (Eq. 3) and (Eq. 5) respectively as shown in the following table:
|
Racing Conditions |
Local Reynolds Number |
Skin-friction Coefficient (`C_f`) |
Wall Shear Stress (`tau_w`)[kg m^-1 s^-2] |
Friction Velocity (`U_tau`)[m s^-1] |
|
Race - 1 |
1983342.411 |
`3.402*10^(-3)` |
0.3127 |
0.5155 |
|
Race - 2 |
3305041.794 |
`3.163*10^(-3)` |
0.8074 |
0.8284 |
Table 2: Skin-friction coefficient, wall shear stress and friction velocity values for the governing flow conditions of the computational domain based on the FSAE vehicle model
Calculation of cell-centroid size (`y_P`), First Cell Height (`Delta_y`) and embed scale with respect to Base Grid Size:
`y^+` is defined as the non-dimensional wall distance for a wall bounded flow that can be expressed mathematically as:
`y^+=(ρ*U_tau*y_P)/mu`; where (Eq. 6)
`y_P` is distance from the cell-centroid 'P' to the wall
Simplifying (Eq. 6) to determine `y_P`, we get;
`y_P=(y^+*mu)/(U_tau*rho)` (Eq. 7)
Since, `y^+` is computed at the cell-centroid, the first cell height (`Delta_y`) can accordingly be mathematically expressed as:
`Delta_y = 2*y_P` (Eq. 8)
The approach adopted for evaluating the distance from the cell-centroid 'P' to the wall (`y_P`) and correspondingly the first cell height (`Delta_y`) was to target a `y^+` value such that the first grid cell would lie in the range of 30<`y^+`<300 for the SKW2006 turbulence model as an opportunity to refine the mesh in this range was made possible which would otherwise be difficult due to constraints in computational resources, including limitations in number of mesh cells to 500000, and only 4 cores available on the author's PC wherein a single transient simulation was estimated to take upwards of 4 hours of actual run time, derived from a single run for a coarse mesh. Since, achieving and/or maintaining a particular target `y^+` value from the previously mentioned range throughout the FSAE vehicle was considered to be quite challenging, it was decided that to accommodate for the appropriate relaxation of the log-law assumption by making use of the Automatic wall function.
From the CONVERGE 3.0 Manual [3], the mathematical formulation relating the embed size with the base grid size based on embed scale can be given by:
`embed = (base grid)/(2^(EMBED SCALE))`; where (Eq. 9)
`base grid` is the Base Grid Size defined for every element across the domain,
`EMBED SCALE` is the scaling parameter by which the base grid size is to be refined either at the selected boundary, geometrical shape or region, and
`embed` is the scaled down or refined grid size, in this case also equal to the First Cell Height i.e., `Delta_y`,
The missing variable in (Eq. 9) is `EMBED SCALE` and therefore equating for the same variable was required with regards to the given grid size.
|
Racing Conditions |
Mesh |
dx(m) |
dy(m) |
dz(m) |
|
Race - 1 |
1 |
0.32 |
0.25 |
0.25 |
|
Race - 2 |
1 |
0.32 |
0.25 |
0.25 |
Table 3: Mesh size representing spatial grid discretization values across each of the three-directional axes
|
Mesh |
Entity Type |
Boundary ID |
`EMBED SCALE` |
Embed Layers |
Target First Cell Height (`Delta_y`)[m] |
Target `y^+` (`y_P`) |
Size of Refinement Region |
|
1 |
Boundary |
FSAE Vehicle Body |
5: Race - 1 5: Race - 2 |
7: Race - 1 6: Race - 2 |
0.0078125 - Race 1 0.0078125 - Race 2 |
~127: Race - 1 ~205: Race - 2 |
-- |
| 1 | Boundary | Front Wings |
4: Race - 1 5: Race - 2 |
1: Race - 1 1: Race - 2 |
0.015625 - Race 1 0.0078125 - Race 2 |
~167: Race - 1 ~122: Race - 2 |
-- |
| 1 | Boundary | Rear Wings |
4: Race - 1 5: Race - 2 |
1: Race - 1 2: Race - 2 |
0.015625 - Race 1 0.0078125 - Race 2 |
~142: Race - 1 ~230: Race - 2 |
-- |
| 1 | Boundary | Underbody |
5: Race - 1 5: Race - 2 |
5: Race - 1 5: Race - 2 |
0.0078125 - Race 1 0.0078125 - Race 2 |
~130: Race - 1 ~210: Race - 2 |
-- |
| 1 | Boundary | Front Wheels |
4: Race - 1 4: Race - 2 |
1: Race - 1 1: Race - 2 |
0.015625 - Race 1 0.015625 - Race 2 |
~158: Race - 1 ~232: Race - 2 |
-- |
| 1 | Boundary | Rear Wheels |
4: Race - 1 5: Race - 2 |
1: Race - 1 2: Race - 2 |
0.015625 - Race 1 0.0078125 - Race 2 |
~152: Race - 1 ~235: Race - 2 |
-- |
| 1 | Boundary | Suspensions |
4: Race - 1 4: Race - 2 |
1: Race - 1 1: Race - 2 |
0.015625 - Race 1 0.015625 - Race 2 |
~174: Race - 1 ~256: Race - 2 |
-- |
|
1 |
Box |
-- |
1 |
-- |
0.125 |
-- |
4L*2.5W*2H |
Table 4: `EMBED SCALE`, Embed Layers, Target First Cell Height (`Delta_y`), Target `y^+`(`y_P`) and Size of Refinement Region for the Box Entity Type Fixed Embedding with regards to mesh 1 configuration of the computational domain based on the FSAE vehicle model for two different racing conditions (L, W and H refer to the dimensions of the full size FSAE vehicle to scale)
It should be noted that calculations for empirically estimated boundary layer thickness on different components of the FSAE vehicle model were made based on the resulting Reynolds number obtained for each of them with correlations varied accordingly and that the values of `EMBED SCALE` and Embed Layers were required to be positive integers which was duly considered before arriving at the above mentioned specifications.
Mesh 1:
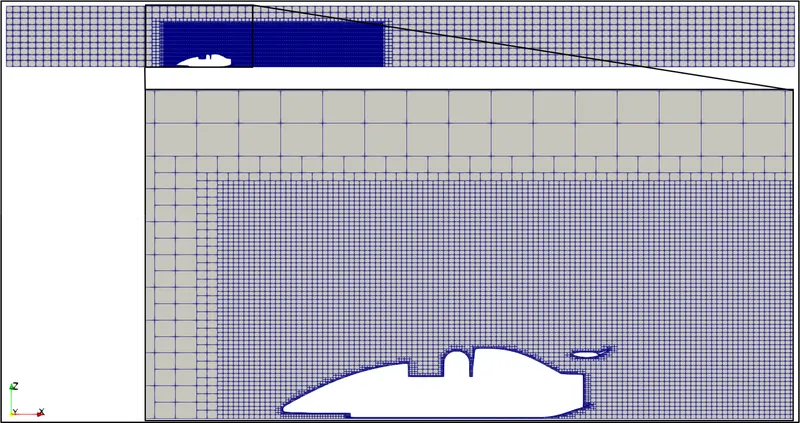
Fig. 2: Mesh 1 (two-dimensional expanded and close-up sliced views) for case 2 configuration
2.2.4 Determination of transient parameters for the fluid flow material across the computational domain
The setup of simulation run time and time-step for the given numerical problem with respect to the fluid material was defined such that the 'Start time' in the 'Simulation Time parameters' window under the 'Case Setup' tree was set to 0s while the 'End Time' in the same window depended on the domain length and the flow velocity, in the direction of flow, such that the fluid medium passed through it at least 2 flow through times so as to observe a particular trend or consistent transient behaviour. Therefore, 'End Time' was evaluated as:
`End Time = (L/U)*2`; where (Eq. 10)
`L` is the length of the computational domain in the direction of flow determined as 32.55473m
From (Eq. 10), the value of 'End Time' obtained is approximately equal to 5.2087s and 3.1252s for Race-1 and Race-2 conditions respectively. Time-step was decided based on the CFL number which is expressed below:
`CFL = (U*Delta t)/(Delta x)`; where (Eq. 11)
`Delta t` is time-step,
`Delta x` represents the smallest cell size, which in this case was the value of the First Cell Height in the turbulent boundary layer thickness on the Ahmed Body
In order to attain temporal accuracy and numerical stability, the CFL criteria was decided to be 1 and therefore, the value of time-step determined with this limiting value for different mesh sizes have been reported in Table 6.
| Racing Conditions | Mesh | `Delta t` (s) |
| Race - 1 | 1 | 0.000625 |
| Race - 2 | 1 | 0.000375 |
Table 5: Time-step (`Delta t`) values for mesh 1 configuration of the computational domain based on the FSAE vehicle model for two different racing conditions
The above value of time-steps reflect for a domain whose smallest cell size across it would remain at the value of `Delta y`, as reported earlier, however, with the cartesian cut-cell meshing approach and due to the complexity of features with regards to the given FSAE vehicle model, the same cannot always be achieved and therefore, the time marching solution process or 'Time-step selection' chosen was of type 'Use variable time-step algorithm'. A variable time-step allows for internally calculated time-step that in turn depends on additional inputs including minimum and maximum time-step, and maximum convection CFL, among others, such that the resultant value determined based on the corresponding limiting conditions on the inputs would represent the maximum permissible time-step for the next iteration to be performed. The initial, minimum and maximum time-step chosen for each setup is tabulated as seen in Table 6 below wherein the initial and minimum time-step were chosen to be a value that would be a reasonably good start for the simulation, considering the given setup, while the maximum time-step represents the `Delta t` values as calculated in Table 5.
| Racing Conditions | Mesh | Initial time-steps | Minimum time-steps | Maximum time-steps |
| Race - 1 | 1 | 1e-9 | 1e-9 | 0.000625 |
| Race - 2 | 1 | 1e-9 | 1e-9 | 0.000375 |
Table 6: Initial, minimum and maximum time-step values for mesh 1 configuration of the computational domain based on the FSAE vehicle model for two different racing conditions
Mesh statistics, average and minimum `y^+` values on the FSAE vehicle model for two different racing conditions using mesh 1 configuration:
|
Racing Conditions |
Mesh |
Cells |
Average `y^+` on FSAE vehicle |
Minimum `y^+` on FSAE Vehicle |
|
Race - 1 |
1 |
1188514 |
151.6871 |
20.8062 |
|
Race - 2 |
1 |
1224514 | 98.86878 | 4.10256 |
Table 7: Mesh statistics, average and minimum `y^+` values on the FSAE vehicle model for two different racing conditions using mesh 1 configuration
From Table 7, it can be seen that the minimum `y^+` value estimated using mesh 1 configuration for the two different racing conditions largely lies in the buffer region justifying the use of Automatic wall functions as the near wall treatment modeling approach for the SKW2006 turbulence model with respect to the given problem.
2.3 Post-Processing
The extended part of the solution process using Converge Studio v3.0 included selecting the variables of interest whose quantitative and qualitative aspects would highlight the behaviour of the flow, in this case within the given fluid domain and over the FSAE vehicle model, and they can be chosen by clicking on the 'Post variable selection' sub-option of the 'Output/Post-Processing' setting under the 'Case Setup' tree and checking the boxes 'Density', 'Pressure', 'Temperature', 'Velocity' and 'Vorticity 'in the 'Typical Variables' section and 'Region ID' in the 'Geometry/Location' section of the 'Typical Variables/Geometry' tab, 'Turbulent Kinetic Energy', 'Turbulent Length Scale', 'Turbulent Viscosity', 'Specific Dissipation Rate of tke (omega)', and '`y^+`' in the 'Turbulence' section of the 'Combustion/Turbulence' tab, and adding 'Mass Fraction' under 'Species' section of the 'Species/Passive' tab for `O_2` and `N_2` species with respect to the concerned numerical analysis. Visualising the different flow variable quantities in a two-dimensional space in ParaView required the creation of a slice of the given fluid domain by using the "Slice" tool in the 'Commons' toolbar typically located above the 'Pipeline Browser' window based on default layout settings and choosing 'Y Normal' under 'Plane Parameters' section to align the plane normal such that the entire domain was viewed in the direction of flow followed by unchecking the 'Show Plane' and 'Triangulate the slice' boxes for disabling the viewing of the plane borders and production of triangles in the output respectively.
Velocity field plots were created to view the development of the flow field characteristics across the fluid domain and over the FSAE vehicle model while Stream Tracer was added for identifying the separation and recirculation regions around the race car. Legends, titles, and x and y labels were added for better understanding of the graphical representations with regards to drag and downforce pressure distributions on the associated components of the FSAE vehicle. To save an animation file of the different field plots, the option 'Save Animation' was accessed under the 'File' menu and clicked on followed by choosing the appropriate settings under the different sections such as 'Size and Scaling', 'Coloring', 'Compression Options' and 'Animation Options' to name a few, assigning an appropriate name to the animation file, in this case by the variable whose field plot is being indicated before clicking on the 'OK' button.
2.4 Convergence Level
In the given computational analysis, a transient simulation using first-order implicit Euler time advancement scheme was performed to accommodate for larger time-steps while also being numerically stable along with a Density-based solver of type modified Pressure Implicit with Splitting of Operator (PISO) which is an iterative pressure-velocity coupling algorithm involving a predictor step for predicting solution of the momentum equation from which a pressure equation is obtained and solved whose correction is then consequently reapplied to the momentum equation such that this process continues until the desired level of accuracy is achieved. At the end of the momentum predictor and first corrector step, remaining transport equations are solved in series. In other words, momentum and pressure are solved at the first PISO iteration which enables calculation for velocity terms required by other transport equations and at the end of each iteration in the PISO loop, convergence criterion is checked for which in this case requires the density correction error term to be less than the value of PISO tolerance which remains unchanged for the given numerical simulation at its default value of 1e-03. The selection of solver types for the different equations within 'Solver parameters [Transient]' sub-option in the 'Simulation Parameters' settings under the 'Case Setup' tree included assigning SOR to Momentum, Pressure, Density, Energy, Turbulent Kinetic Energy (tke) and Specific Dissipation Rate (omega) equations. The SOR solver type is a generally preferred algorithm owing to its advantage in being computationally less expensive than the different forms of biconjugate gradient stabilized (BiCGSTAB) algorithms or HYBRID (wherever applicable). The solver types, convergence tolerance limits, and minimum and maximum iterations defined for the equations corresponding to the SKW2006 turbulence model equations for the transient state simulations and the monitor variable plots corresponding to the behaviour of pressure drag and pressure lift forces on the FSAE vehicle and its associated components are shown in the table and figure below:
|
Equations |
Solver Type |
Convergence Tolerance |
Minimum Iterations |
Maximum Iterations |
Preconditioner |
|
Momentum |
SOR |
1e-05 |
2 |
50 |
None |
|
Pressure |
CONVERGE BiCGSTAB |
1e-08 |
2 |
500 |
None |
|
Density |
SOR |
1e-04 |
2 |
20 |
None |
|
Energy |
SOR |
1e-04 |
2 |
20 |
None |
|
Turbulent Kinetic Energy (tke) |
SOR (pre-defined) |
1e-03 |
2 |
50 |
None (pre-defined) |
|
Specific Dissipation Rate (omega) |
SOR (pre-defined) | 1e-03 | 2 | 50 | None (pre-defined) |
Table 8: Solver Types, Convergence Tolerance Values, Minimum and Maximum Iterations and Preconditioners of the different equations used in the SKW2006 turbulence model
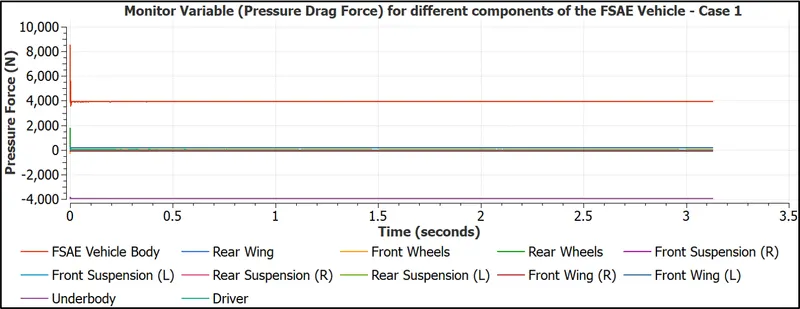
Fig. 3: Pressure drag force boundary variables plot for different components of the FSAE Vehicle in Race-1 conditions, including the Driver, with respect to transient simulation using SKW2006 turbulence model for mesh 1 configuration
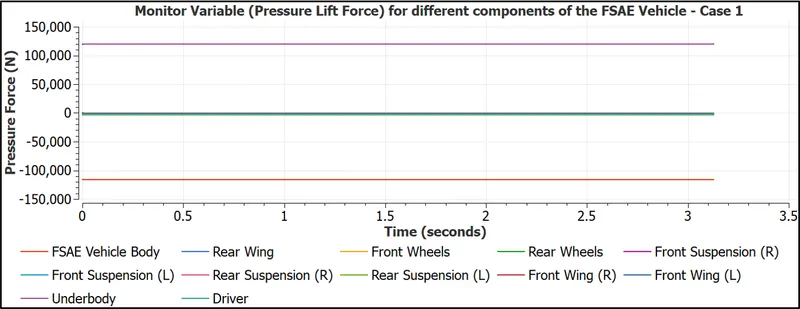
Fig. 4: Pressure lift force boundary variables plot for different components of the FSAE Vehicle in Race-1 conditions, including the Driver, with respect to transient simulation using SKW2006 turbulence model for mesh 1 configuration
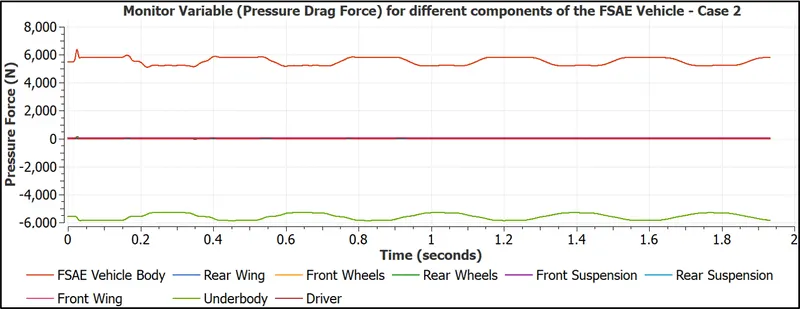
Fig. 5: Pressure drag force boundary variables plot for different components of the FSAE Vehicle in Race-2 conditions, including the Driver, with respect to transient simulation using SKW2006 turbulence model for mesh 1 configuration
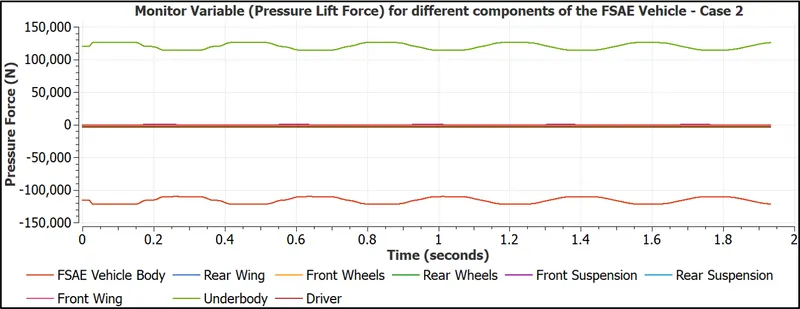
Fig. 6: Pressure lift force boundary variables plot for different components of the FSAE Vehicle in Race-2 conditions, including the Driver, with respect to transient simulation using SKW2006 turbulence model for mesh 1 configuration
From Fig. 3, Fig.4, Fig. 5 and Fig. 6, we can notice that the monitor variable plots shows a steady and cyclic output for Race-1 (Case 1) and Race-2 (Case 2) conditions respectively with almost similar but unexpectedly opposite trends in terms of variations of the drag and lift forces especially on the 'Underbody' in case of the latter (Race-2) . Having said that, the trends do look favourable for the 'FSAE Vehicle Body' which remains consistent from 1s to 1.8s time period indicating that an averaged value may be considered for the corresponding quantities and at which point the simulation run was subsequently stopped.
3. Results
3.1 Identification of separation and recirculation regions using velocity field plots and stream tracers
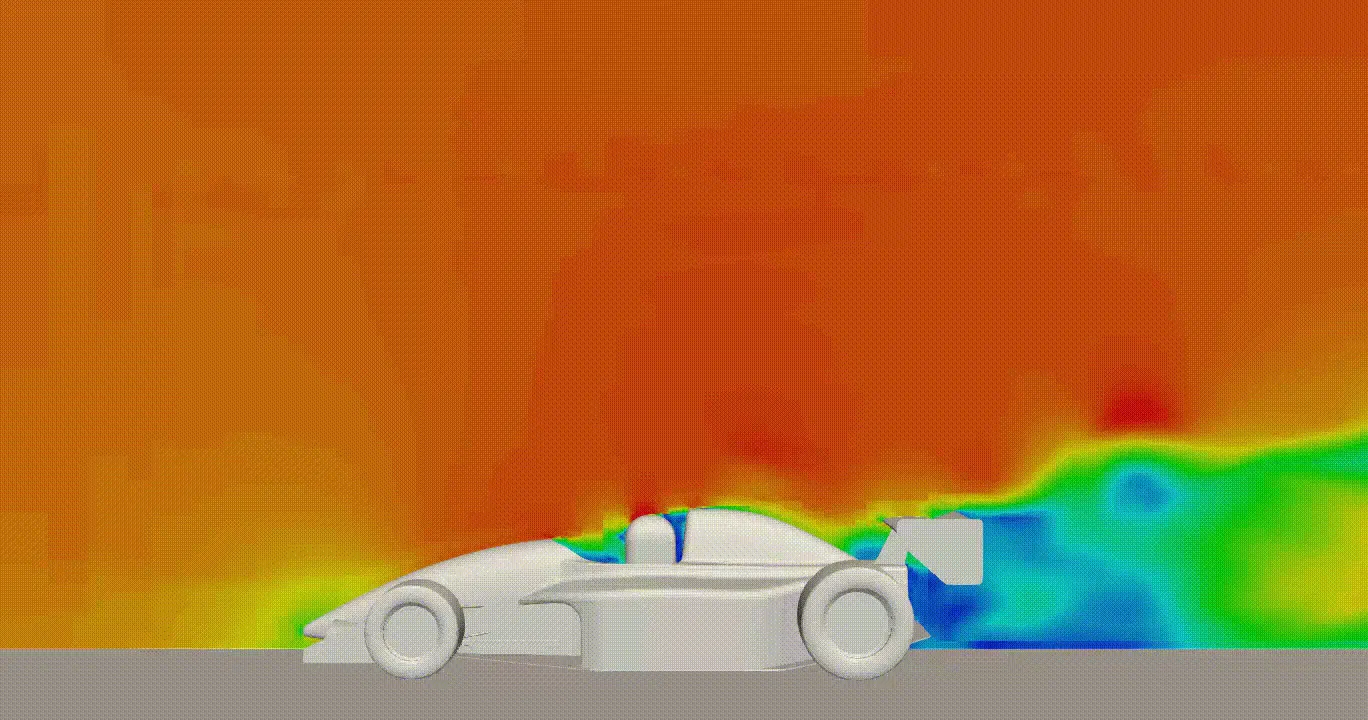
Fig. 7, and Fig. 9 and 11 shows the animations for velocity field plot across the fluid domain and at the slice regions created by orienting the plane normal to the flow direction, as was specified in Section 2.3 Post-Processing, for Race-1 and Race-2 conditions respectively at their corresponding time step numbers while Fig. 8 and Fig. 10 depict stream tracers flowing past the FSAE vehicle for Race-1 and Race-2 conditions respectively. It can be noticed that for the Race-1 condition which highlights a lap with "lots of turns", a large portion of the flow separation occurs in the region of the FSAE vehicle that does not make first contact with the incoming velocity profile but produces a significantly smaller wake region when compared to Race-2 condition which is indicative of a lap configured for "straights". Moreover, the flow separation and recirculation regions become visually more clearer with Fig. 11 where the flow impinging on the nose cone area of the FSAE vehicle body separates but into distinctive patterns appearing almost attached over the upper and lower surfaces of it before encountering sudden changes in geometrical area, creating local zones of low pressure, in the open cockpit between the driver, and over the trailing edges of the FSAE vehicle body and the underbody as well as between it at different time-step values.
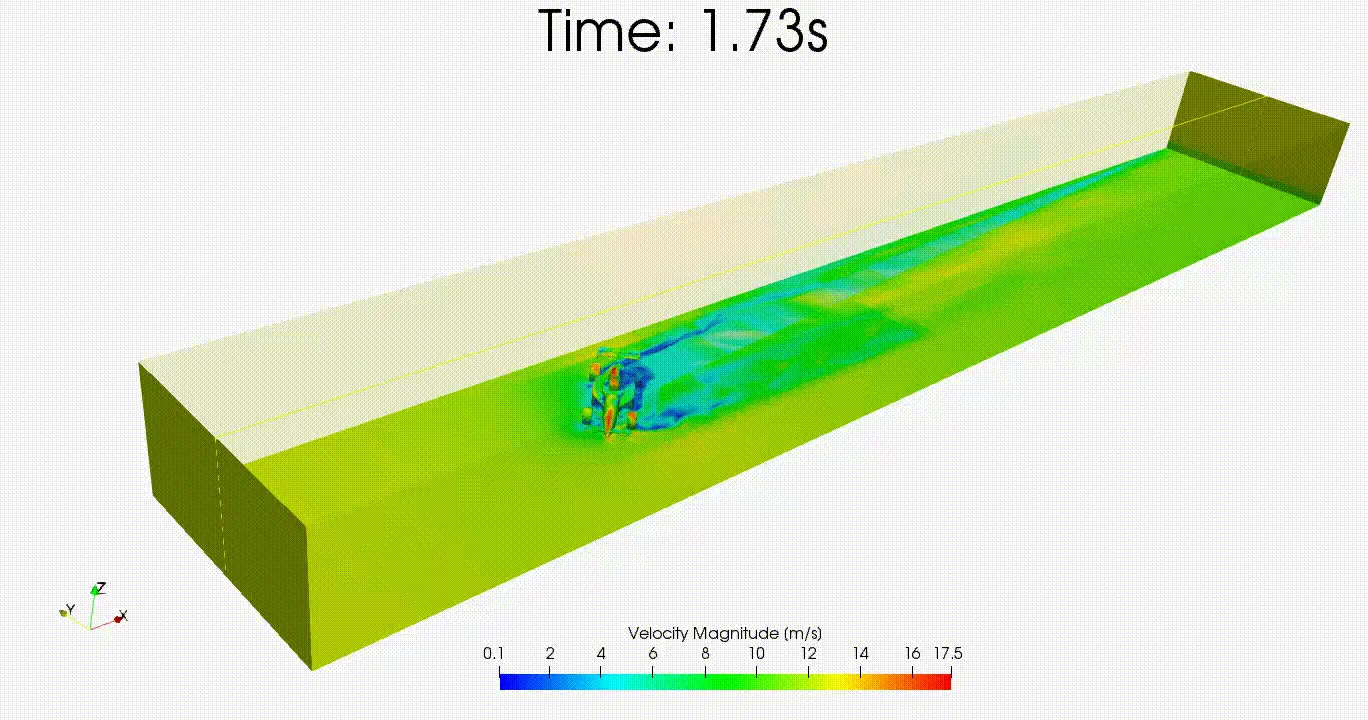
Fig. 7: Animation of the velocity magnitude field plot across the fluid domain for Race-1 conditions
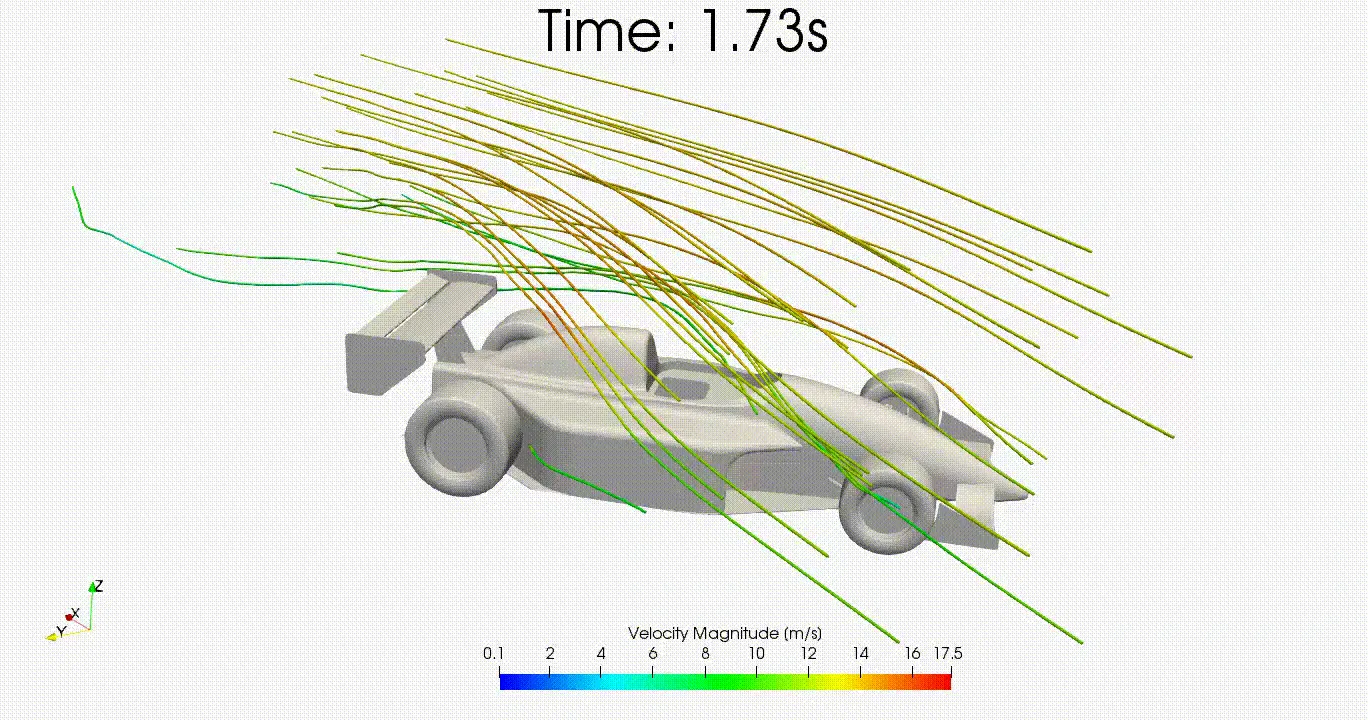
Fig. 8: Animation of the stream tracers flowing past the FSAE vehicle for Race-1 conditions
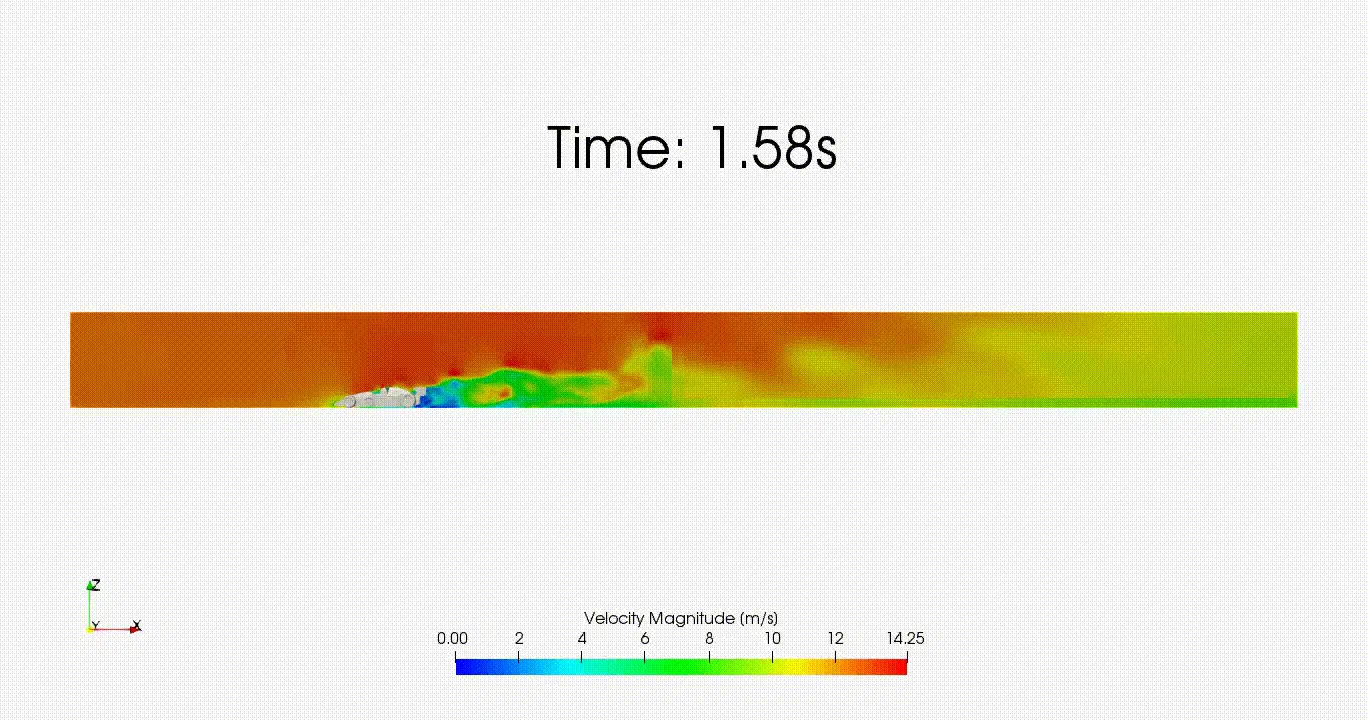
(a) (b)
Fig. 9: Animation of the velocity magnitude field plot at the slice region created by orienting the plane normal to the flow direction for Race-2 conditions in (a) expanded view, and (b) close-up view
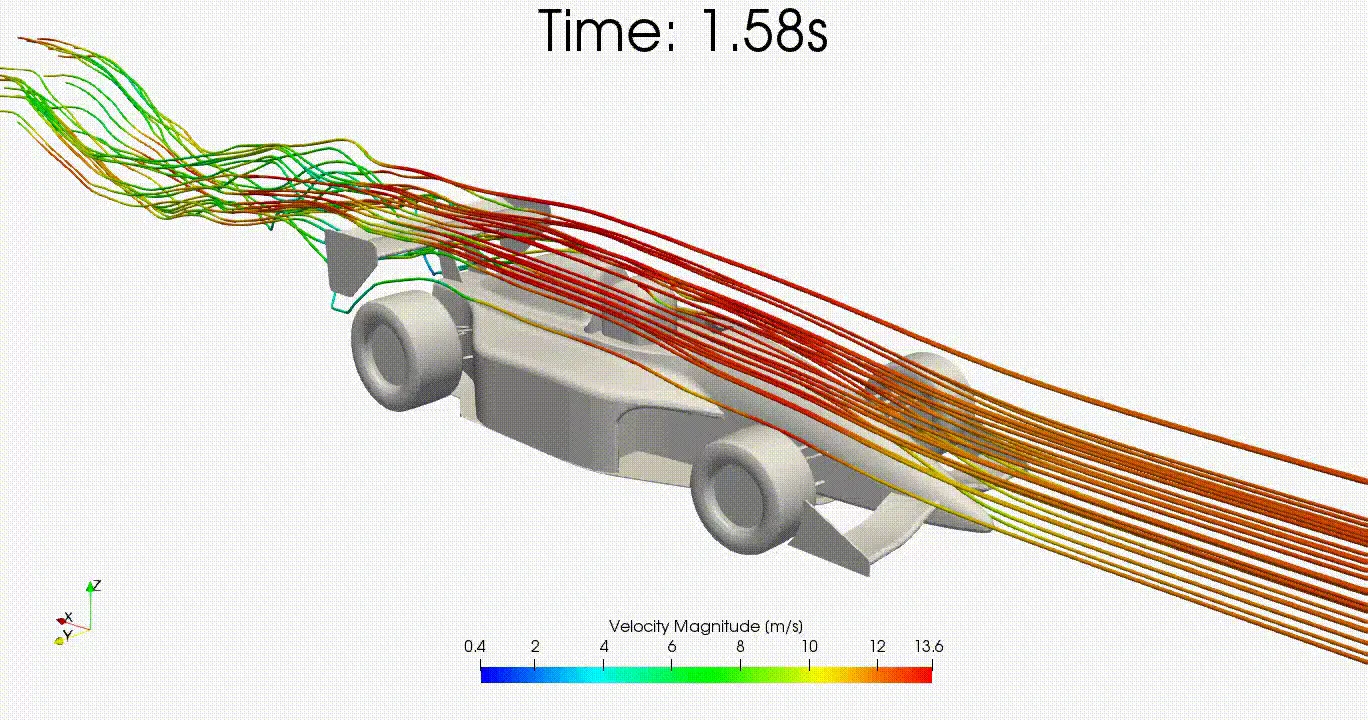
Fig. 10: Animation of the stream tracers flowing past the FSAE vehicle for Race-2 conditions
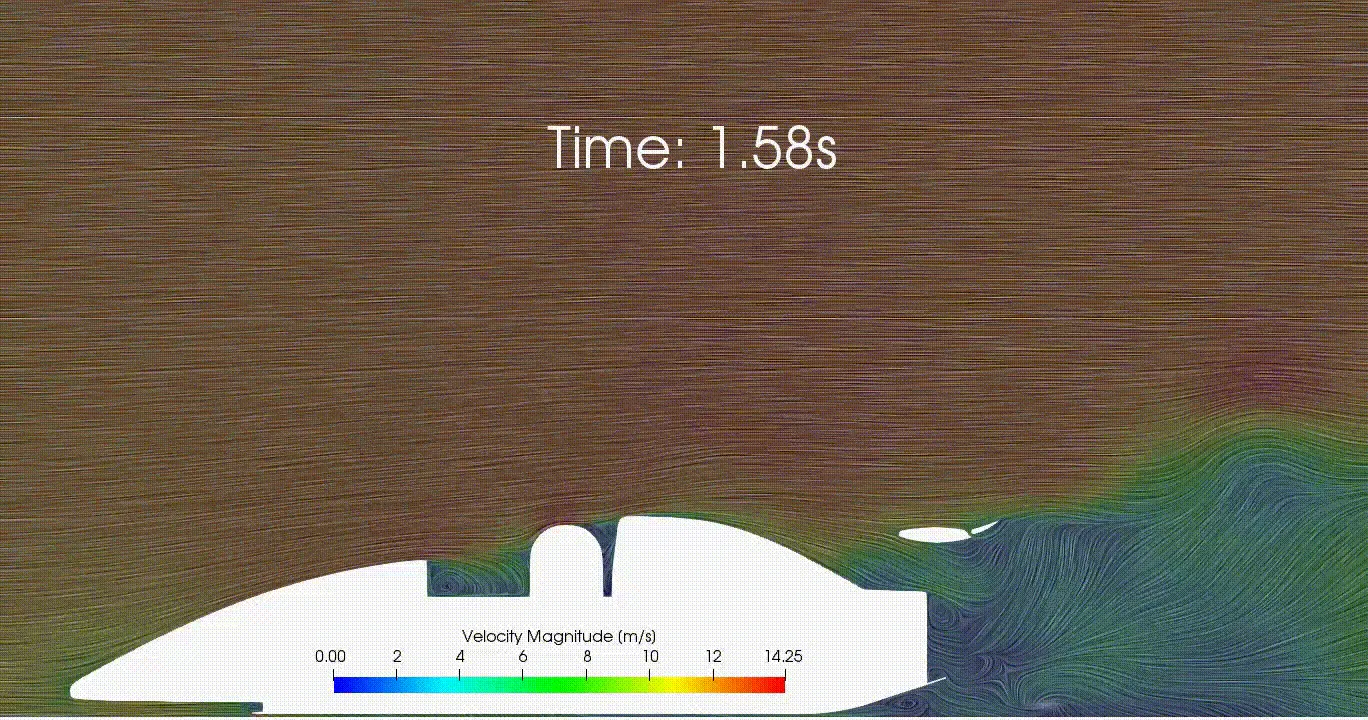
Fig. 11: Animation of the velocity magnitude field plot using integration method on streamlines, dependent on the value of vectors, at the slice region created by orienting the plane normal to the flow direction for Race-2 conditions
3.2 Drag force and Downforce pressure distributions averaged over different time intervals for two different racing conditions on the associated components of the FSAE Vehicle
The figures below i.e., Fig.12 to Fig. 15, shows the averaged values of the drag force and downforce and percentage representations in terms of their total values for the two racing conditions. It can be observed that the major contributors of drag force and downforce alternates between the FSAE vehicle body and underbody in both racing conditions, also appearing to be of almost similar magnitudes, with very minimum effects from the front wings and rear wings at least in regards to the downforce component.
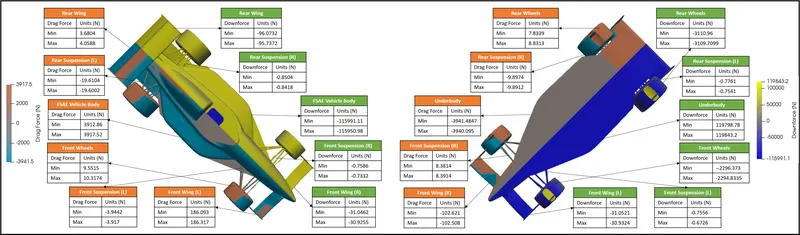
Fig. 12: Drag force and Downforce pressure distributions averaged over a time period from 2s to 3.1284s on the different components of the FSAE Vehicle in Race-1 conditions
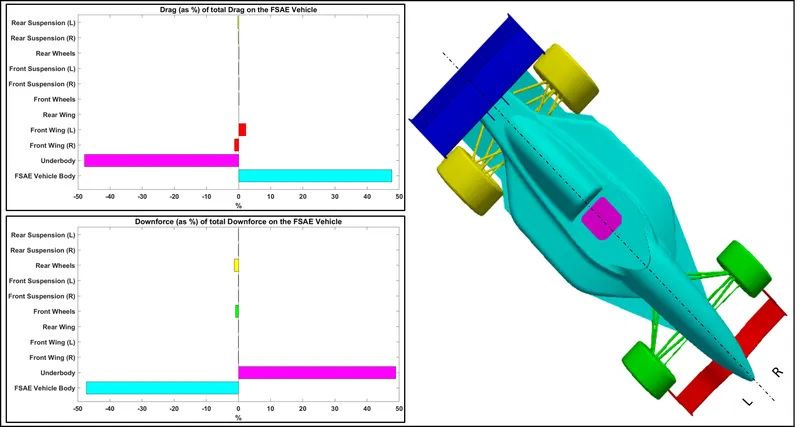
Fig. 13: Drag force and Downforce pressure distributions (as % values) averaged over a time period from 2s to 3.1284s on the different components of the FSAE Vehicle in Race-1 conditions
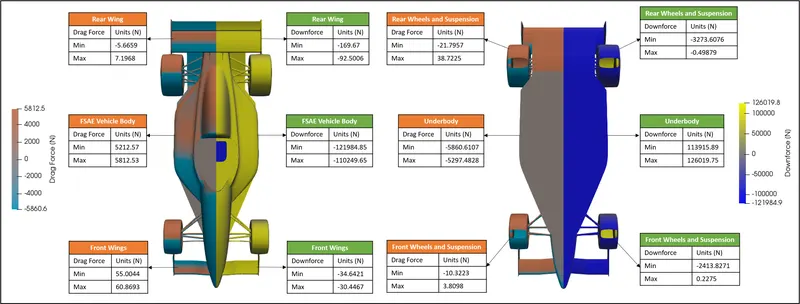
Fig. 14: Drag force and Downforce pressure distributions averaged over a time period from 1s to 1.8s on the different components of the FSAE Vehicle in Race-2 conditions
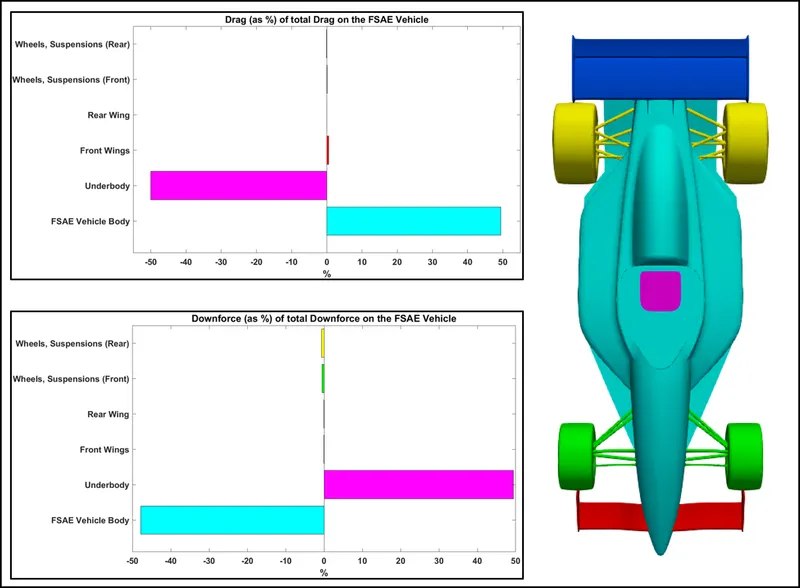
Fig. 15: Drag force and Downforce pressure distributions (as % values) averaged over a time period from 1s to 1.8s on the different components of the FSAE Vehicle in Race-2 conditions
4. Discussion
Air, containing a mixture of two major contributing gas species `O_2` and `N_2` by mass fraction, enters at the inlet of the given cross-section of the computational domain consisting of a FSAE vehicle model as a turbulent flow which deflects away at the nosecone region but immediately reattaches at the upper and lower surfaces of the FSAE vehicle body, as a result of its continuous motion, before encountering abrupt changes at different regions leading to minor separations and yet more reattachments which due to the dynamic nature of the flow field do not appear to become steady and eventually go on to form a wake region behind the vehicle. As highlighted in Section 3 Results, velocity field plots represented using integration method on streamlines that were dependent on the value of vectors, and drag force and downforce statistics for different components, the major contributors of the same are the FSAE vehicle body and the underbody, however, conversely for the latter based on the expected trends despite being nearly counterbalanced. The expected flow physics for the underbody should be a two-fold effect such that when the air reaches the given component, the flow hits against a small surface, perpendicularly aligned to it, creating a stagnation point and forcing the formation of swirls followed by the very low ground clearance allowing very minimum air to accelerate and rush past the same surface which towards the tapered trailing surface follows it to a certain extent before eventually separating promoting positive drag. The strange anomaly, however, exists with a negative drag value on the underbody which in other words is also possibly indicative of the mesh in the region, either too drastic aspect ratios and/or mainly the overall shape and size of the underbody. It is also worth noting that the front wings and rear wing have very minimum downforce effects but more significant drag force drawbacks and this calls for further inspection in terms of its position on the FSAE vehicle body both laterally and longitudinally such that its actual presence of "pressing down" the air on the vehicle is produced. Additionally, the profiles of the front and rear wings also play a huge role in delaying flow separation which in turn contributes to an overall increase in the downforce and subsequent decrease in the drag force and can be configured to an optimum angle of attack based on the available information of the two different racing conditions.
5. Conclusion
The three-dimensional and transient numerical analysis of the computational domain consisting of a FSAE vehicle model using the SKW2006 turbulence model for two different racing conditions in Converge Studio v3.0 and executed using the Cygwin64 terminal was well understood. It was realised that implementing an appropriate wall modelling approach like the automatic wall function with respect to the empirically estimated `y^+` values, the numerical simulation was able to reproduce the flow characteristics around the FSAE vehicle model to a reasonable agreement albeit the anomaly of drag force values on the underbody. A refined mesh or different meshing approach that would capture the gradients better especially in the flow separation areas and at the underbody, and improvement to the design of the given FSAE vehicle model is required to be assessed and is under consideration from a future scope of study.
References
[1] Wilcox, D.C., Turbulence Modeling for CFD, Third Edition, DCW Industries, Inc., 2006
[2] Engineers Edge, LLC, Viscosity of air, Dynamic and Kinematic, www.engineersedge.com, viewed 09 September 2021, <https://www.engineersedge.com/physics/viscosity_of_air_dynamic_and_kinematic_14483.htm#:~:text=The%20viscosity%20of%20air%20depends,2%20%2Fs%20or%2014.8%20cSt.>
[3] CONVERGE 3.0 Manual. © 2020 Convergent Science. All rights reserved. July 15, 2020.